Have a personal or library account? Click to login
Explaining Cross-Country Differences in the Number of Judges per Capita Cover

Explaining Cross-Country Differences in the Number of Judges per Capita

By:   
Open Access
|Jun 2024

Figures & Tables

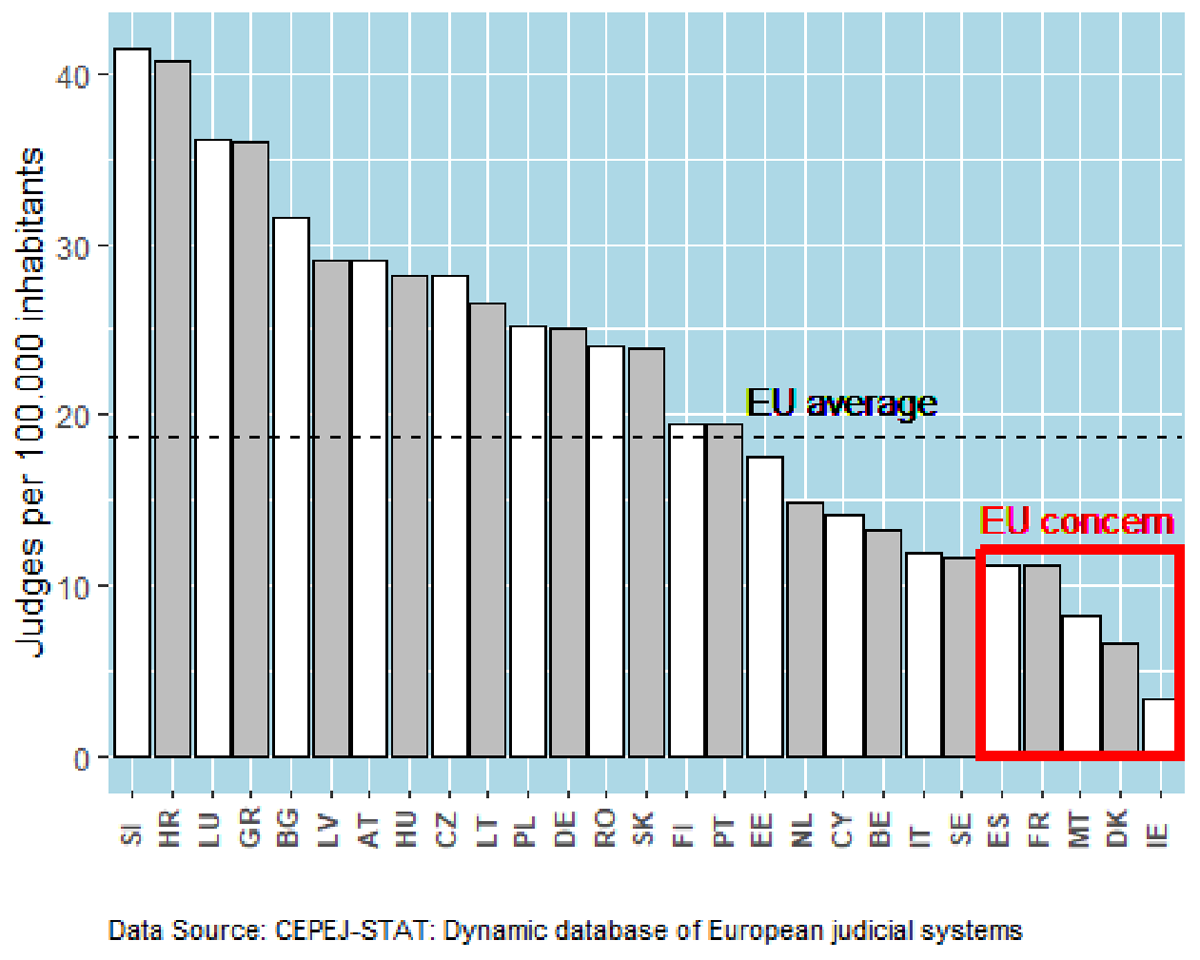
Figure 1

Professional judges per capita.
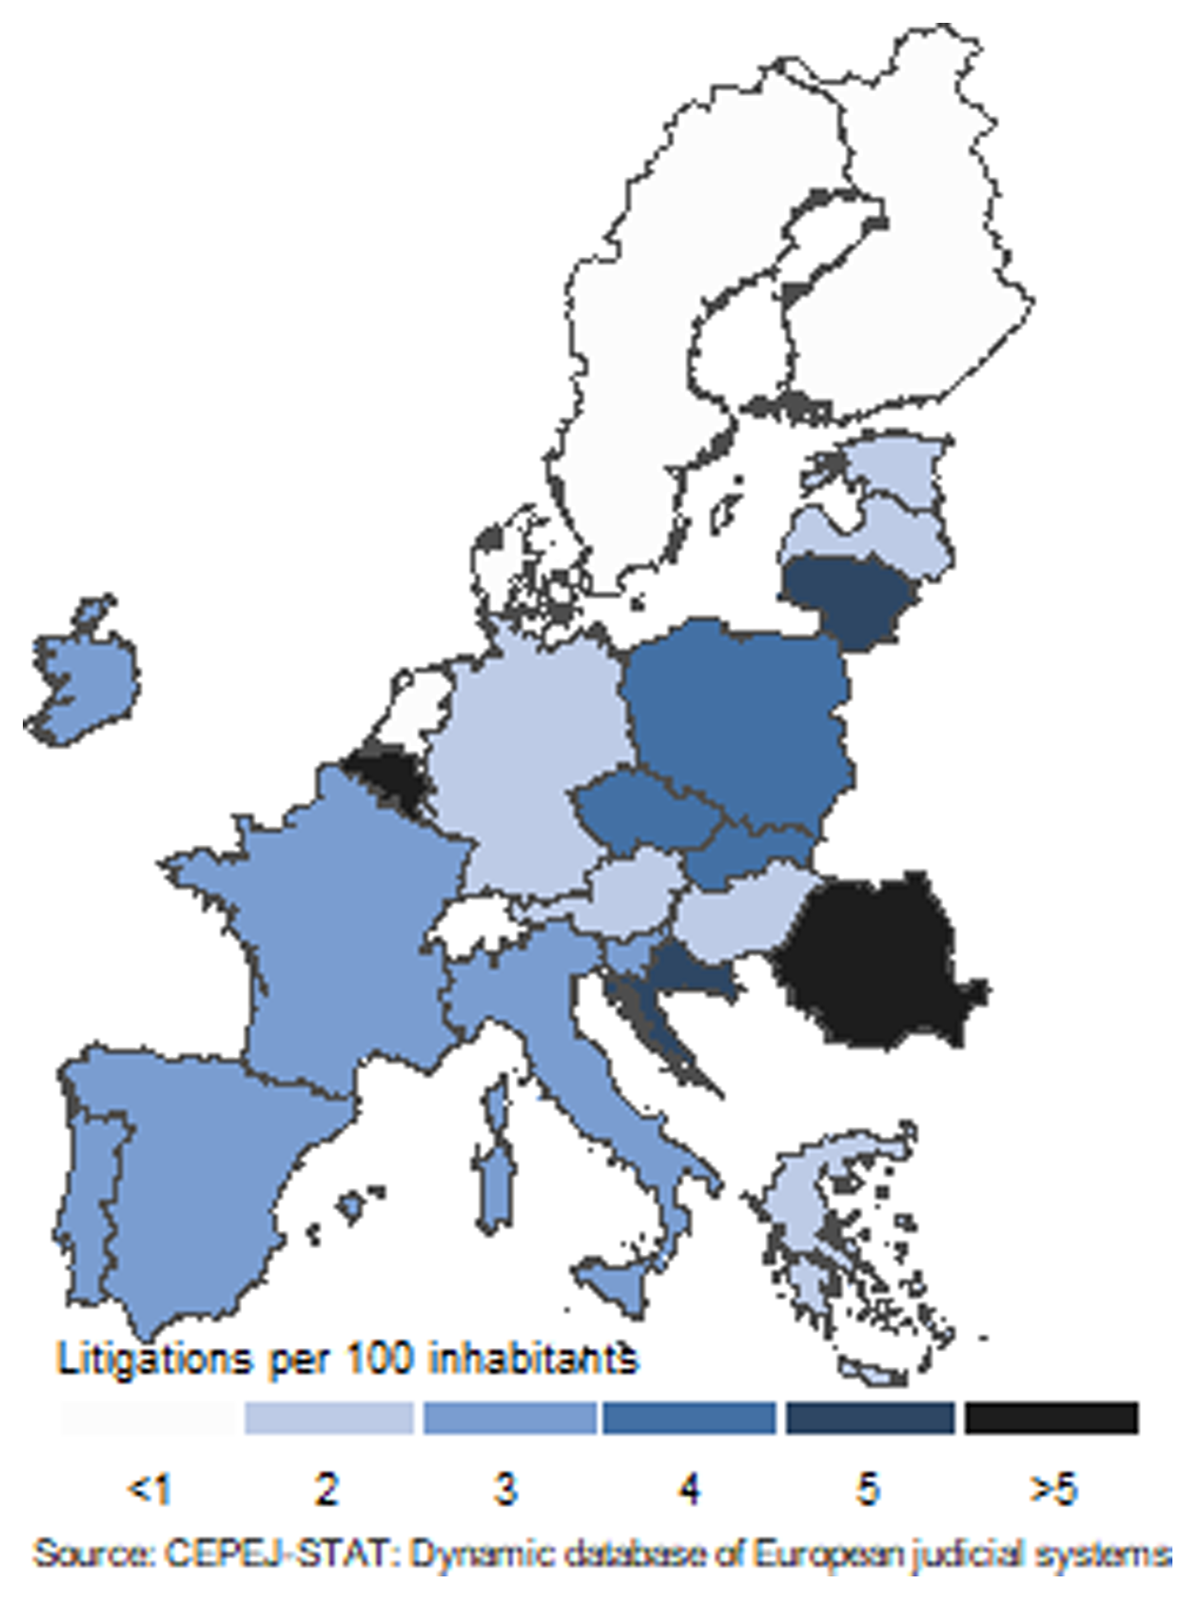
Figure 2

Civil and commercial litigations per 100 inhabitants.
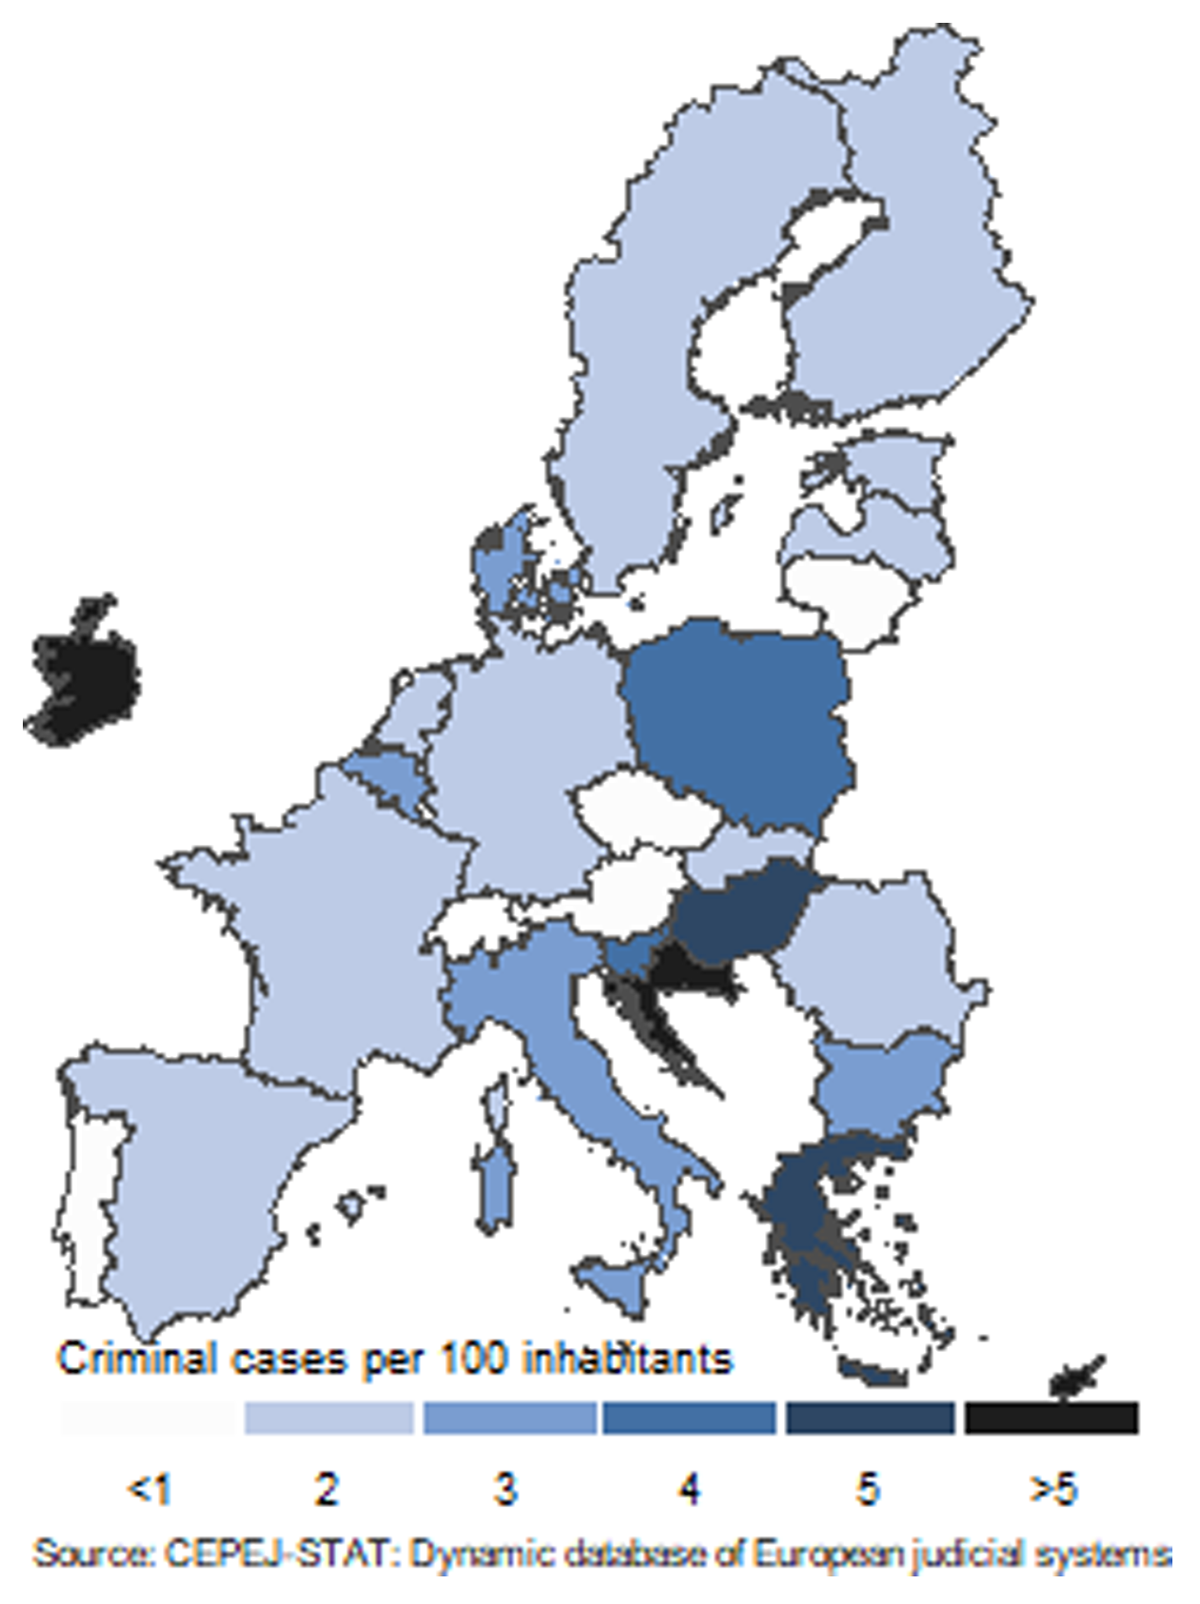
Figure 3

Criminal cases per 100 inhabitants.
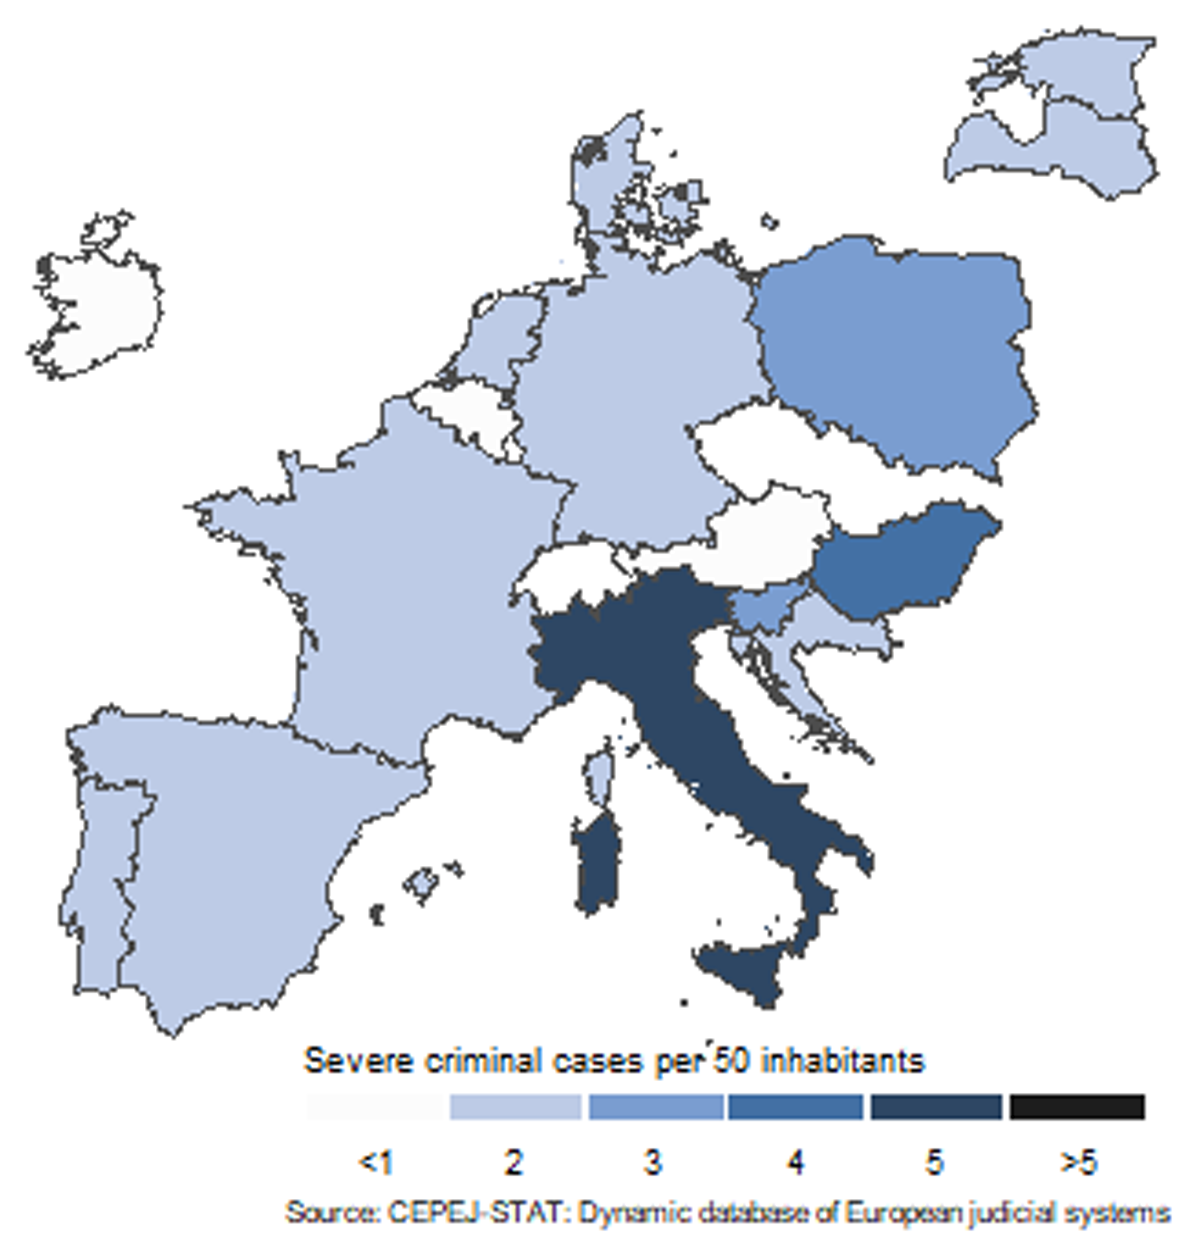
Figure 4

Severe criminal cases per 50 inhabitants.
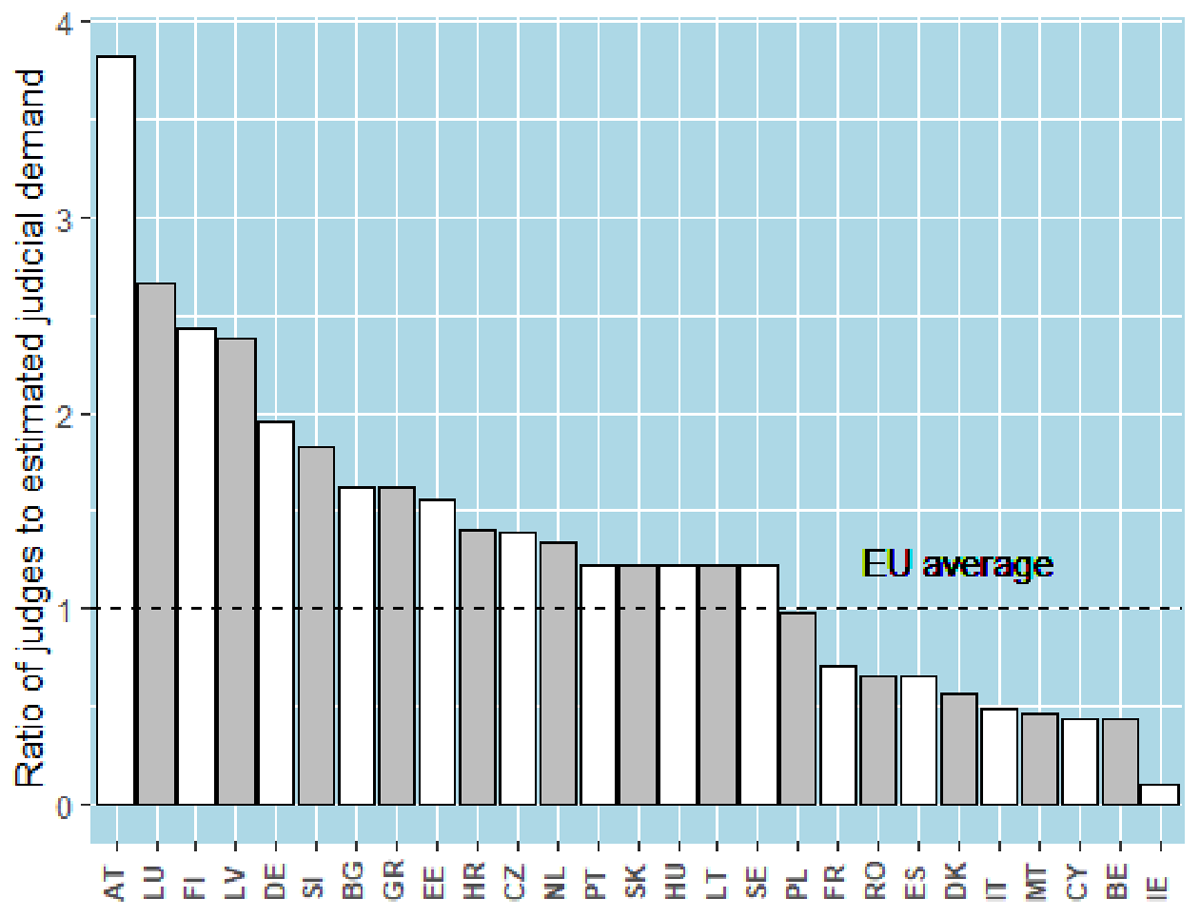
Figure 5

Ratio of professional judges to population-generated judicial demand (simple estimate).
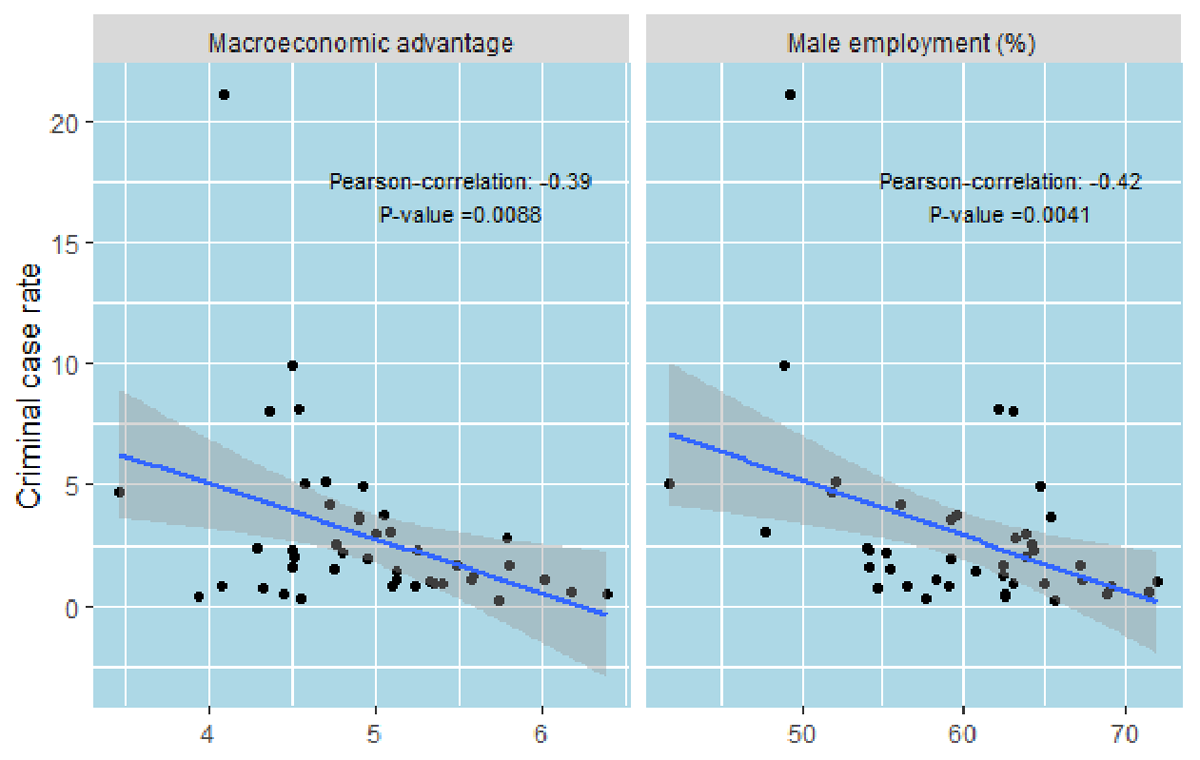
Figure 6

Correlation with the criminal case rate.
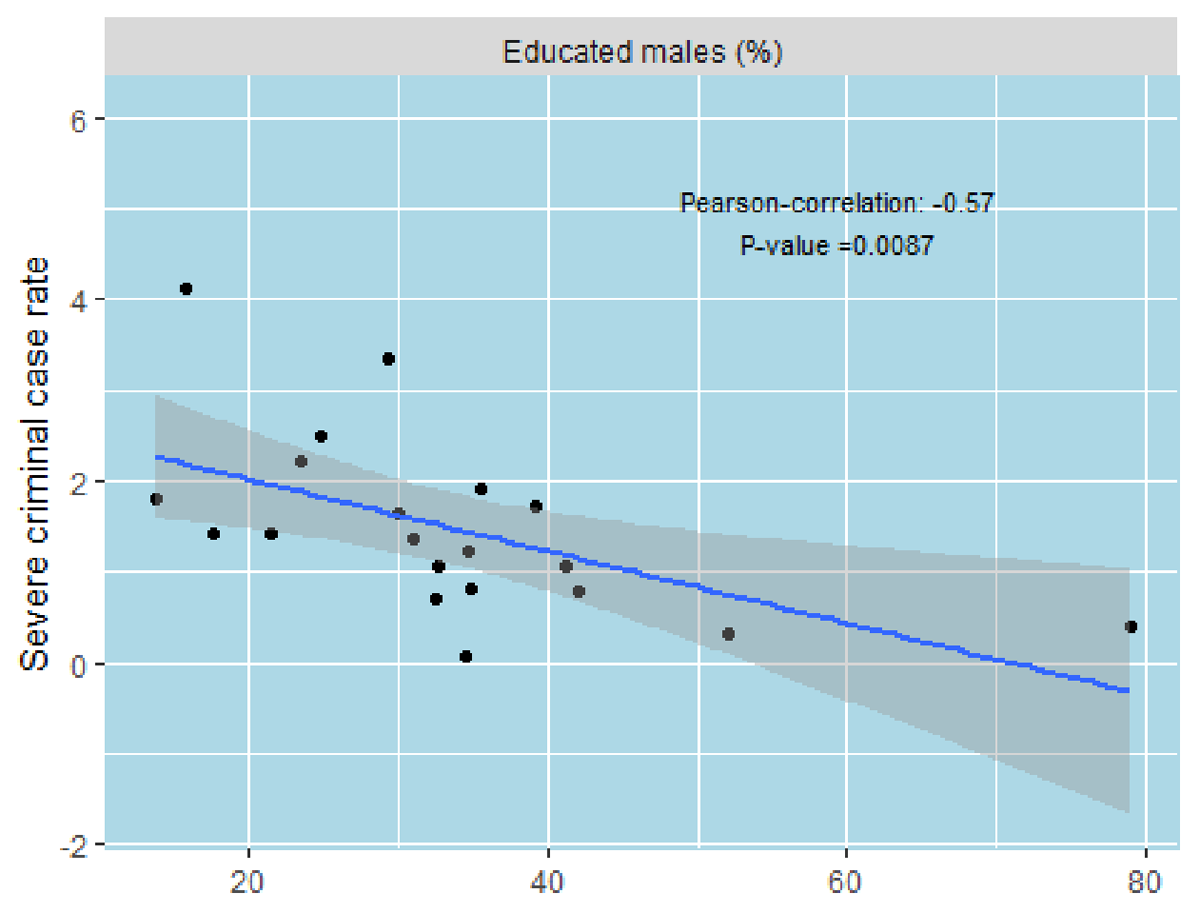
Figure 7

Correlation with the severe criminal case rate.
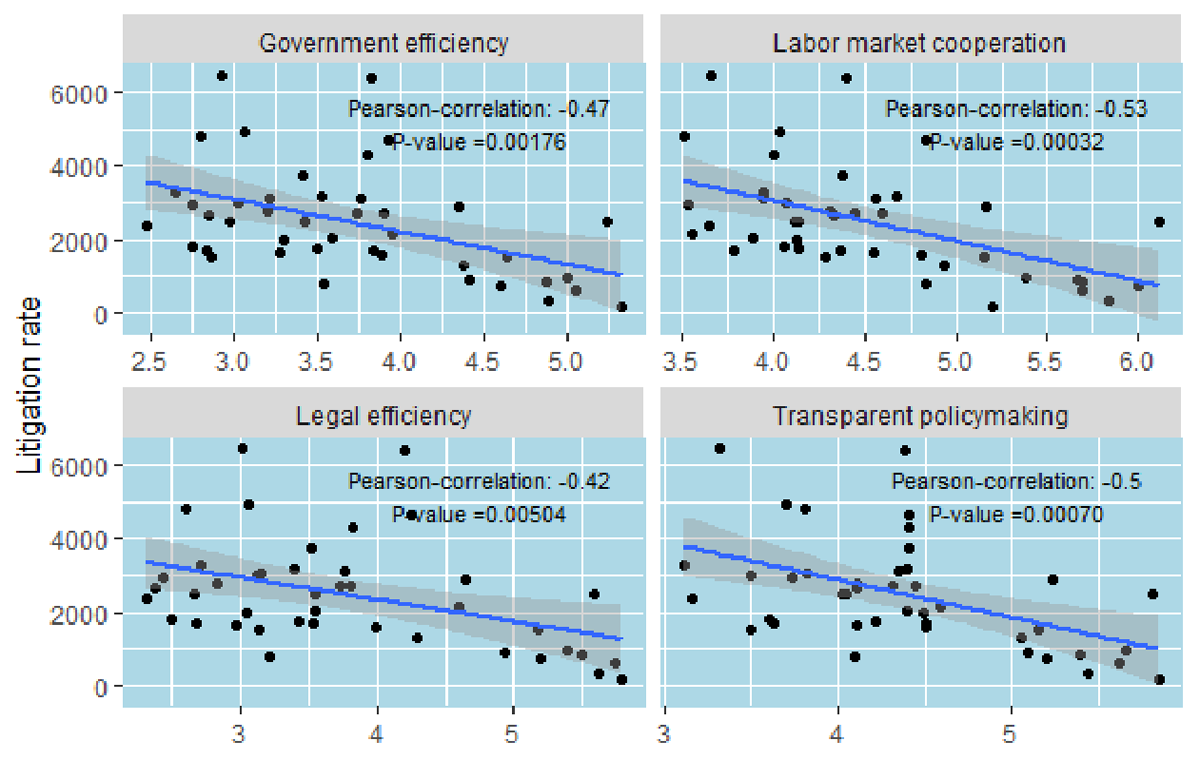
Figure 8

Correlation with the litigation rate.
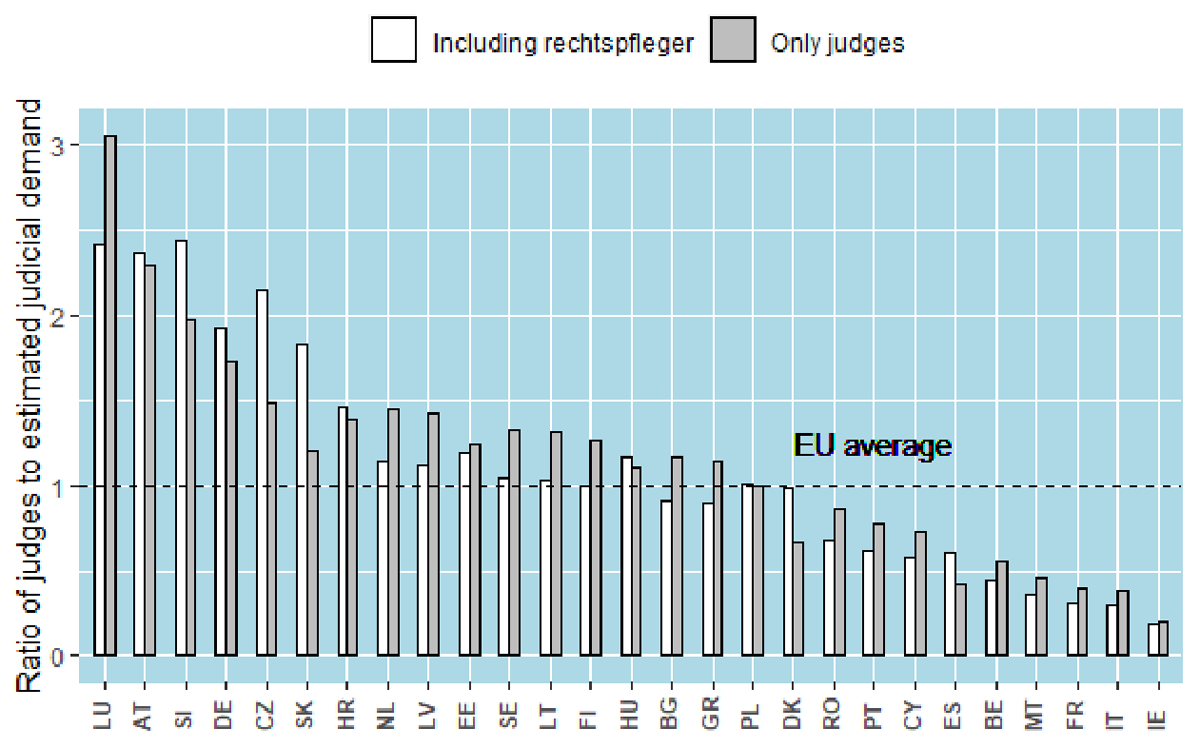
Figure 9

Ratio of judges to population-generated demand (advanced estimate).

DOI: https://doi.org/10.36745/ijca.581 | Journal eISSN: 2156-7964
Language: English
Page range: 3 - 3
Published on: Jun 10, 2024
Published by: International Association for Court Administration
In partnership with: Paradigm Publishing Services

© 2024 Jesper Wittrup, published by International Association for Court Administration
This work is licensed under the Creative Commons Attribution 4.0 License.