
Introduction
Modern technology has provided an abundance of easily accessible data which are increasingly applied to compare and benchmark judicial systems. While there is certainly an understandable demand for holding judiciaries accountable to international standards and benchmarks, there is unfortunately also a risk that such data are applied in ways that can lead to wrong conclusions and harmful decisions.
When cross-country comparisons are made for the number of judges per capita, an automatic reaction may be to conclude that countries with a below-average number have a need for more judges, while countries with a higher-than-average number do perhaps have too many judges. There are, however, several reasons to be cautious in this regard. Just like we do not expect different regions within the same country to have the same need for judges in relation to the number of inhabitants, because different regions have different socio-economic conditions and therefore different judicial needs, we should not expect different countries to have the same demand for judicial services.
This paper seeks to identify the most important socio-economic indicators driving the demand for judicial services.
The indicators will then be applied to provide an alternative assessment of the comparative need for judges in EU countries. It is not the claim that the alternative assessment provided here is perfect. It may certainly be refined in several ways. This could be perceived as a preliminary step towards establishing a more sophisticated methodology for benchmarking judicial needs.
Motivation
The question of determining the adequate number of judges is crucial for assessing any judicial system. The best approach for conducting a judicial needs assessment is undoubtedly to apply some form of case weighting system,1 which considers in detail the time needed for a judge to handle all the different types of cases which courts are faced with. It may, however, be laborious and complicated to establish and maintain a well-functioning case weighting system. Although better and faster methodologies have been developed in recent years,2 many countries do not appear to have the tools for accurately assessing their judicial needs.
In lack of a better system, it may be tempting instead to rely primarily on statistics for the number of judges per capita when making claims about whether a given country needs to increase its investment in the judiciary or not. Following this logic, we may compare the number of judges per capita in country i, Jpci, with the average number of judges per capita in the entire EU, JpcEU, to estimate the amount of judicial supply, JSi, in country i.
If this indicator is considerably below 1, then one may be concerned about the lack of judges.
The above-mentioned approach is common. For example, the EU Rule of Law report points the finger at those EU countries with the lowest number of judges per capita. In the 2022 report3 concern is raised because of the relatively low number of judges per capita in Ireland, Denmark, Malta, France and Spain.4 See Figure 1.
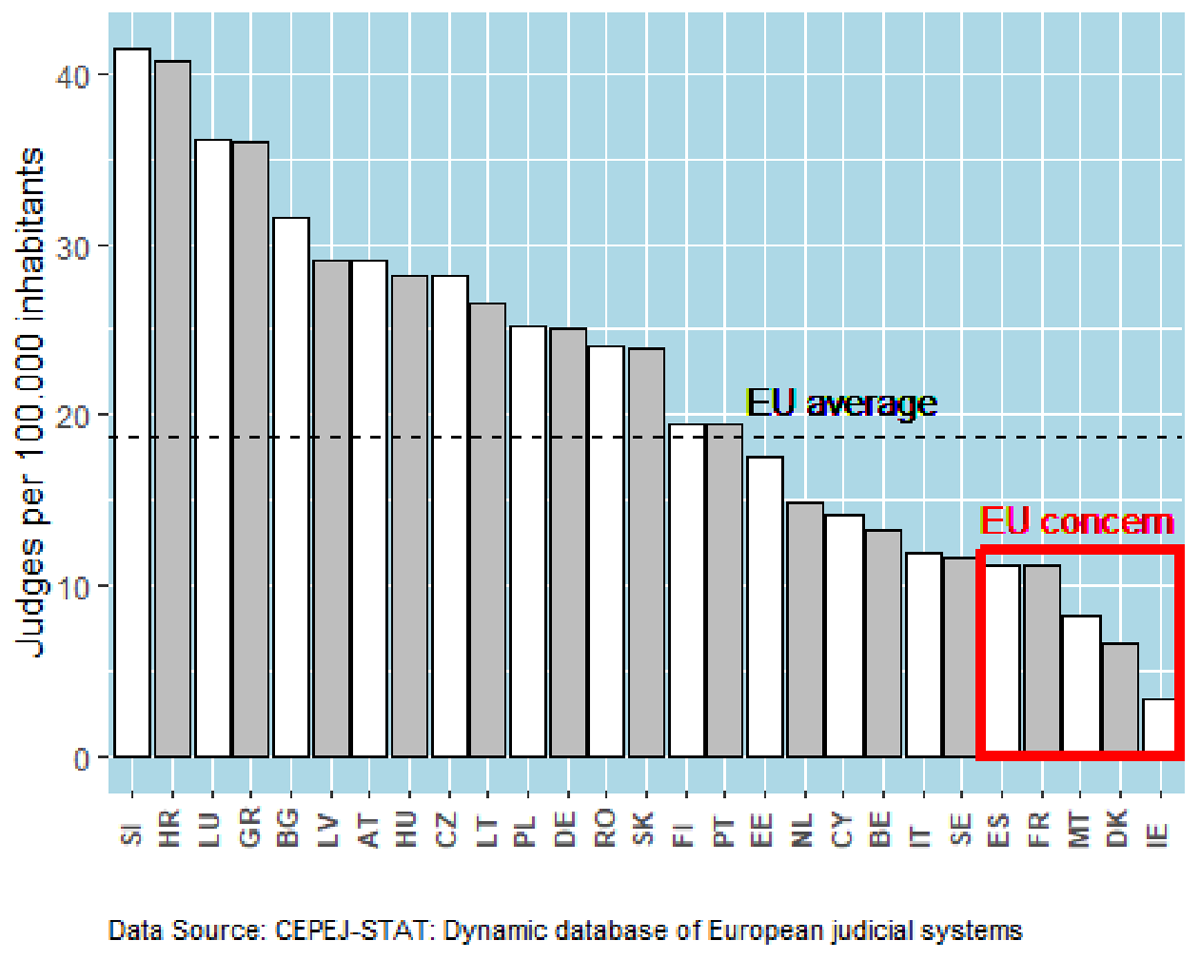
Figure 1
Professional judges per capita.
While it is possible that these countries could benefit from an increase in the number of judges, it does not require any deep reflection to assert that one cannot conclude this only from the comparison with the EU average. The vast differences regarding the structures of European judicial systems are a huge challenge facing any comparative analysis of the number of judges. An introductory discussion of these challenges, when relying upon data from CEPEJ, is provided by Fabri.5
More specifically, the following issues may seriously impact the assessment of the proper number of judges:
Differences in the way professional judges are defined and counted. The countries reporting to CEPEJ may not have a uniform approach for counting judges. For instance, some countries have omitted reporting certain types of judges. Some countries have reported the number of judges according to the Full-time-equivalent-method, while others have not. On top of this, one may argue that so-called ‘rechtspflegers’, which are counted separately, in some countries function more or less as junior judges.
Differences in the assistance judges receive, both in the form of judicial assistants and clerks, and in the form of case-management and ICT systems, may impact the ‘real’ workload of judges.
Differences regarding the existence of autonomous or semi-autonomous bodies handling administrative or civil complaints (‘quasi courts’), or alternative dispute resolution mechanisms which may in some countries handle cases, courts would otherwise handle.
Differences regarding work performed by non-professional judges.
Different barriers and incentives to initiating cases. Court fees, or requirements to be represented in court by a lawyer, or access to appeal may impact the number of cases reaching courts. Other incentives may impact litigation rates. As argued by Ramseyer and Rasmusen,6 the degree of predictability of court decisions may have a significant impact. The more predictable the outcome of a litigation process is, the more likely it is that the case can be settled without bothering the court system. Thus, the existence and publication of decision guidelines may lower litigation rates. Furthermore, as shown by Bielen et al.,7 severe backlogs could have a negative impact on litigation rates since people will be less inclined to initiate litigation if they expect cases to drag on for an exceptionally long time.
Differences regarding the types of non-litigious cases reaching courts. E.g., in some countries, courts handle consensual divorces or carry out notary functions, whilst not doing so in other countries.
Other differences, such as regarding specialization, the requirement to decide cases in panels and the number of court levels.
In addition, it is reasonable to expect that the amount of judicial dispute resolution needed is impacted by various socioeconomic conditions. This is the focus of this paper: to show that demand for judicial services is a function of such indicators, and that demand differs across countries. Moreover, I want to demonstrate that if these differences in demand for judicial services are considered, the conclusion about which countries are most in need of additional judges may be different.
Methodology
The particular methodology applied in this paper has been developed as part of a project for assessing the need for judges in Georgia (the country, not the US state).8
One source of inspiration is the literature on benchmarking. Benchmarking is focused on comparing the performance of units (companies, public institutions, countries etc.). It is quite common in this type of research to evaluate units by looking at the actual performance compared to a predicted normative standard.
A prominent example of this is found in the research on school performance.9 The quality of schools is often estimated based on exam results. However, research has established that exam results are to a large degree determined by socio-economic factors, such as the income and educational level of the parents. Schools in “wealthy” neighborhoods will consequently almost automatically obtain better exam results than other schools. If we want to assess the “real” performance (value added) of schools, we need to take these factors into account. If we have access to data for the socio-economic status of students (and their parents) we can use this information to predict the exam results. “Good” schools are then schools that are able to add additional value and obtain results which exceed these predictions/expectations.
In an equivalent way, this paper assesses the need for judges according to whether the actual number exceeds what can be expected just from looking at socio-economic factors etc.
Another source of inspiration for the applied methodology is the more general work on identifying latent (unobservable) variables in social science research, such as the research aimed at estimating the size of shadow-economies10 and many other applications.
Seen from this perspective, the true demand for justice (or need for judges) per capita, in say criminal cases, is a latent variable. It is correlated with, and partly explaining, the number of actual criminal cases per capita. Furthermore, it is correlated with a number of causal variables, such as indicators that may be used to predict the amount of crime in society. We may then use these other variables, as well as their co-variance with the number of criminal cases per capita, to estimate the latent variable.
Simple alternative estimate: Considering differences in the actual case rates
One may assume that not only the size of the population, but also the characteristics of the population and overall society, have an impact on the demand for judicial services.
In several of its reports CEPEJ has taken note of the vast differences in the ‘case rate’, the number of cases per 100 inhabitants. In the 2016-report it is, for example, stated that ‘figures on the number of incoming and resolved cases per 100 inhabitants offer a clear picture of the workload and productivity of the different European judicial systems in general’.11
For civil and commercial cases, it appears especially relevant to compare litigious cases.12 The map below (Figure 2) compares the average reported number of incoming litigious civil and commercial cases13 in the years 2016–20 per 100 inhabitants. It is evident that some EU countries have less than one litigation per 100 inhabitants, while other countries have more than five litigious cases per 100 inhabitants. Unless we have reason to believe that litigious cases in the latter group of countries is easier to handle on average, this will seem to imply that some countries need more than five times as many judges than others in order to serve a similarly sized population with handling litigations.
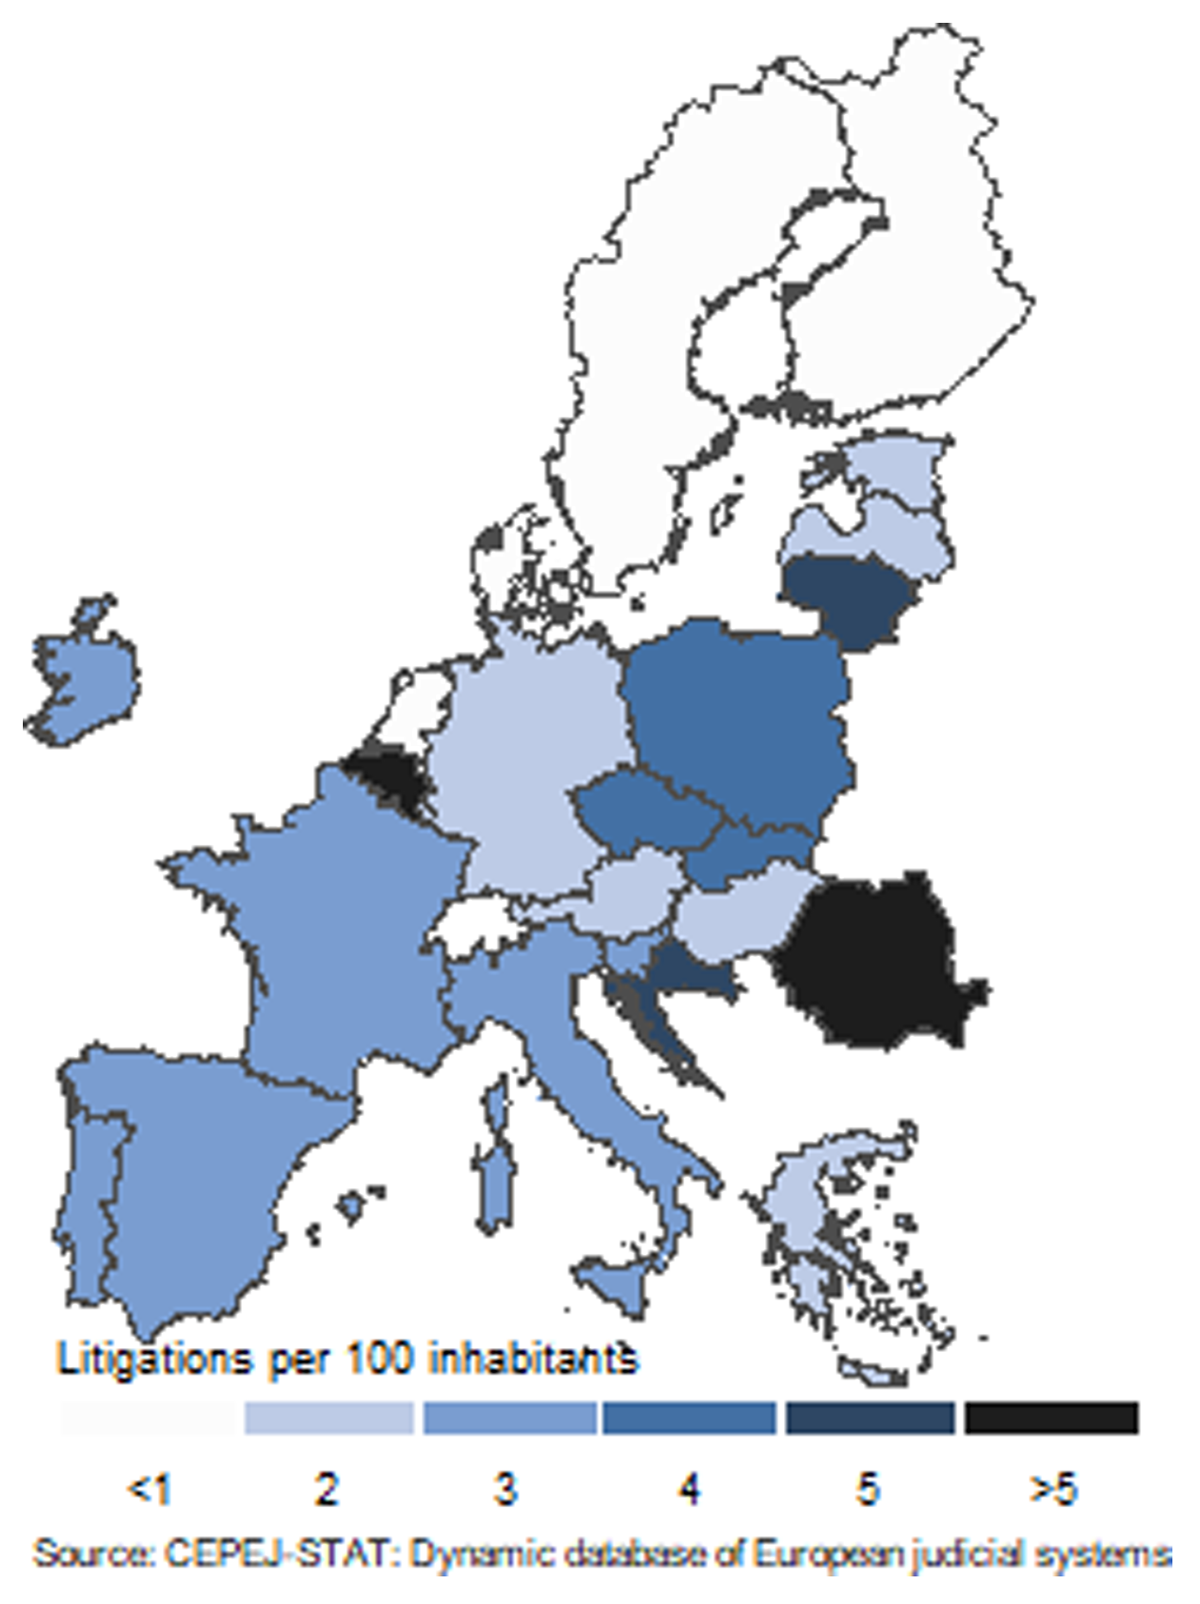
Figure 2
Civil and commercial litigations per 100 inhabitants.
There are similarly major differences in the number of criminal cases per 100 inhabitants. Figure 3 shows the average numbers for the years 2016 to 2020. Some EU countries have less than one criminal case per 100 inhabitants while others have more than five cases.
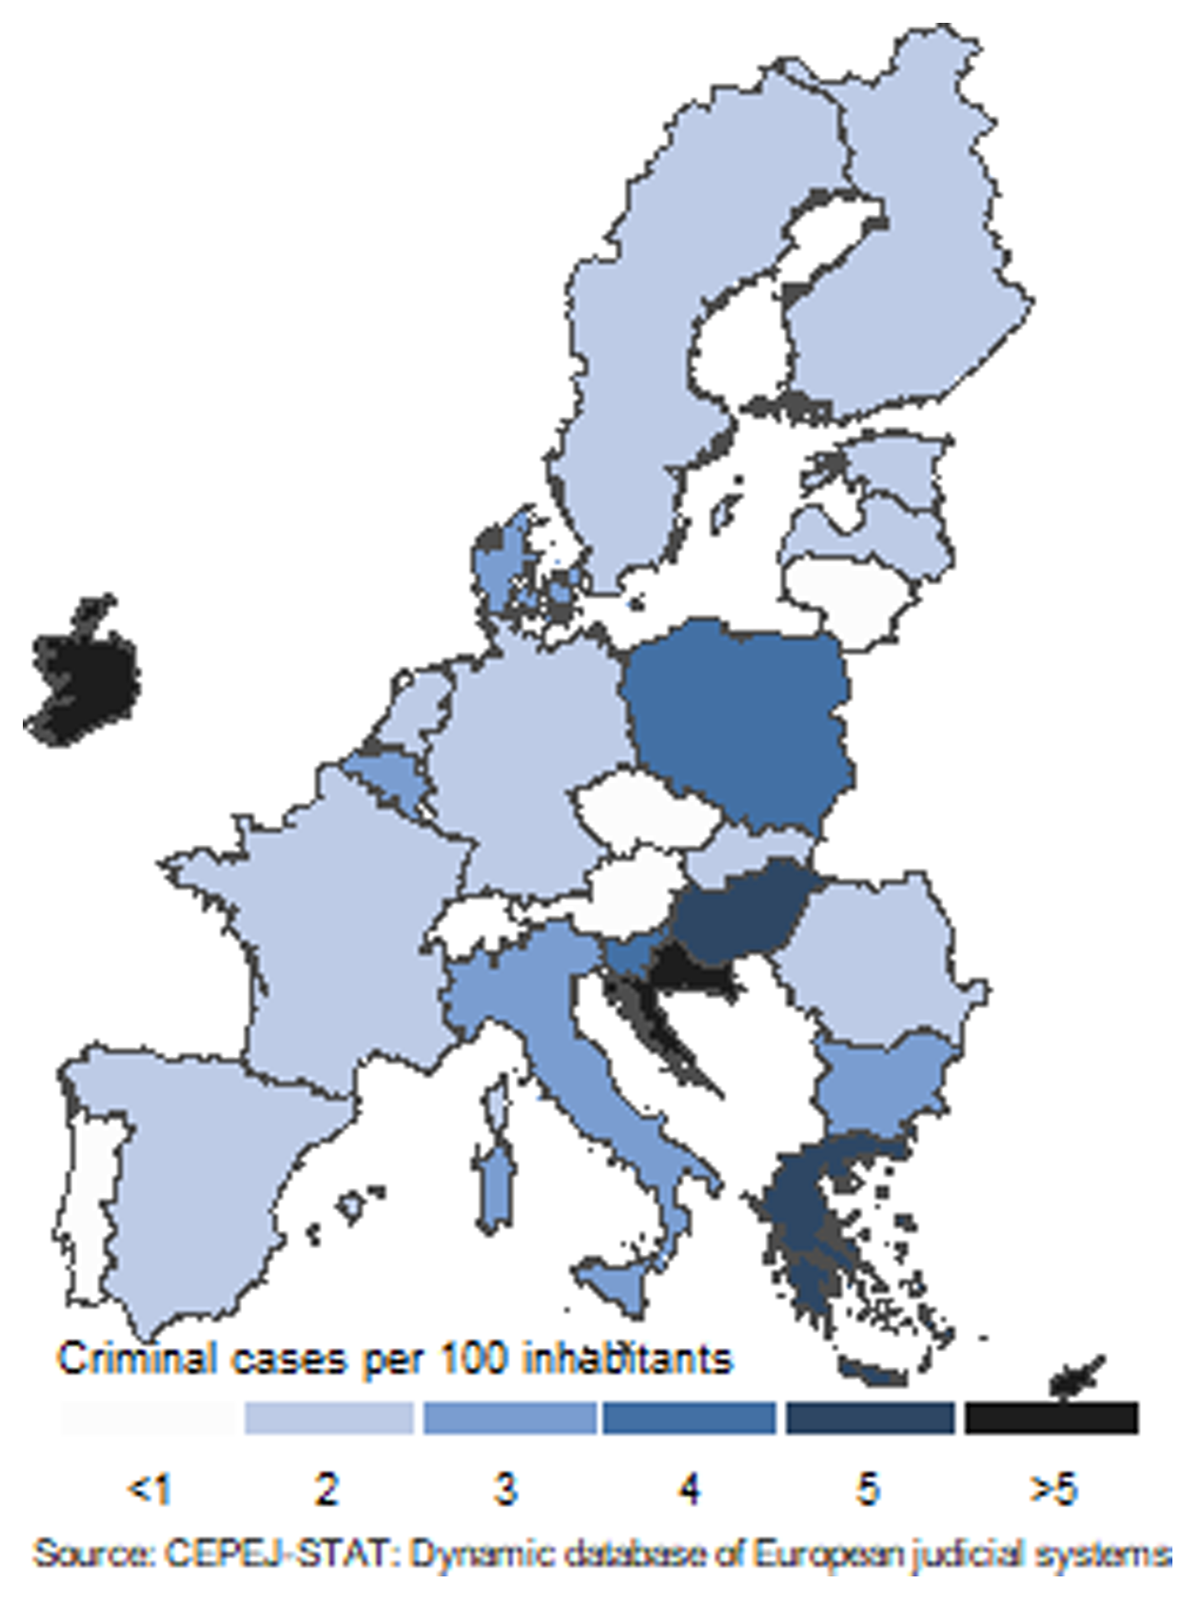
Figure 3
Criminal cases per 100 inhabitants.
For comparative analysis, an alternative is to consider specifically ‘severe’ criminal cases. CEPEJ defines severe criminal cases as those criminal cases punishable by deprivation of liberty (arrest and detention, imprisonment).14 It appears reasonable to assume that these cases require a higher level of work from judges than minor offences. Unfortunately, many countries fail to report a number of severe cases.
The differences in the case rate for those countries that do report the number of severe criminal cases are illustrated in Figure 4.
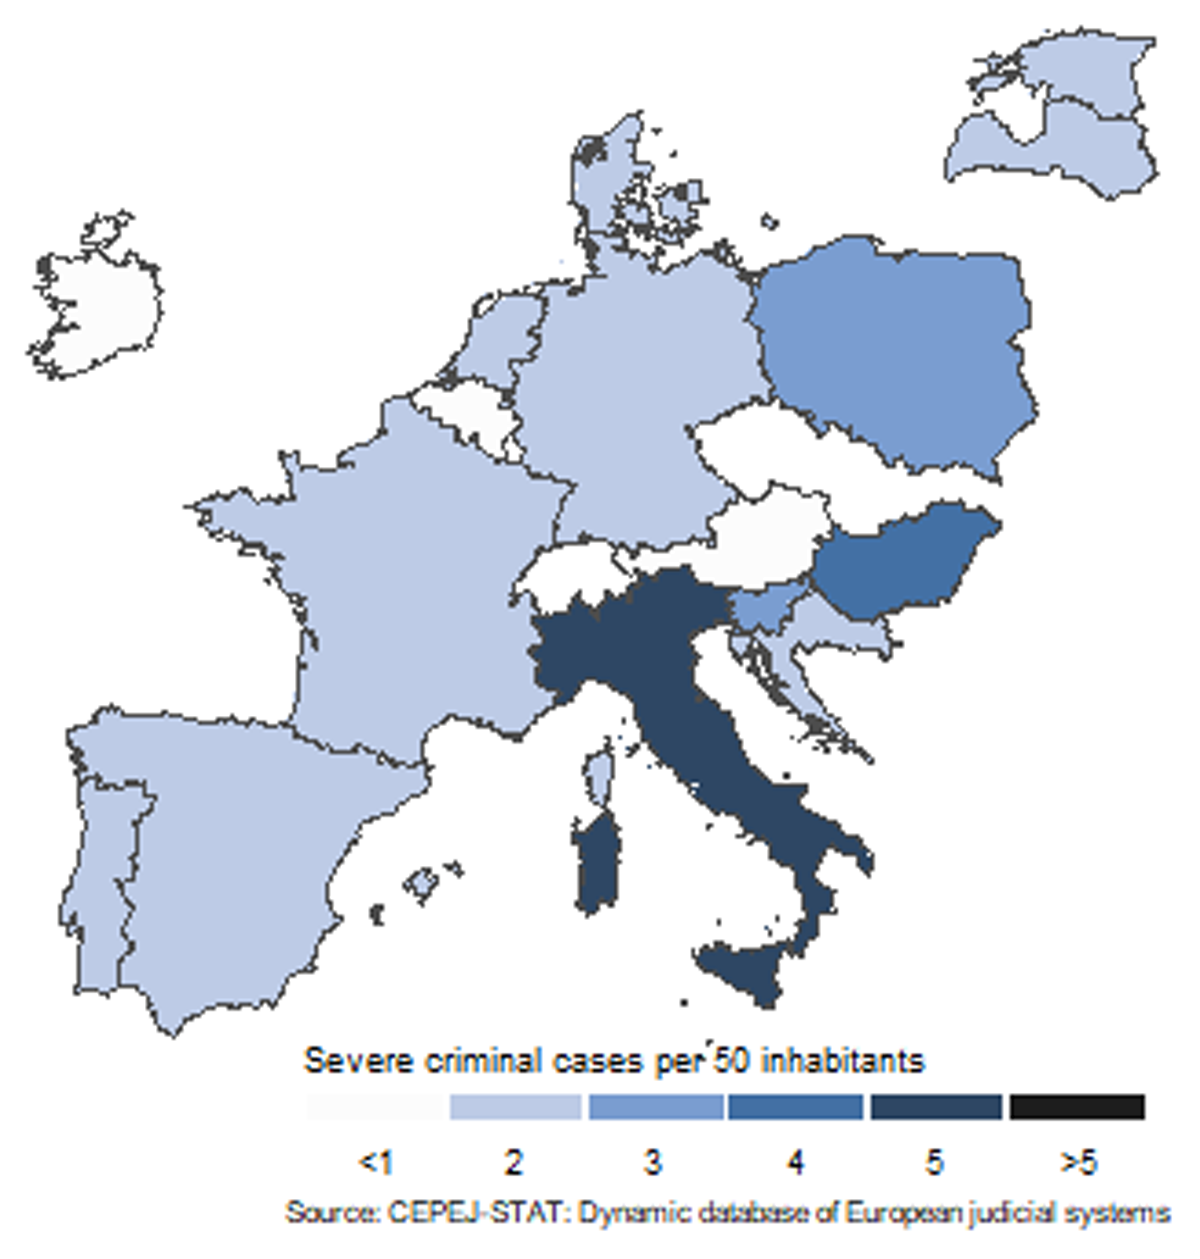
Figure 4
Severe criminal cases per 50 inhabitants.
When considering the need for judges in the EU countries it appears relevant to try to consider these marked differences in case rates.
For this calculation, an assumption must be made about the proportion of judges needed for criminal cases on the one hand, and for handling civil and commercial cases on the other. For simplicity, and in line with the total proportion of cases, it is here assumed to be 50 percent for criminal cases and 50 percent for civil and commercial cases. It is furthermore assumed, that the judicial workload for criminal cases is impacted equally by the case rate for severe criminal cases and the overall case rate for criminal cases.
In mathematical terms we are estimating a correction factor for country i, CFi, calculated from the case rate for civil and commercial litigations, Cri, the case rate for criminal cases, Pri, and the case rate for severe criminal cases,15 Sri, relative to the average EU case rates, CrEU, PrEU, and SrEU.
This correction factor is then considered16 when calculating the indicator for judicial supply.17
Notice that administrative cases are not considered. Administrative cases constitute a particular challenge since only a fraction of countries report the statistics. It is therefore necessary to assume that the differences in administrative case rates reflect those for civil, commercial, and criminal cases. That assumption is undoubtedly problematic since the organization of administrative justice varies within the EU. This serves to highlight that the calculated estimates can never stand-alone but should always be subjected to qualitative interpretation.
With that caveat in mind, Figure 5 shows the ratio of professional judges to the estimated population-generated demand for justice. For simplicity, the (population-weighted) EU average ratio has been set to 1, and the ratios for the individual countries are relative to the average ratio.
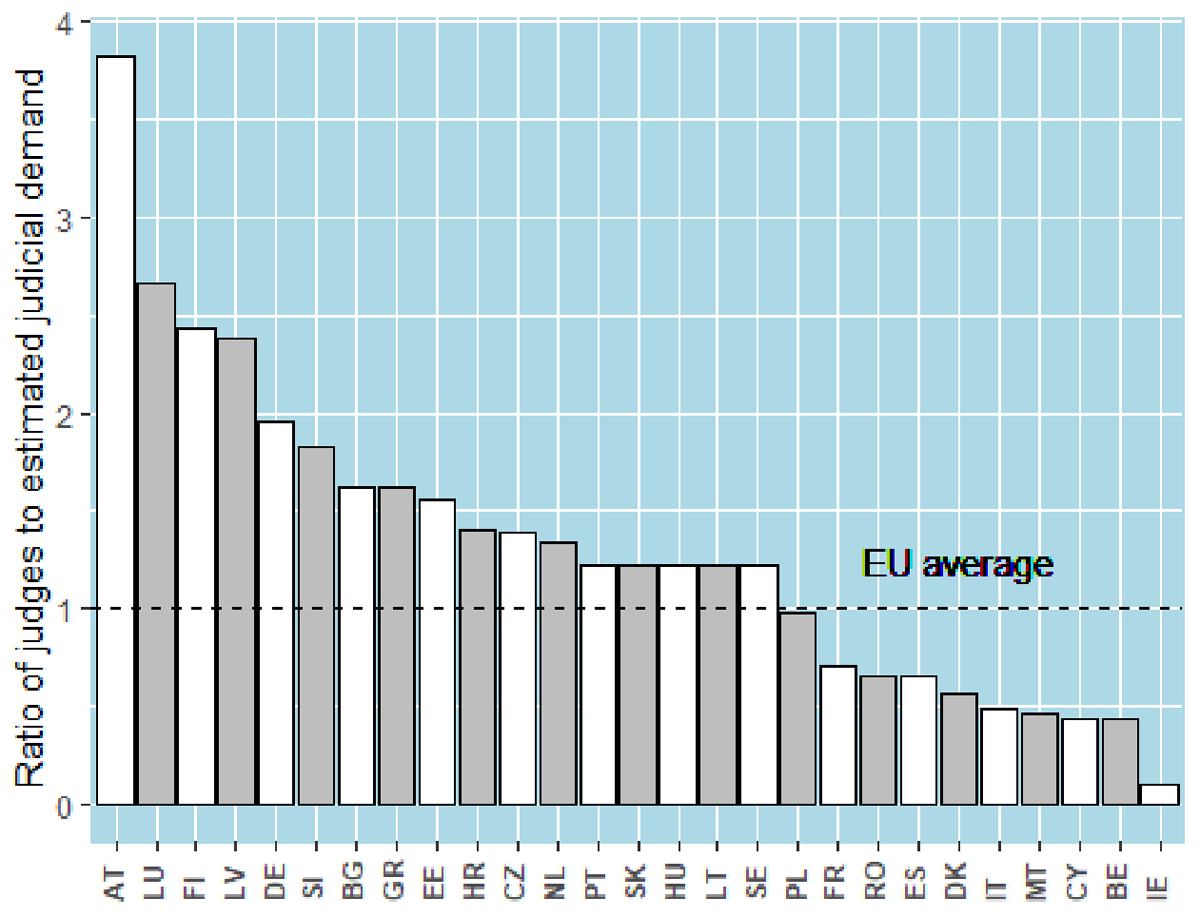
Figure 5
Ratio of professional judges to population-generated judicial demand (simple estimate).
It turns out that the ‘bottom-5’ which were reprimanded in the EU-scoreboard is no longer the same. It now includes Belgium, Cyprus, and Italy, whilst Spain, France and Denmark have moved up in the table.
There are of course several reasons to be cautious about relying upon the above estimate. One concern is the lack of consistent reporting of case rates, especially for severe criminal cases.
Another major concern would be that the composition of reported cases (cases which require much work vs. other cases) may differ a lot between countries. As argued by Ramseyer and Rasmusen,18 ‘a case is not a case’: analogous categories of disputes do not necessarily generate the same number of ‘countable’ cases in every country. We have learned from studies of court workload within the same country that it is important to have a fine-grained system for weighing diverse types of cases in order to compare the workload between courts.19 This should be an even greater concern when we are trying to compare different countries. A recent study has documented that, even for countries with a similar legal tradition, there may be substantial differences in the way cases are categorized and reported to CEPEJ.20 Comparing cases across countries appears to be just as problematic as comparing judges.
Instead of relying directly on the notoriously problematic case statistics, an alternative approach would be to try to identify the societal characteristics that may help explain or predict the differences in case rates and judicial demand, and then use these indicators to predict population-generated judicial demand. This is the approach taken in the remaining part of this paper.
Estimating the demand for justice
It does not require much imagination to produce the idea that the state of the economy may have an impact on the number of criminal cases. Poor economic conditions may lead to higher crime rates and thus more work for courts and judges.
This intuition does indeed appear to be true. Figure 6 shows the correlation21 between the criminal case rate (number of criminal cases per 100 inhabitants) and indicators for macroeconomic advantage, compiled by the World Economic Forum (Global Competitiveness reports 2007–20), and the level of male employment for around 45 ‘European’ countries.22 Good macro-economic conditions and high male employment is correlated with lower criminal case rates.
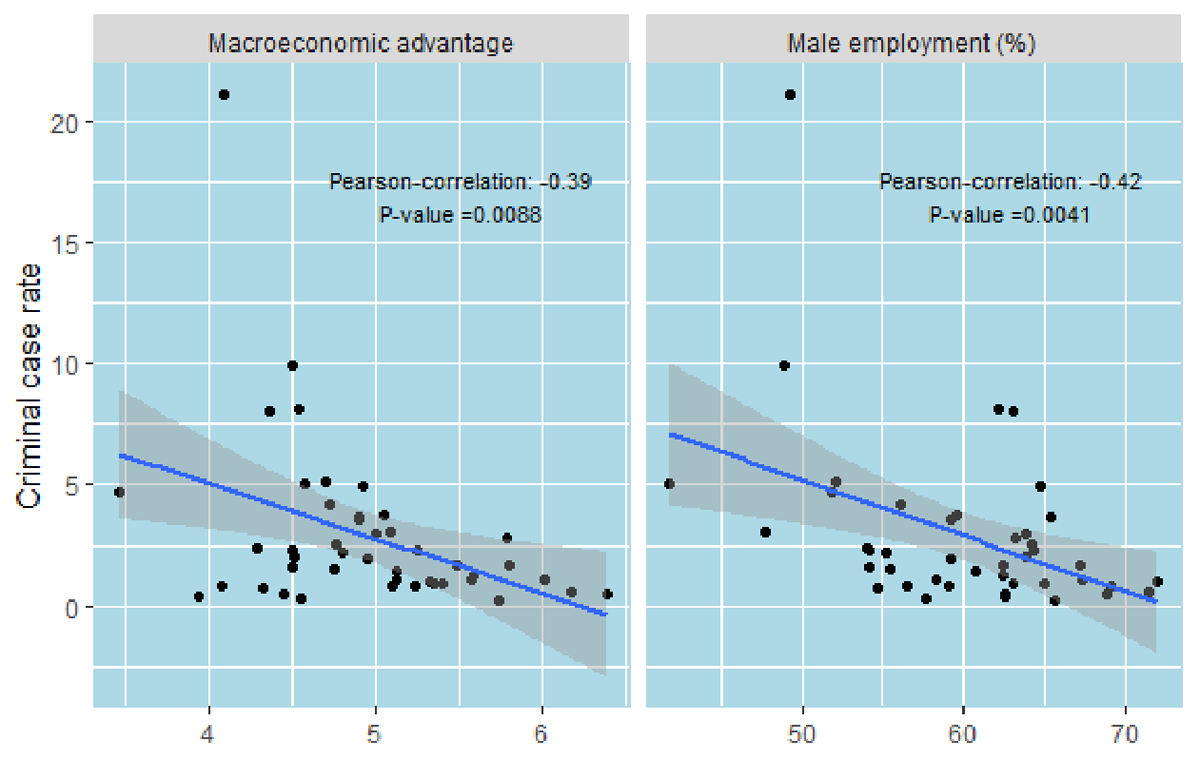
Figure 6
Correlation with the criminal case rate.
The World Economic Forum indicator for macroeconomic advantage is generated from five sub-components:
Government budget balance, % of GDP
Gross national savings, % of GDP
Inflation, annual % change
Government debt, % of GDP
Country credit rating
The indicator is measured on a scale from one to seven, with seven indicating the best possible macro environment. I have taken the average number for this indicator in the years from over 2007 to 2018 to reflect the long-term macro-economic conditions for any given country.
In addition, the criminal case rate is correlated with male unemployment: The proportion of males aged fifteen or above who are unemployed. This indicator is obtained from the World Bank Database and calculated as an average over the years from 2007 to 2018 to reflect the long-term employment situation.
It does appear to be a plausible hypothesis that a bad macroeconomic environment and high unemployment, especially male unemployment, will be associated with a higher crime rate, and therefore a higher criminal case workload. Other studies have additionally found this to be true.23
As theorized by Cantor and Land24 and documented in the empirical study of US counties by Phillips and Land,25 there are two pathways through which economic activity – as indexed by the aggregate unemployment rate or macroeconomic disadvantage – ‘could affect the rate of criminal activity. The first is by increasing levels of criminal motivation within the population as deteriorating economic conditions affect social strain and social control; the second is by influencing the availability and vulnerability of criminal targets and thus the number of criminal opportunities’.26
The analysis of the case rate for severe criminal cases is challenged by the sparse number of countries reporting this statistic.
Interestingly, however, this case rate correlates significantly with an indicator for male educational attainment (see Figure 7). This indicator is again obtained from the World Bank database (accessed March 2023) and taken as an average over the years from 2007 to 2018. It is measured as the proportion of males (age 25+) with a completed post-secondary education.
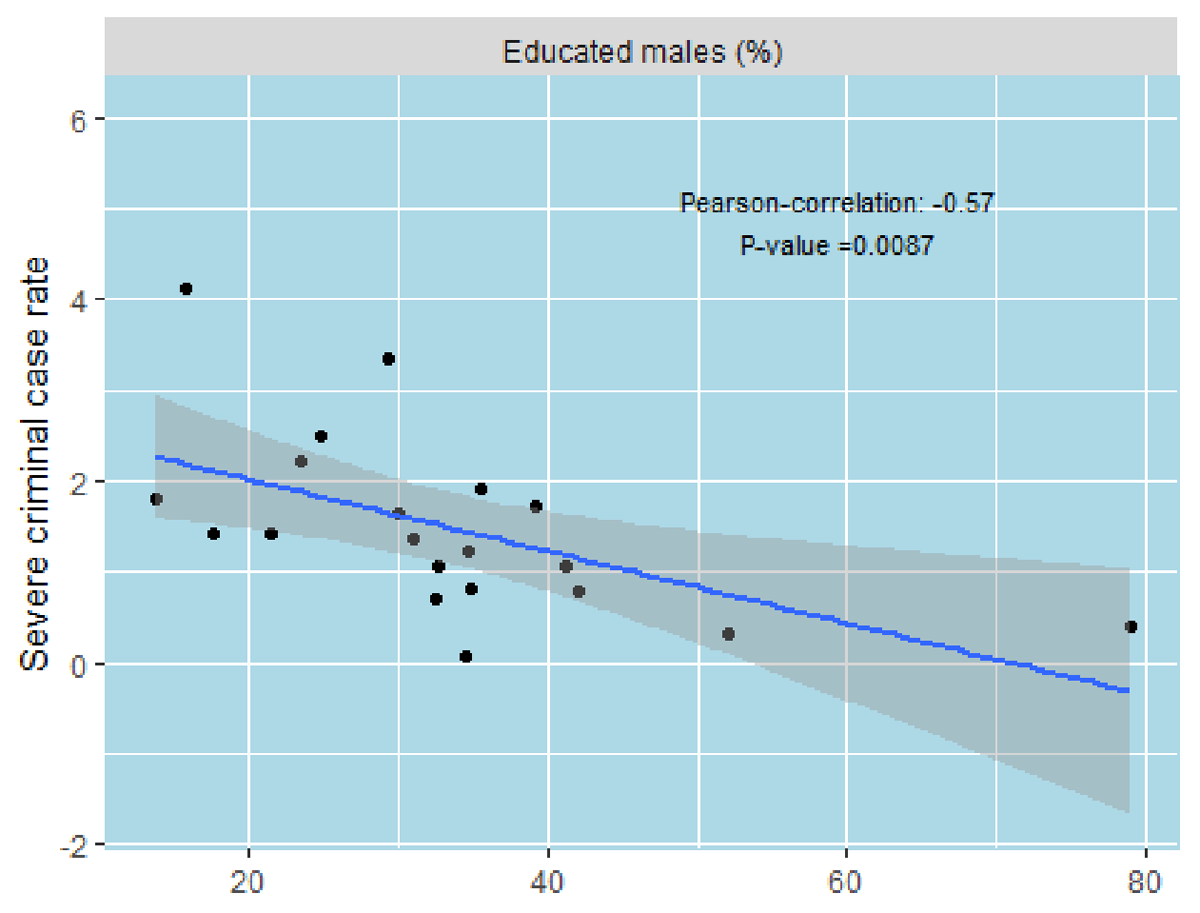
Figure 7
Correlation with the severe criminal case rate.
Again, it may be highly plausible that lower educational attainment for males is associated with a higher crime rate (and vice versa). The effect of education is e.g., documented in the study by Machin et al.27 documenting how significant decreases in property crime in England and Wales resulted from reductions in the proportion of people with no educational qualifications.
In a similar way I have identified variables having a high correlation with the number of civil and commercial litigations per 100 inhabitants (the litigation rate).
It turns out that the number of civil and commercial litigations per capita has a strong negative correlation with various indicators measuring the quality of policymaking, governance, labor market relations and the legal framework.
More specifically, these variables are formed directly from the questions from the World Economic Forum Executive Opinion Survey and are taken as an average of the values from 2007 to 2018:
Transparency of government policymaking:
• In your country, how easy is it for companies to obtain information about changes in government policies and regulations affecting their activities? [1 = extremely difficult; 7 = extremely easy]
Cooperation in labor-employer relations
• In your country, how do you characterize labor-employer relations? [1 = generally confrontational; 7 = generally cooperative]
Efficiency of legal framework in settling disputes
• In your country, how efficient are the legal and judicial systems for companies in settling disputes? [1 = extremely inefficient; 7 = extremely efficient]
Furthermore, an indicator reflecting several sub-indicators relating to government efficiency also correlates with litigations. This indicator includes the following sub-indicators:
Wastefulness of government spending
Burden of government regulation
Efficiency of legal framework in challenging regulations
The correlations are shown in Figure 8.
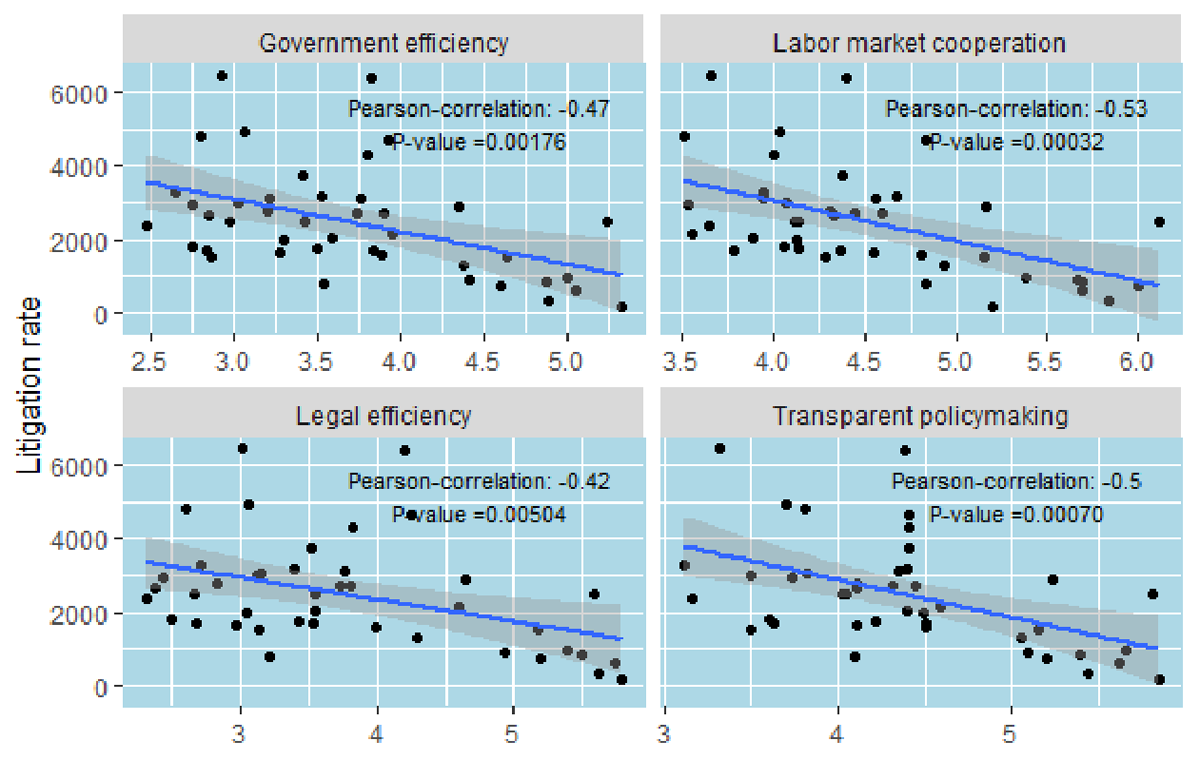
Figure 8
Correlation with the litigation rate.
Correlation is not causation, so one should be cautious when interpreting these results. However, as noted by Palumbo et al.,28 it is plausible that good-quality regulation and a timely and effective implementation of policies reduce the likelihood of conflicts both between private parties and between the State and the private sector. By reducing the transparency and certainty of the business environment, the presence of corruption can have an opposite influence on the frequency of disputes.
Furthermore, it also makes a lot of sense that a variable measuring the amount of cooperation in labor-employer relations has a strong negative correlation with the litigation rate, since that lack of cooperation between workers and employers is most likely to lead to more litigation.
Whether we can interpret these indicators as causes for differences in litigation rates, or if the correlation is instead in some way spurious (e.g. all variables have an unknown common cause), is not really important for the purpose of this paper, which is to use the indicators to predict judicial workload (litigation rates).
More advanced alternative estimate: Prediction of judicial need from drivers of judicial demand
The variables identified in the preceding section may be perceived as drivers of judicial demand. Poor macro-economic conditions, high long-term unemployment and a poor educational level seem to contribute to a higher number of criminal cases (per inhabitants). Likewise, poor governance structures, lack of transparency and inefficient labor market cooperation seem to coexist with a higher civil and commercial litigation rate.
It is then possible to utilize these high correlations with case rates to predict demand for judicial services from the socio-economic indicators.29
The case rates are estimated from linear regression on the socio-economic indicators, x1, …xn:30
And the correction factor is calculated from these estimates31:
One major advantage with this approach is that the estimate for a given country becomes independent from the case statistics it has reported. Therefore, if a particular country is registering, counting, or reporting cases in a peculiar way (different from other countries), this will not impact the estimate for the country’s judicial demand, since this is totally driven by the socioeconomic indicators.
Figure 9 shows the ratio of judges to predicted demand (with the population-weighted EU average set to 1). The figure shows two alternative ratios: one with just professional judges, and a second which includes also rechtspflegers.32
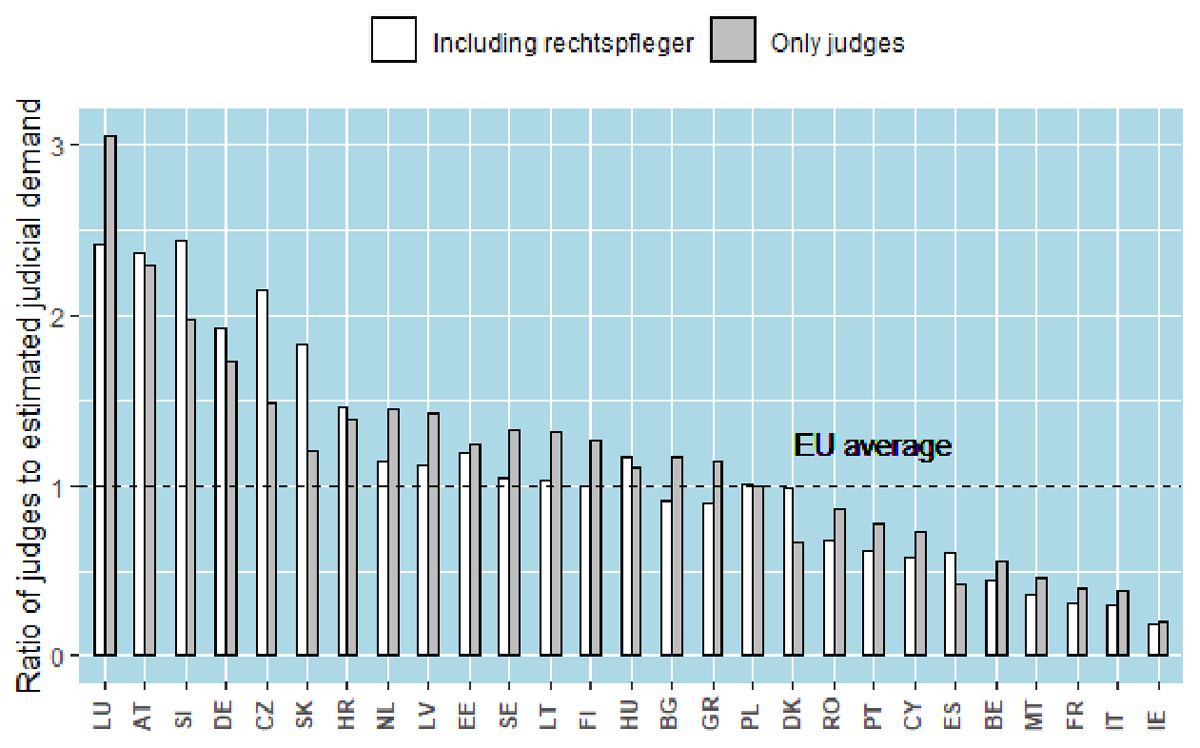
Figure 9
Ratio of judges to population-generated demand (advanced estimate).
It is evident that this alternative estimate – like the previous simpler estimate – has a significant impact on the ranking. The bottom-five now includes Italy and Belgium.
Even with this ‘improved’ estimate, however, it is not possible – at least not without supplementary analysis – to conclude that the countries to the right in the table above are most in need of additional judges. Most of the challenges listed above regarding comparison of judicial needs, related to fundamental differences in the setup of European judicial systems, remain. For example, non-professional magistrates handle a large part of cases in Ireland, and non-professional judges can in Belgium act alone even in severe criminal cases.33
Conclusion
The standard approach to comparative assessment of judicial need is to look primarily at the number of judges per capita. This focus is too narrow since it does not consider differences in judicial demand. The vast differences in various case rates (number of cases in relation to number of inhabitants) across Europe suggest that the differences in judicial demand may also be substantial.
This paper provides strong indications that the differences in case rates (for civil and commercial litigations and for criminal cases) are partly related to differences in socio-economic factors. Bad long-term macro-economic conditions, high male unemployment and low educational levels (especially for males) is correlated with higher criminal case rates, while indicators measuring quality of regulatory, legal, and policy-making frameworks, as well as cooperation between employers and workers, are correlated with the litigation rate.
These socio-economic factors will thus have a major impact on the need for judges. Taking them into account will lead to a different conclusion about which countries may be facing a shortage of judges, than what we will ascertain from merely observing the number of judges in relation to population size.
Even with this ‘improved’ comparative measure of judicial needs, since the European judicial systems come in so many variations, any serious assessment of judicial needs will have to go much deeper into the analysis of the specific characteristics of the judicial system in question.
Notes
[1] H. Gramckow, Estimating Staffing Needs in the Justice Sector, Justice and Development Working Paper Series 19, World Bank, 2012.
[2] P. Bogetoft, J. Wittrup, ‘Benefit-of-the-doubt approach to workload indicators: Simplifying the use of case weights in court evaluations’, Omega, (2021)103.
[3] European Commission, 2022 Rule of Law Report, 2022.
[4] The five countries are indeed the five EU countries with the lowest number of professional judges per capita according to CEPEJ. In the country chapters in the EU Rule of Law report concern is raised about the low number of judges per inhabitants for these five countries. About Denmark it is stated that “the limited expenditure on the justice system as a percentage of the GDP and low number of judges remains a long-term challenge.” About Malta it is stated that “The level of resources for the judiciary, in particular the low number of judges per inhabitant, remains a concern.” The reports on Ireland, France and Spain also explicitly bring up the issue with the low ratio of judges to inhabitants.
[5] M. Fabri, ‘Methodological issues in the comparative analysis of the number of judges, administrative personnel, and court performance collected by the Commission for the Efficiency of Justice of the Council of Europe’, Onati Socio-legal Series, (2017) 7(4), pp. 616–639, available at: <https://opo.iisj.net/index.php/osls/article/view/876> [accessed 15 May 2024].
[6] M. Ramseyer, E. Rasmusen, Comparative litigation rates, John M. Olin Discussion Paper Series, (2010) 681, 2010.
[7] S. Bielen, L. Peeters, W. Marneffe, L. Vereeck. ‘Backlogs and litigation rates: testing congestion equilibrium across European judiciaries’, International Review of Law and Economics, (2018) 53, pp. 9–22.
[8] The project was conducted in the period from 2017 to 2020, through a program implemented by the East-West Management Institute, Inc. (EWMI) and funded by the United States Agency for International Development (USAID). The author wishes to express his gratitude to EWMI and USAID, and to judicial counterparts in Georgia, for their collaboration and support, but notes also that the views expressed herein do not reflect the views of EWMI, USAID, or the governments of the United States or Georgia.
[9] P. Bogetoft, J. Wittrup, ‘Productivity and education: Benchmarking of elementary and lower-secondary Schools in Denmark’, Nordic Economic Policy Review, (2011) 2, pp. 257–294.
[10] F. Schneider, New COVID-related results for estimating the shadow economy in the global economy in 2021 and 2022, International Economics and Economic Policy, (2022)19, pp. 299–313, available at: <https://link.springer.com/article/10.1007/s10368-022-00537-6> [accessed 15 May 2024].
[11] CEPEJ, European judicial systems: Efficiency and quality of justice, CEPEJ Studies, no. 23, 2016, p. 187.
[12] The ‘category of non-litigious cases repeatedly shows considerable variations among states and entities that make comparison inadequate. For example, some jurisdictions include land registry, business registry and enforcement cases among non-litigious cases, and in some, these are entrusted to specialised non-judicial bodies. Additionally, due to their inherent complexity, litigious matters tend to reflect the work of judges more accurately’. CEPEJ, European judicial systems: CEPEJ Evaluation Report, 2022 Evaluation cycle (2020 data).
[13] Sum of cases from first instance, second instance and the Supreme Court. If only first instance cases are compared the overall picture is very much the same.
[14] CEPEJ, European judicial systems: CEPEJ Evaluation Report, 2022 Evaluation cycle (2020 data), p.145. Common examples of severe criminal cases include murder, rape, organized crime, fraud, drug trafficking.
[15] For countries where this variable is missing, I have assumed the value to be equal to the EU average.
[16] Suppose for example that the number of judges per capita in a given country is only half the EU average. If, however, the case rates are also only 50 percent of the EU average, the correction factor will be 0.5, and the indicator for judicial supply will be 1, indicating an adequate number of judges.
[17] Where Jpci is the number of judges per capita in country I, and JpcEU is the average number of judges per capita in the EU.
[20] E. A. Ontanu, M. Velicogna, ‘The challenge of comparing EU member states judicial data’, Onati Socio-Legal Series, (2021) 11(2), pp. 446–480, available at: https://opo.iisj.net/index.php/osls/article/view/1180 [accessed 15 May 2024].
[22] The figure – and all the analyses in this section – includes data from most countries reporting to CEPEJ, not just the EU countries. Data from non-EU countries with a population below one mil. has been omitted.
[23] D. Altindag, ‘Crime and unemployment: Evidence from Europe’, International Review of Law and Economics, (2012) 32(1), pp. 145–157.
[24] D. Cantor, K. Land, Unemployment and crime rates in the post world war II United States: a theoretical and empirical analysis, American Sociological Review, (1985) 50(3), pp. 317–332, available at: <https://www.jstor.org/stable/pdf/2095542.pdf> [accessed 15 May 2024].
[25] J. Phillips, K. Land, ‘The link between unemployment and crime rate fluctuations: An analysis at the county, state, and national levels’, Social Science Research, (2012) 41(3), 2012, pp. 681–694.
[27] S. Machin, M. Olivier, S. Vujić, ‘The crime reducing effect of education’, The Economic Journal, (2011) 121(552) Conference Papers (May 2011), pp. 463–484.
[28] G Palumbo et al., ‘The Economics of Civil Justice: New Cross-country Data and Empirics’, OECD Economics Department Working Papers, (2013) 1060, OECD Publishing Paris.
[29] More specifically this has been done in three steps. First, any missing variables have been estimated by the application of a Random Forest-algorithm and from a very large set of other indicators. Second, judicial demand has been estimated by simple linear regressions, with the case rates as dependent variables and the identified socio-economic indicators as explanatory variables. Third the total estimated demand is constructed from the predicted values by assigning weights for demand for civil and commercial litigations (50%) severe crimes (25%) and all crimes (25%).
[30] The estimations are carried out separately for each major case type: Civil and commercial litigations (), criminal cases (), and severe criminal cases ().
[31] For each case type, the estimated case rate is compared to the average estimate for EU. is the estimated case rate for civil and commercial litigations in country i; is the estimated case rate for criminal cases in country i; is the estimated case rate for severe criminal cases in country i. , PrEU, and SrEU are the similar estimated average case rates for EU.
Competing Interests
The author has no competing interests to declare.