
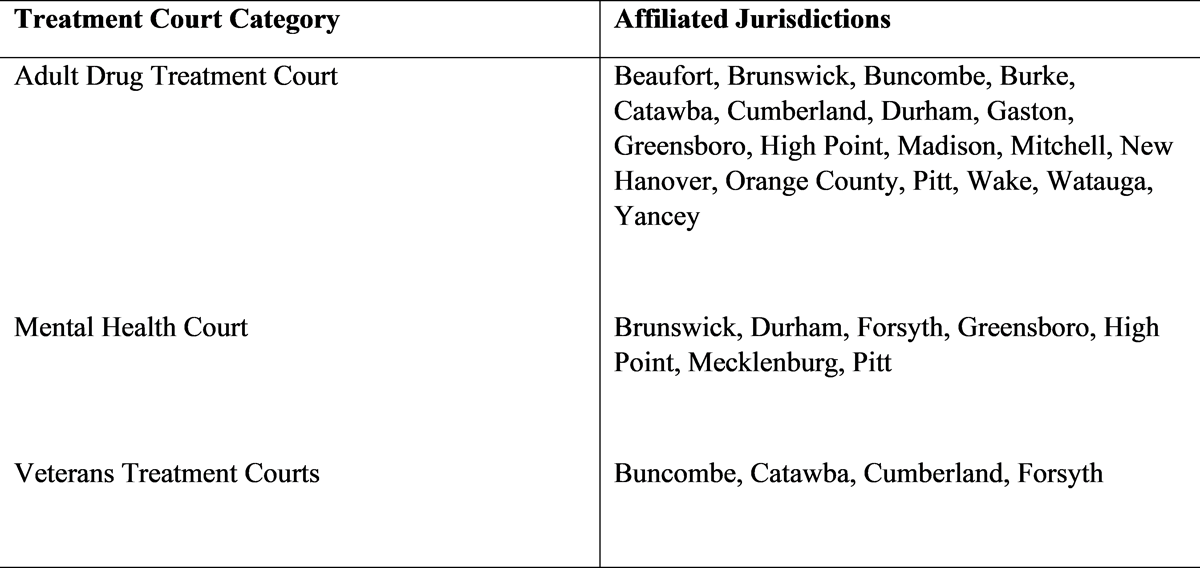
Figure 1
Categorization of Courts and Affiliated Jurisdictions.
Table 1
Respondent Demographics for Treatment Court Coordinators (n = 13).
| MEASURE | N | % | MEASURE | N | % |
|---|---|---|---|---|---|
| Gender | Total Years Experience in Field | ||||
| Male | 3 | 23.08 | 01–May | 4 | 30.77 |
| Female | 10 | 76.92 | 06–Oct | 2 | 15.38 |
| Nov–15 | 3 | 23.08 | |||
| Age Bracket | 16–20 | 1 | 7.69 | ||
| 25–34 | 2 | 15.38 | 20+ | 3 | 23.08 |
| 35–44 | 2 | 15.38 | |||
| 45–54 | 4 | 30.77 | Years in Current Position | ||
| 55–64 | 4 | 30.77 | 01–May | 8 | 61.54 |
| 65+ | 1 | 7.69 | 06–Oct | 1 | 7.69 |
| Nov–15 | 2 | 15.38 | |||
| Highest Level of Education | 16–20 | 2 | 15.38 | ||
| Diploma/GED | 1 | 7.69 | |||
| Bachelor’s | 3 | 23.08 | |||
| Master’s | 6 | 46.15 | Treatment Court Affiliation | ||
| PhD/JD/EdD | 2 | 15.38 | Drug | 9 | 75 |
| Other | 1 | 7.69 | Veterans | 1 | 8.33 |
| Race/Ethnicity | Mental Health | 3 | 16.67 | ||
| White | 8 | 61.54 | |||
| Black | 4 | 30.77 | |||
| American Indian/Alaska Native | 1 | 7.69 |
Table 2
Workplace Safety Scale (1 = Strongly Disagree to 5 = Strongly Agree).
| MIN | MAX | MEAN | SD | VARIANCE | COUNT | |
|---|---|---|---|---|---|---|
| I work in a dangerous job. | 1 | 4 | 2.55 | 0.99 | 0.98 | 13 |
| My job is a lot more dangerous than other types of jobs. | 1 | 4 | 2.64 | 1.15 | 1.32 | 13 |
| In my job, a person stands a good chance of getting hurt. | 1 | 4 | 2.25 | 1.16 | 1.35 | 13 |
| There is really not much of a chance of getting hurt in my job. | 1 | 5 | 3.25 | 1.16 | 1.35 | 13 |
| A lot of people I work with get physically hurt in the line of duty. | 1 | 3 | 1.75 | 0.83 | 0.69 | 13 |
Table 3
Perceptions of COVID-19 Impact.
| N | % | |
|---|---|---|
| In your opinion, to what extent did COVID-19 impact the treatment court you supervise participants within? | ||
| A great deal | 6 | 46.15 |
| A lot | 6 | 46.15 |
| A moderate amount | 1 | 7.69 |
| In your opinion, did COVID-19 result in your treatment court becoming less effective in accomplishing its goals? | ||
| Yes | 7 | 53.84 |
| Maybe | 4 | 30.76 |
| No | 2 | 15.38 |
| Did your treatment court adopt new operations and approaches in response to COVID-19? | ||
| Definitely not | 1 | 7.69 |
| Definitely yes | 12 | 92.3 |
Table 4
Workplace Experiences Related to COVID-19 Scale by Time Frame (1 = Strongly Disagree to 5 = Strongly Agree).
| JULY 2020–DECEMBER 2020 | JANUARY 2021–JUNE 2021 | |||||||||
|---|---|---|---|---|---|---|---|---|---|---|
| MIN | MAX | MEAN | SD | VAR | MIN | MAX | MEAN | SD | VAR | |
| My workplace encouraged me to stay home if I was exhibiting any COVID-19 related symptoms. | 1 | 5 | 4.6 | 1.2 | 1.44 | 1 | 5 | 4.6 | 1.2 | 1.44 |
| I feel my workplace supported me taking precautions for my health related to COVID-19 in regard to missing work. | 1 | 5 | 4.4 | 1.2 | 1.44 | 1 | 5 | 3.9 | 1.58 | 2.49 |
| I do not feel as if my workplace punished me for missing work related to COVID-19 illness experienced by me or members in my home. | 1 | 5 | 4.3 | 1.27 | 1.61 | 1 | 5 | 3.9 | 1.58 | 2.49 |
| My workplace provided me with flexibility in order to perform my job duties safely. | 1 | 5 | 4.3 | 1.27 | 1.61 | 1 | 5 | 4.3 | 1.27 | 1.61 |
| My workplace provided me with reasonable virtual options to perform my duties. | 1 | 5 | 4.5 | 1.2 | 1.45 | 1 | 5 | 4.44 | 1.26 | 1.58 |
| My workplace provided me with satisfactory PPE in order to safely perform my job. | 4 | 5 | 4.7 | 0.46 | 0.21 | 3 | 5 | 4.6 | 0.66 | 0.44 |
| My workplace allowed for social distancing during workplace duties. | 3 | 5 | 4.7 | 0.64 | 0.41 | 3 | 5 | 4.7 | 0.64 | 0.41 |
| My workplace provided me clear guidance on how to address COVID-19 concerns in the workplace. | 1 | 5 | 4.4 | 1.2 | 1.44 | 3 | 5 | 4.5 | 0.81 | 0.65 |
| My workplace provided me with opportunities to get vaccinated. | 4 | 5 | 4.9 | 0.3 | 0.09 | 4 | 5 | 4.9 | 0.3 | 0.09 |
| My workplace encouraged vaccinations. | 3 | 5 | 4.7 | 0.64 | 0.41 | 3 | 5 | 4.7 | 0.64 | 0.41 |