
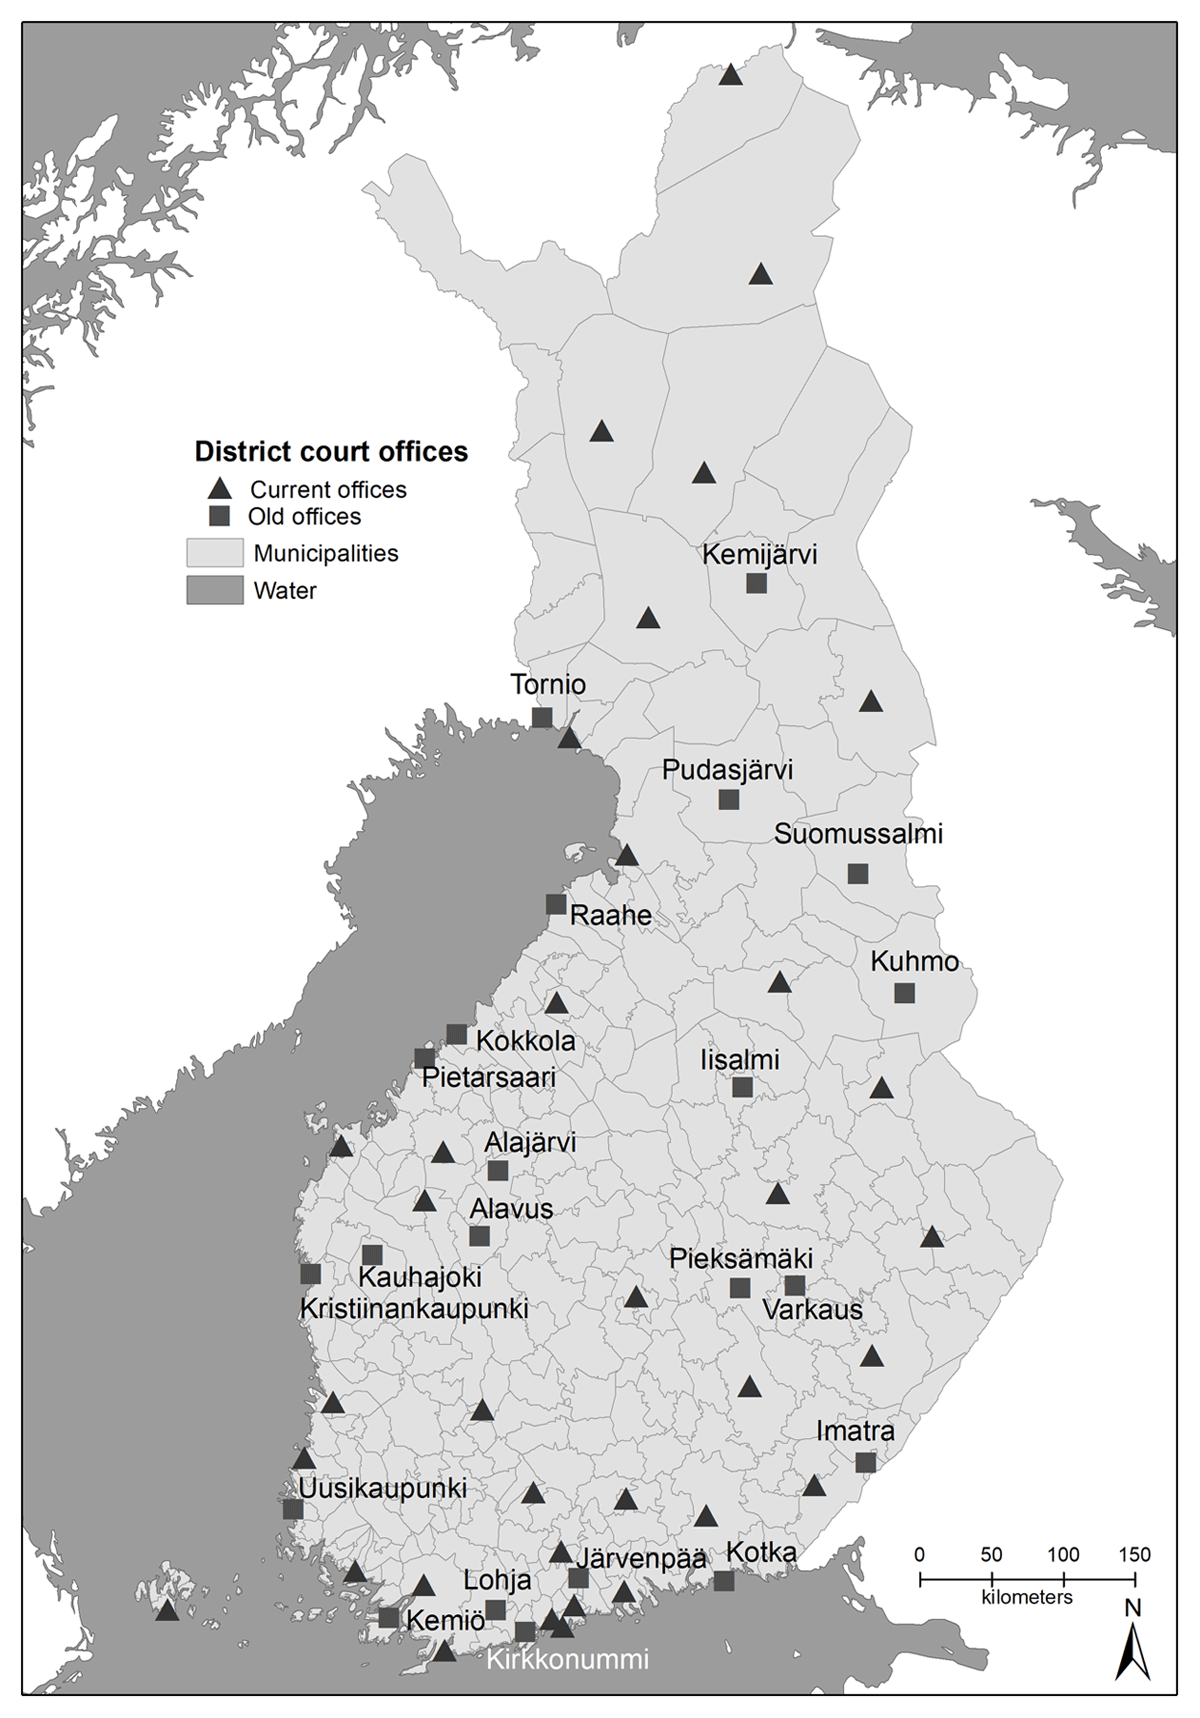
Figure 1
Old and current renewed district court networks in Finland.
Table 1
Accessibility of the closest district court by distance range in the old (before reform) and renewed (after reform) district court networks and their optimized district court networks (Optimal (57) and Optimal (36)) with p-median and ‘maximize attendance’ techniques.
| ACCESSIBILITY | % OF POPULATION | |||||
|---|---|---|---|---|---|---|
| OBSERVED NETWORKS | OPTIMIZED NETWORKS WITH P-MEDIAN | OPTIMIZED NETWORKS WITH ‘MAXIMIZE ATTENDANCE’ | ||||
| OLD, BEFORE REFORM IN 2019 (57 LOCATIONS) | RENEWED, AFTER REFORM IN 2019 (36 LOCATIONS) | OPTIMAL (57 LOCATIONS) | OPTIMAL (36 LOCATIONS) | OPTIMAL (57 LOCATIONS) | OPTIMAL (36 LOCATIONS) | |
| ≤50 km | 92,3 | 84,2 | 94,5 | 89,4 | 79,2 | 69,1 |
| 51–100 km | 7,5 | 15,0 | 5,3 | 9,3 | 17,7 | 26,1 |
| 101–150 km | 0,2 | 0,8 | 0,2 | 1,1 | 2,7 | 3,9 |
| 151–200 km | 0 | 0 | 0 | 0,1 | 0,3 | 0,8 |
| >200 km | 0 | 0 | 0 | 0,1 | 0,1 | 0,1 |
| Average (km) | 17,1 | 23,3 | 19,9 | 24,4 | 33,4 | 39,8 |
| Median (km) | 9,6 | 12,5 | 15,6 | 17,9 | 24,2 | 29,2 |
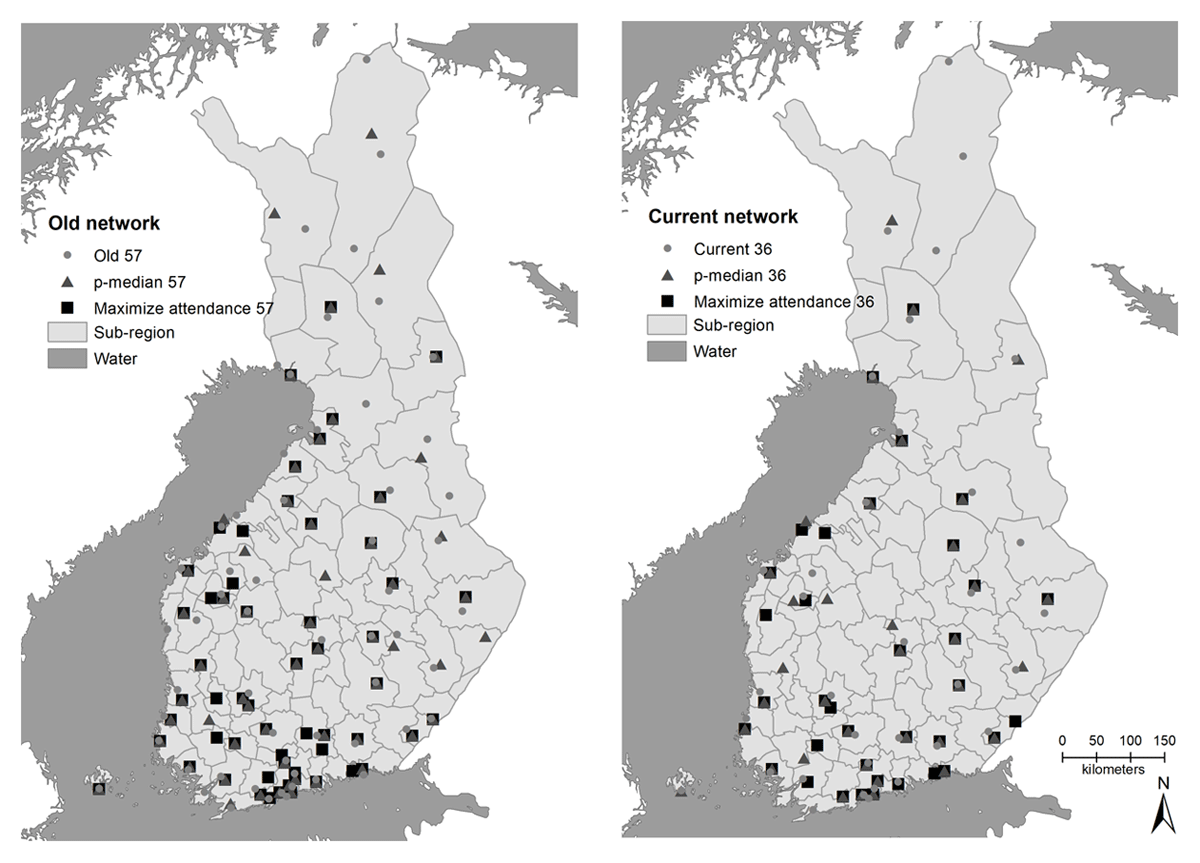
Figure 2
Old and current renewed district court networks and their optimized locations with p-median and ‘maximize attendance’ techniques. The regions in the figure represent sub-regions.
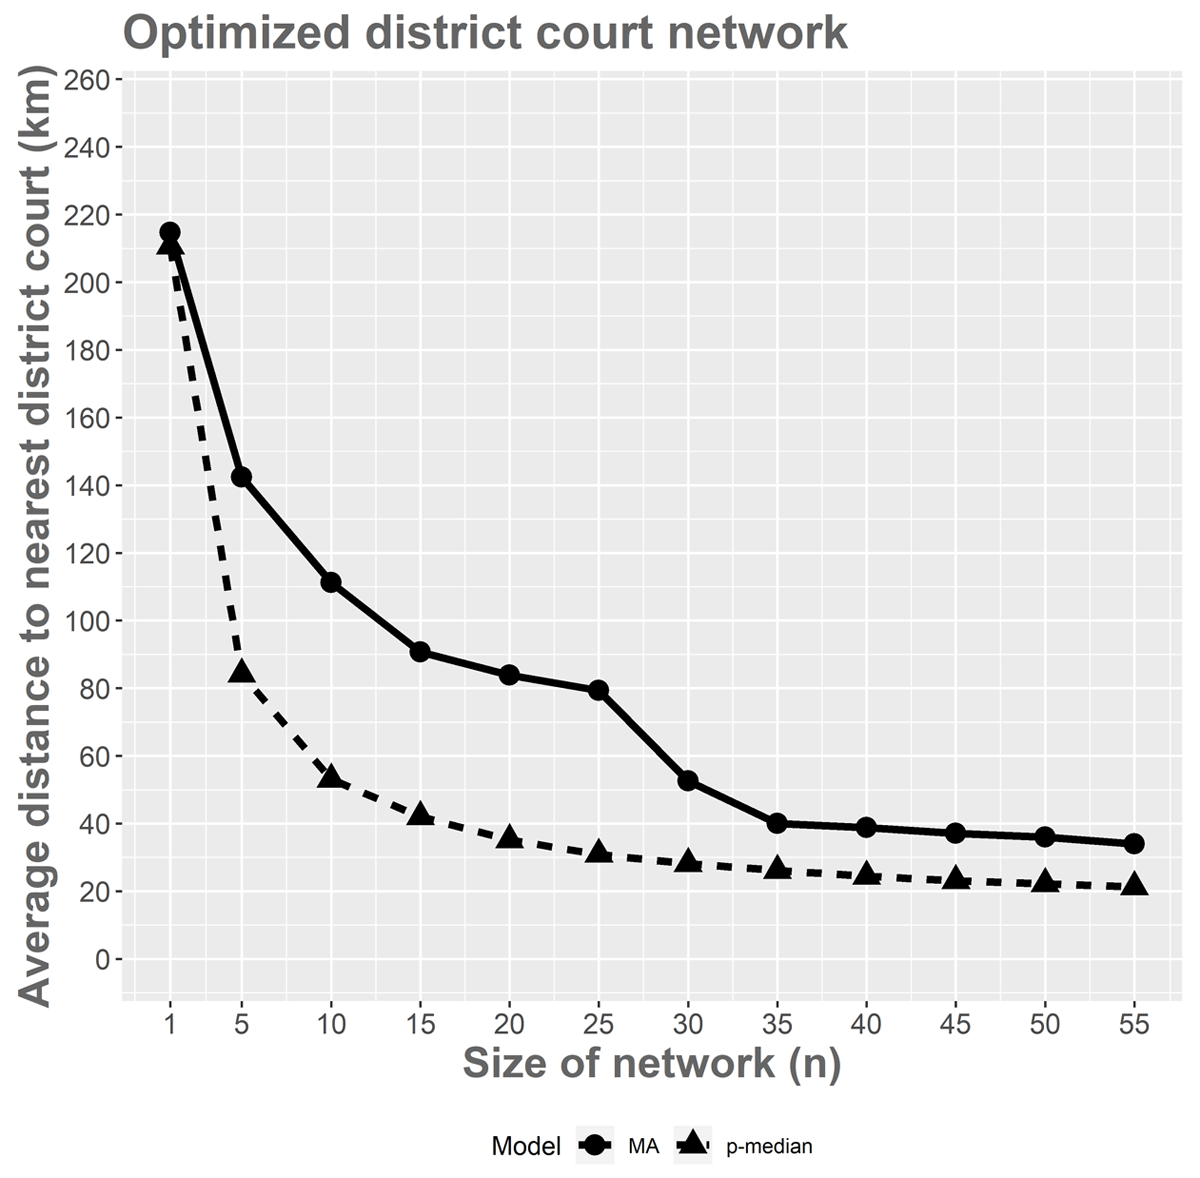
Figure 3
The average distance to the nearest district court and the size of the district court network with p-median and ‘maximize attendance’ techniques.
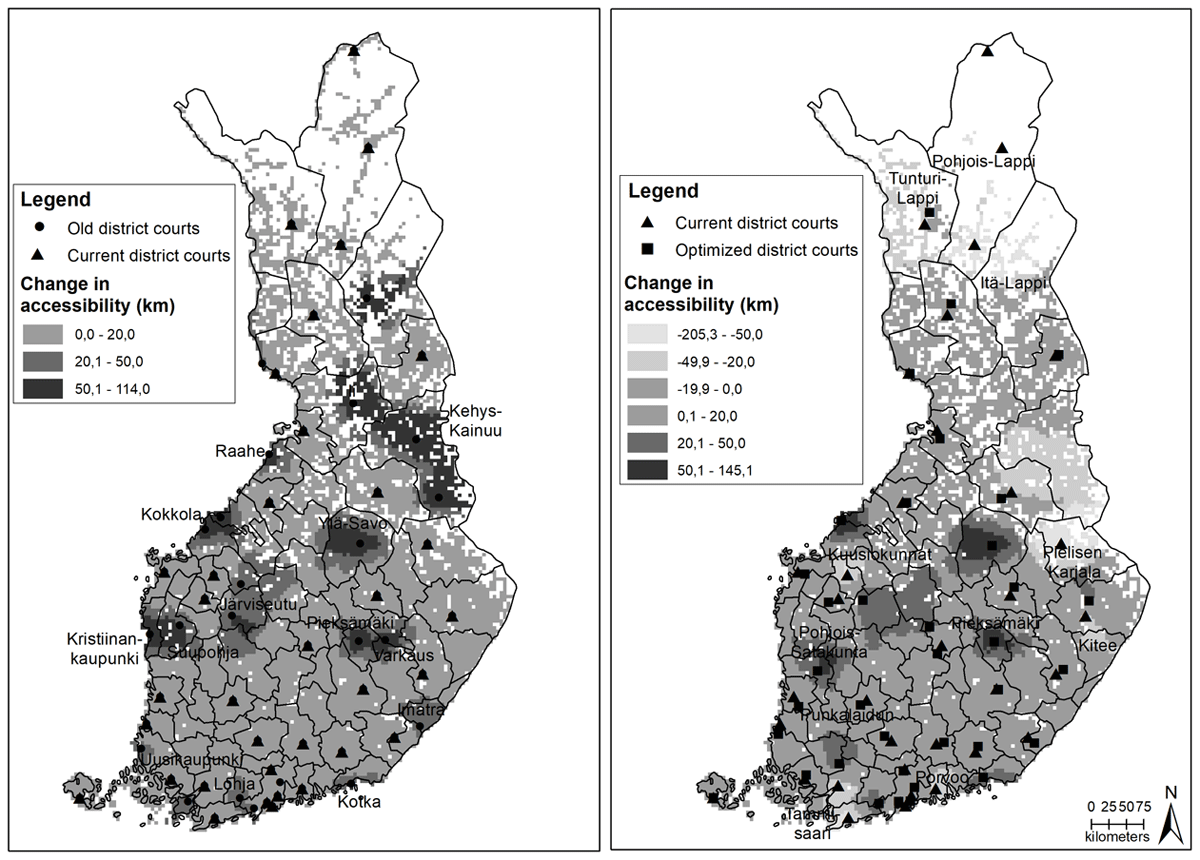
Figure 4
Differences in the accessibility of the nearest district court.