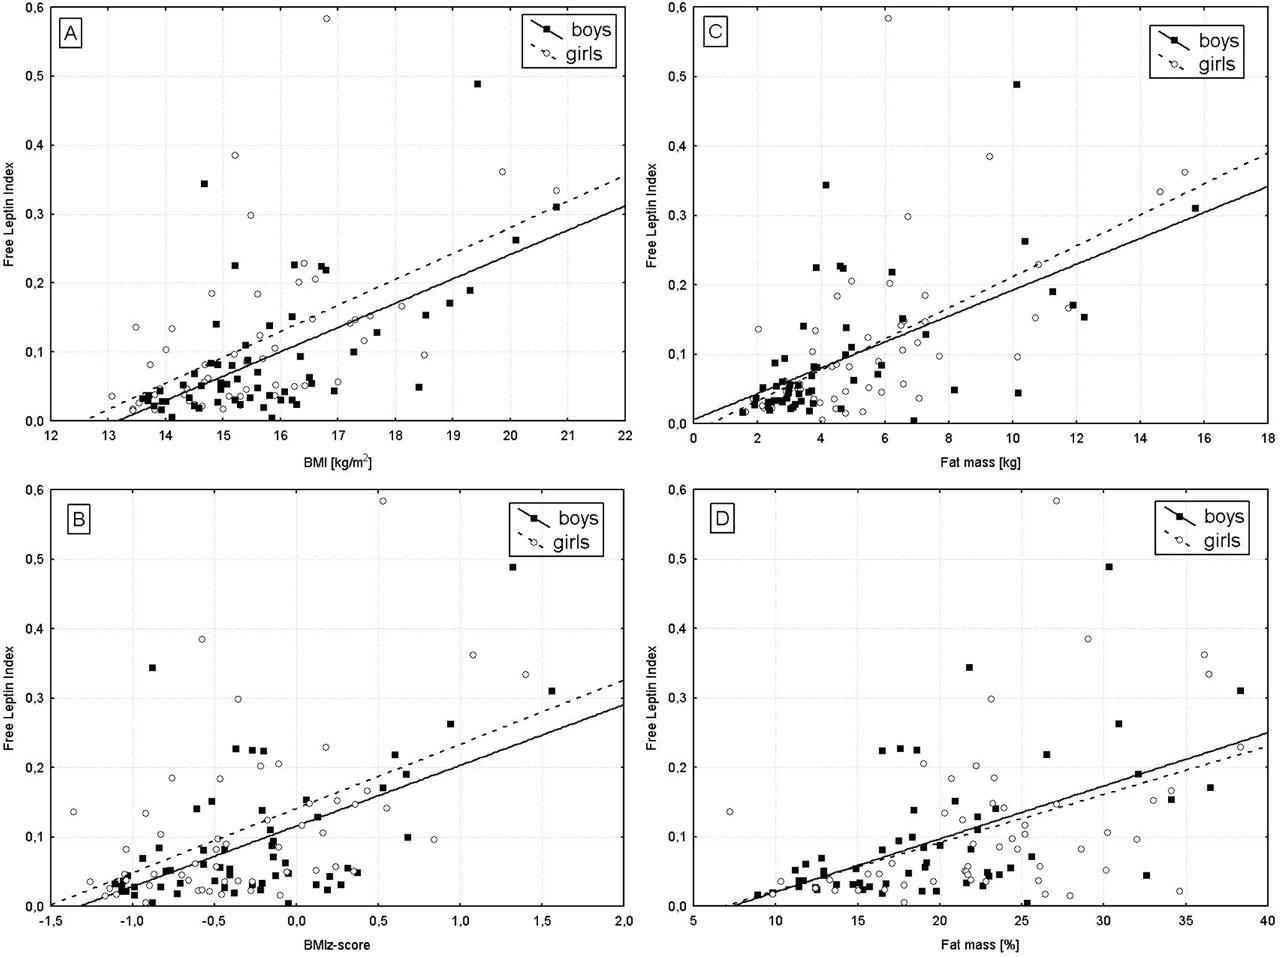
Figure 1.
Leptin, sOB-R, and FLI in the studied populations of children and adolescents_
| Variable | Girls n=114 | Boys n=122 | Total n=236 | p-value |
|---|---|---|---|---|
| Age (years) | 7.7 (5.2–10.1) | 6.5 (5.0–9.1) | 7.0 (5.1–9.8) | 0.118 |
| Weight (kg) | 24.0 (17.7–33.2) | 21.6 (17.4–32.6) | 22.9 (17.6–33.1) | 0.287 |
| Height (cm) | 125.9 (111.9–142.8) | 122.0 (109.9–137.0) | 122.5 (110.1–139.0) | 0.270 |
| BMI (kg/m2) | 15.6 (14.5–17.3) | 15.4 (14.4–16.9) | 15.5 (14.4–17.2) | 0.602 |
| BMI Z-score | −0.43 (−0.89–0.19) | −0.49 (−0.94–0.00) | −0.46 (−0.91–0.12) | 0.273 |
| Leptin (ng/mL) | 3.60 (1.60–6.35) | 2.40 (1.43–3.90) | 2.75 (1.60–5.15) | 0.006 |
| sOB-R (ng/mL) | 39.3 (30.5–51.6) | 40.0 (29.4–52.4) | 39.7 (30.0–52.3) | 0.982 |
| FLI | 0.077 (0.03–0.20) | 0.052 (0.03–0.14) | 0.057 (0.03–0.15) | 0.051 |
Leptin, sOB-R, and FLI in children and adolescents aged 1–18 years old stratified by age, sex, and BMI_
| Parameter/years | Girls (n=114) | Boys (n=122) | ||||||||
|---|---|---|---|---|---|---|---|---|---|---|
| n (Girls/Boys) | BMI (kg/m2) | Percentiles | BMI (kg/m2) | Percentiles | P-value | |||||
| 25 | 50 | 75 | 25 | 50 | 75 | |||||
| Leptin (ng/mL) | ||||||||||
| 1–3 | 12/18 | 15.2 (13.8–15.7) | 0.79 | 1.12 | 1.30 | 14.7 (14.2–16.6) | 1.01 | 1.31 | 1.83 | 0.280 |
| 4–6 | 39/40 | 14.7 (13.8–15.9) | 1.49 | 2.10 | 3.19 | 14.8 (13.9–15.4) | 1.57 | 2.04 | 2.90 | 0.861 |
| 7–9 | 32/33 | 15.7 (14.7–17.2) | 2.77 | 4.90 | 7.03 | 15.9 (14.7–17.2) | 1.60 | 3.10 | 5.83 | 0.104 |
| 10–12 | 11/10 | 16.7 (15.2–17.5) | 3.80 | 4.40 | 7.60 | 16.3 (16.1–18.5) | 1.09 | 3.05 | 5.00 | 0.107 |
| 13–15 | 10/10 | 19.6 (17.5–21.5) | 6.30 | 7.10 | 10.87 | 18.5 (18.0–21.4) | 3.05 | 4.00 | 7.30 | 0.055 |
| 16–18 | 10/11 | 20.3 (19.0–22.1) | 7.95 | 10.24 | 14.00 | 20.9 (20.3–20.9) | 2.80 | 3.20 | 5.10 | 0.004 |
| sOB-R (ng/mL) | ||||||||||
| 1–3 | 12/18 | 15.2 (13.8–15.7) | 48.9 | 55.9 | 61.5 | 14.7 (14.2–16.6) | 50.3 | 61.0 | 69.7 | 0.374 |
| 4–6 | 39/40 | 14.7 (13.8–15.9) | 41.0 | 48.6 | 65.2 | 14.8 (13.9–15.4) | 37.9 | 48.1 | 57.4 | 0.330 |
| 7–9 | 32/33 | 15.7 (14.7–17.2) | 31.0 | 38.1 | 44.4 | 15.9 (14.7–17.2) | 26.8 | 32.7 | 41.7 | 0.142 |
| 10–12 | 11/10 | 16.7 (15.2–17.5) | 29.0 | 32.0 | 34.1 | 16.3 (16.1–18.5) | 26.8 | 28.4 | 35.2 | 0.161 |
| 13–15 | 10/10 | 19.6 (17.5–21.5) | 17.2 | 24.5 | 26.8 | 18.5 (18.0–21.4) | 21.1 | 22.9 | 26.3 | 0.848 |
| 16–18 | 10/11 | 20.3 (19.0–22.1) | 19.5 | 20.8 | 24.5 | 20.9 (20.3–20.9) | 17.2 | 17.4 | 19.8 | 0.072 |
| FLI | ||||||||||
| 1–3 | 12/18 | 15.2 (13.8–15.7) | 0.01 | 0.02 | 0.03 | 14.7 (14.2–16.6) | 0.02 | 0.02 | 0.03 | 0.626 |
| 4–6 | 39/40 | 14.7 (13.8–15.9) | 0.02 | 0.05 | 0.06 | 14.8 (13.9–15.4) | 0.03 | 0.04 | 0.06 | 0.936 |
| 7–9 | 32/33 | 15.7 (14.7–17.2) | 0.05 | 0.14 | 0.20 | 15.9 (14.7–17.2) | 0.04 | 0.08 | 0.16 | 0.189 |
| 10–12 | 11/10 | 16.7 (15.2–17.5) | 0.08 | 0.14 | 0.21 | 16.3 (16.1–18.5) | 0.04 | 0.11 | 0.15 | 0.297 |
| 13–15 | 10/10 | 19.6 (17.5–21.5) | 0.24 | 0.40 | 0.62 | 18.5 (18.0–21.4) | 0.12 | 0.18 | 0.30 | 0.085 |
| 16–18 | 10/11 | 20.3 (19.0–22.1) | 0.28 | 0.54 | 9.77 | 20.9 (20.3–20.9) | 0.14 | 0.16 | 0.33 | 0.053 |
Leptin, sOB-R, FLI, and anthropometric parameters in prepubertal healthy children aged 5–10 years old
| Variable | Girls n=54 | Boys n=60 | Total n=114 | p-value |
|---|---|---|---|---|
| Age (years) | 7.9 (6.3–9.1) | 7.0 (5.5–9.0) | 7.5 (5.7–9.0) | 0.109 |
| Weight (kg) | 23.6 (18.5–28.8) | 22.0 (18.2–27.7) | 23.1 (18.3–28.5) | 0.731 |
| Height (cm) | 124.3 (115.3–133.3) | 122.5 (113.0–132.0) | 123.0 (114.1–132.9) | 0.494 |
| BMI (kg/m2) | 15.3 (14.4–16.4) | 15.4 (14.6–16.4) | 15.3 (14.5–16.4) | 0.527 |
| BMI Z-score | −0.44 (−0.75–0.11) | −0.32 (−0.78–0.08) | −0.38 (−0.77–0.11) | 0.748 |
| Leptin (ng/mL) | 3.65 (1.60–5.93) | 2.75 (1.60–4.75) | 3.00 (1.60–5.33) | 0.212 |
| sOB-R (ng/mL) | 40.2 (33.0–52.4) | 40.7 (32.6–51.0) | 40.5 (32.7–51.5) | 0.714 |
| FLI | 0.08 (0.04–0.15) | 0.05 (0.03–0.13) | 0.06 (0.03–0.14) | 0.317 |
| Fat mass (kg) | 4.87 (3.33–6.71) | 3.63 (2.78–5.38) | 4.23 (2.96–6.54) | 0.004 |
| Fat mass (%) | 23.1 (19.0–27.1) | 18.6 (14.2–23.0) | 21.6 (16.2–25.4) | 0.025 |
Leptin, sOB-R, FLI, and anthropometric parameters in healthy adolescents aged 11–18 years old
| Variable | Girls n=28 | Boys n=25 | Total n=53 | p-value |
|---|---|---|---|---|
| Age (years) | 13.8 (12.0–17.0) | 15.0 (12.7–16.0) | 13.9 (12.0–16.0) | 0.694 |
| Weight (kg) | 48.0 (37.0–59.2) | 57.0 (41.3–65.0) | 50.5 (40.3–61.8) | 0.076 |
| Height (cm) | 162.0 (151.0–166.0) | 174.0 (161.0–179.0) | 164.5 (153.5–172.0) | 0.026 |
| BMI (kg/m2) | 18.4 (17.4–20.3) | 18.9 (18.1–20.9) | 18.6 (17.6–20.7) | 0.634 |
| BMI Z-score | −0.28 (−0.74–0.12) | 0.03 (−0.70–0.29) | −0.21 (−0.73–0.20) | 0.822 |
| Leptin (ng/mL) | 7.10 (4.40–11.30) | 3.90 (2.80–5.40) | 5.40 (3.83–9.10) | 0.001 |
| sOB-R (ng/mL) | 25.1 (19.5–30.0) | 22.3 (19.6–26.8) | 24.8 (19.5–28.6) | 0.141 |
| FLI | 0.28 (0.16–0.54) | 0.16 (0.13–0.20) | 0.21 (0.14–0.40) | 0.005 |