
Figure 1.
Figure 2.
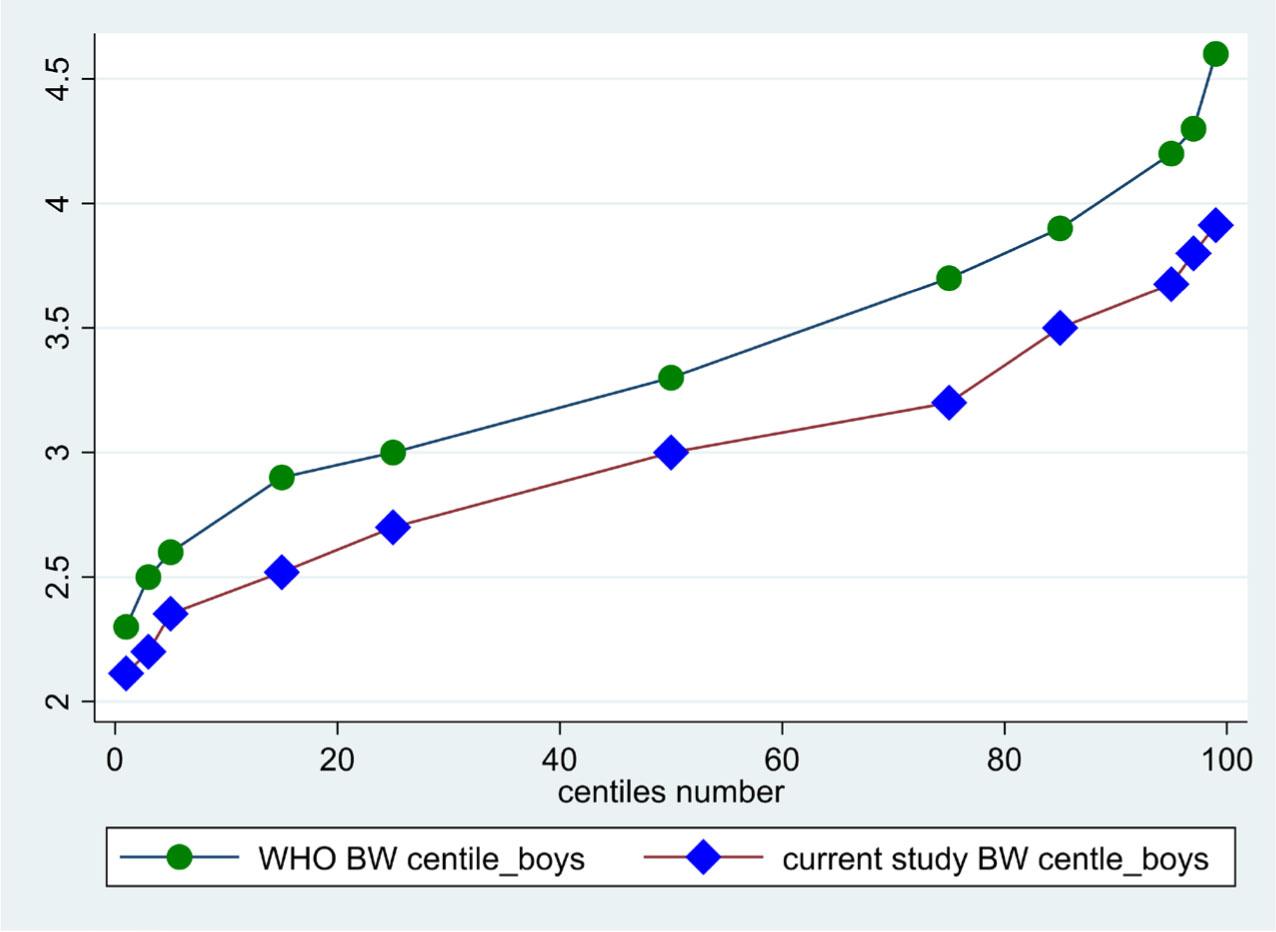
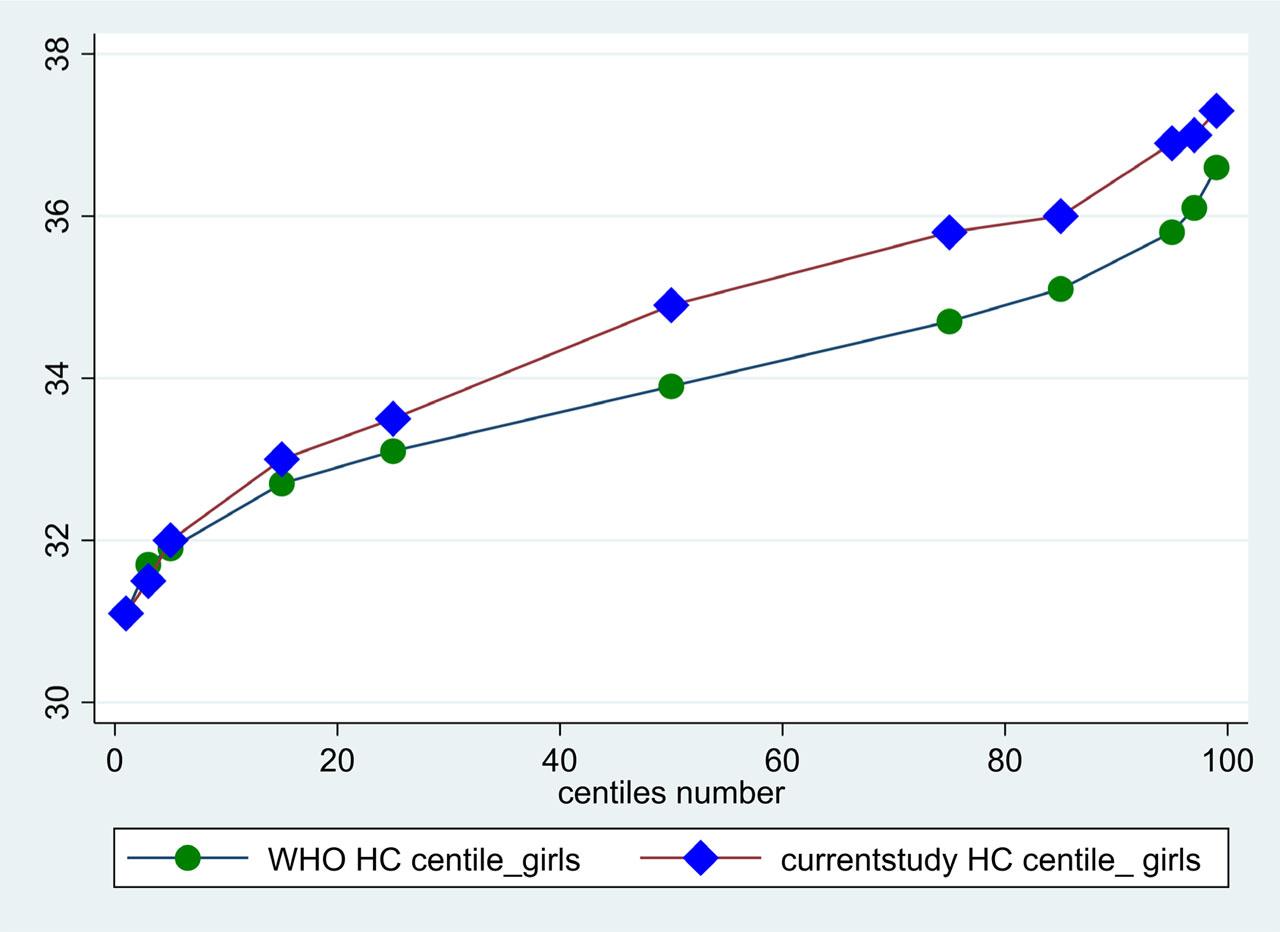
Figure 3.
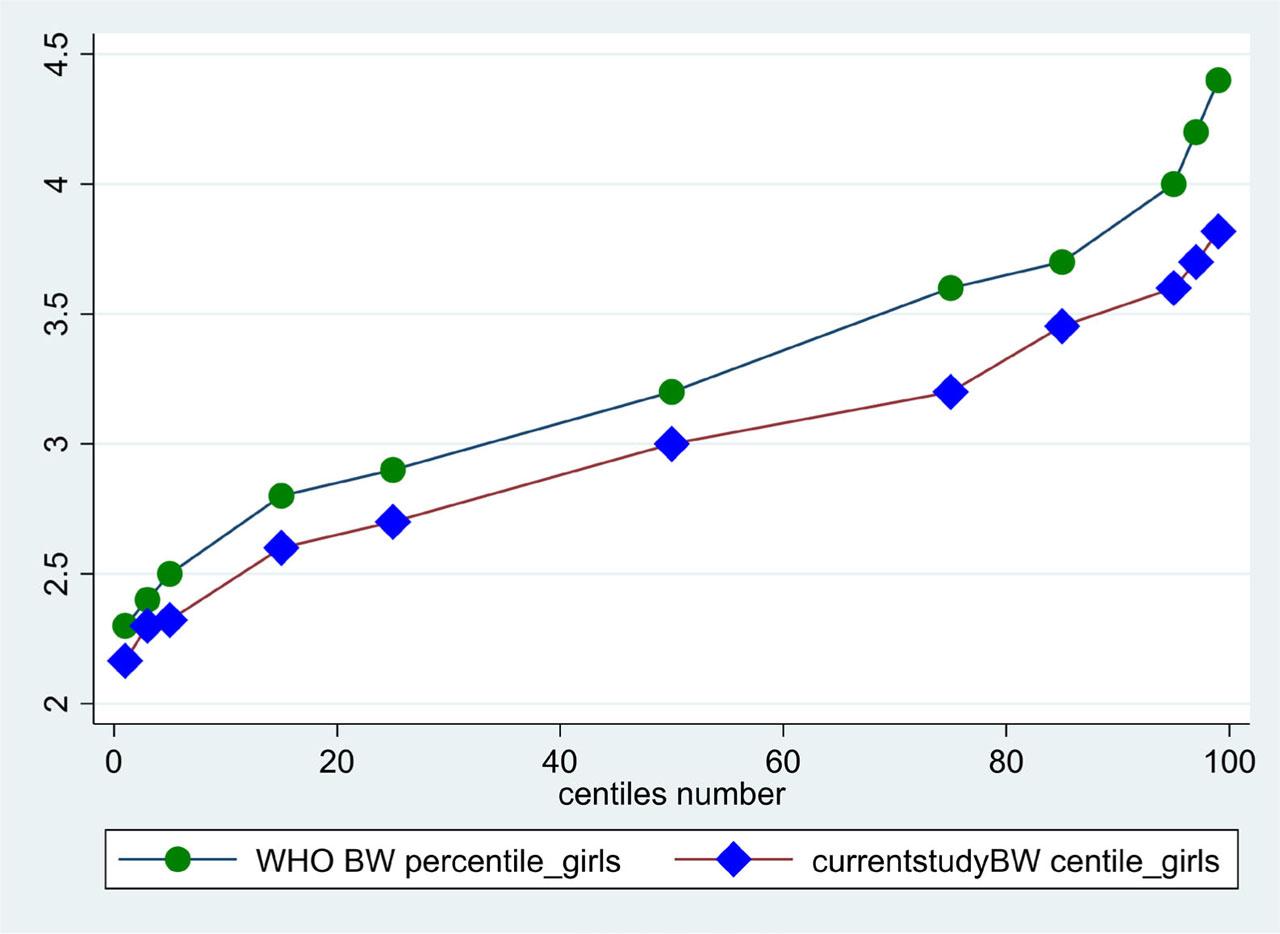
Figure 4.
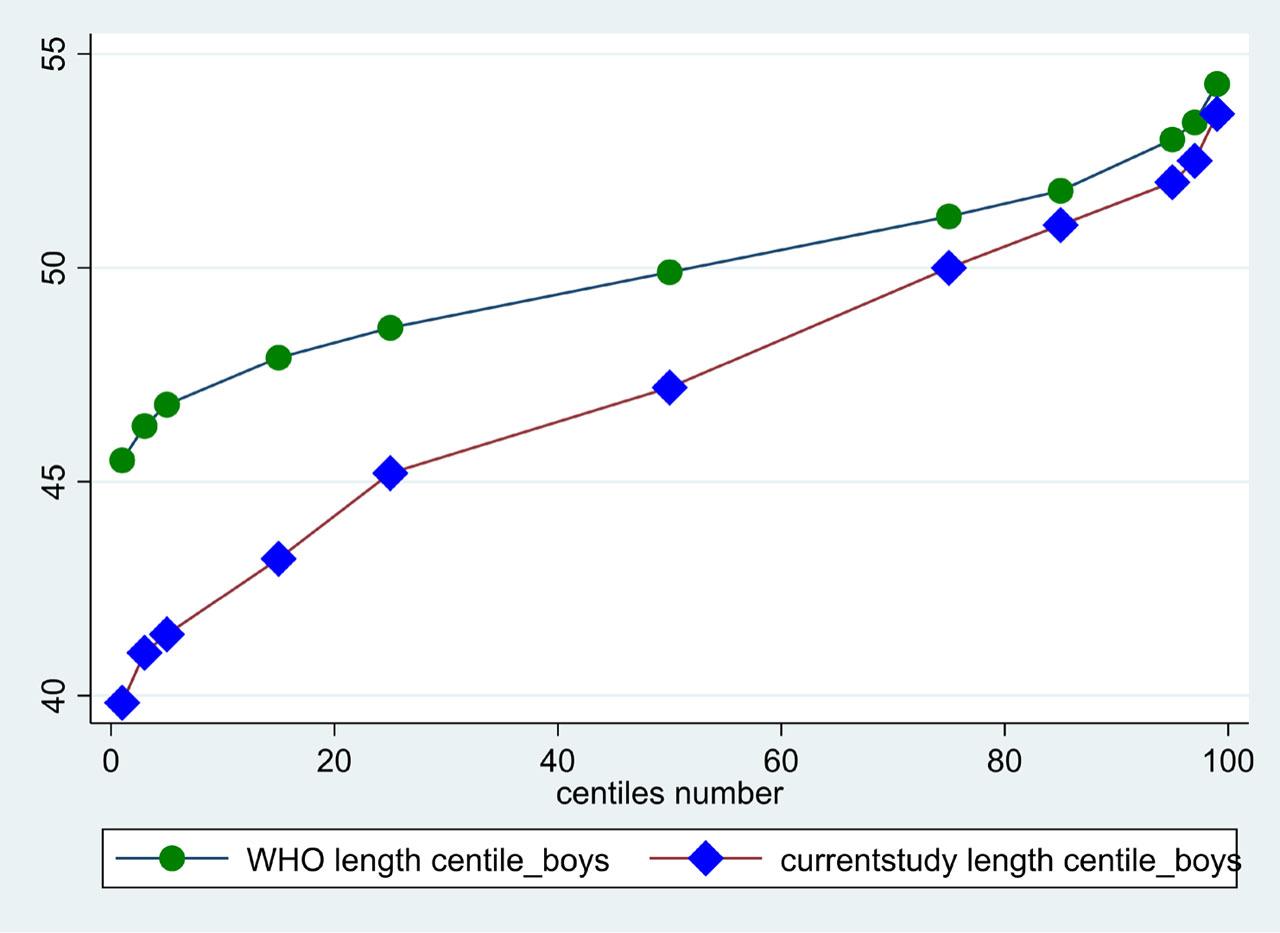
Figure 5.
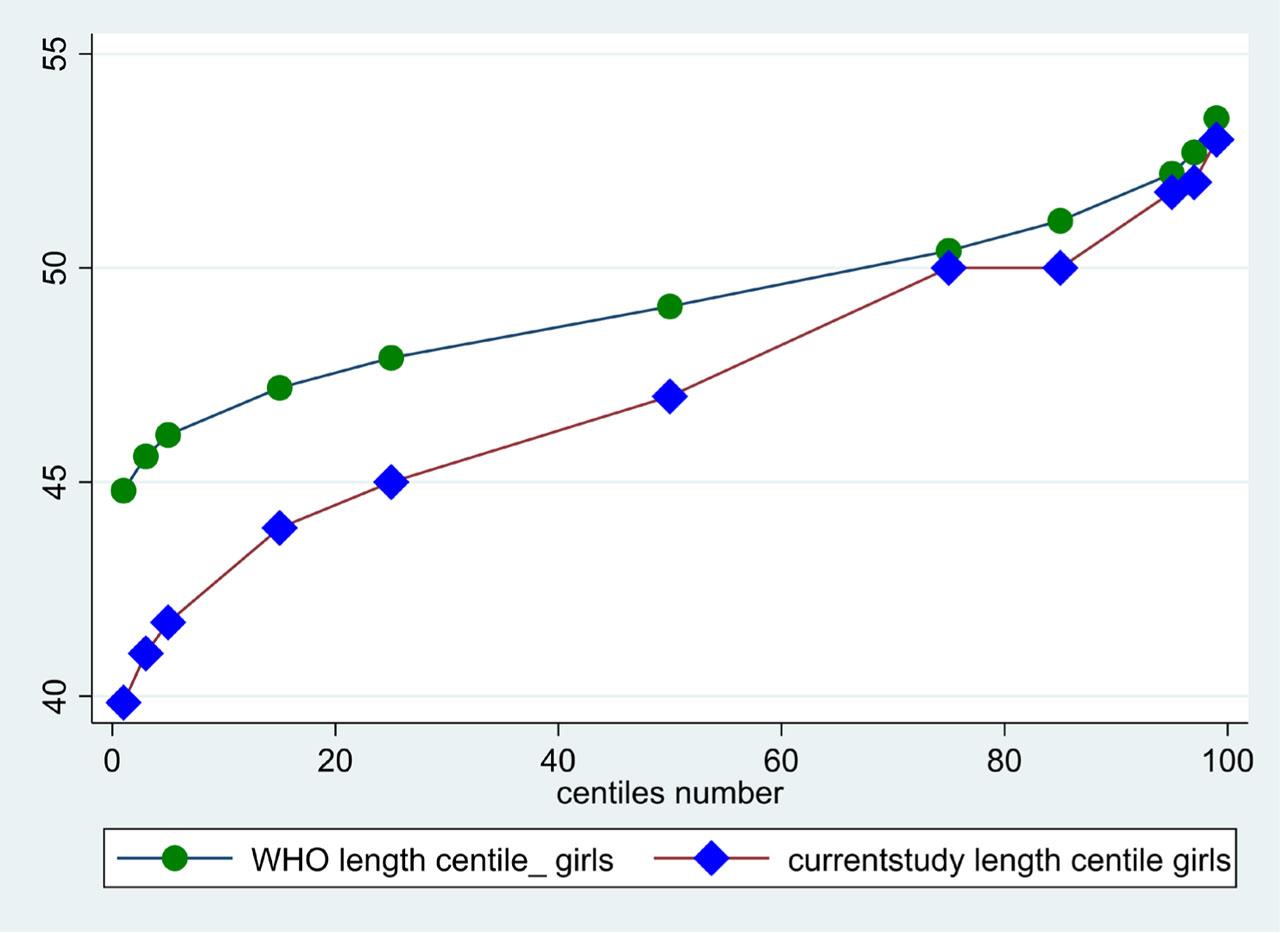
Figure 6.
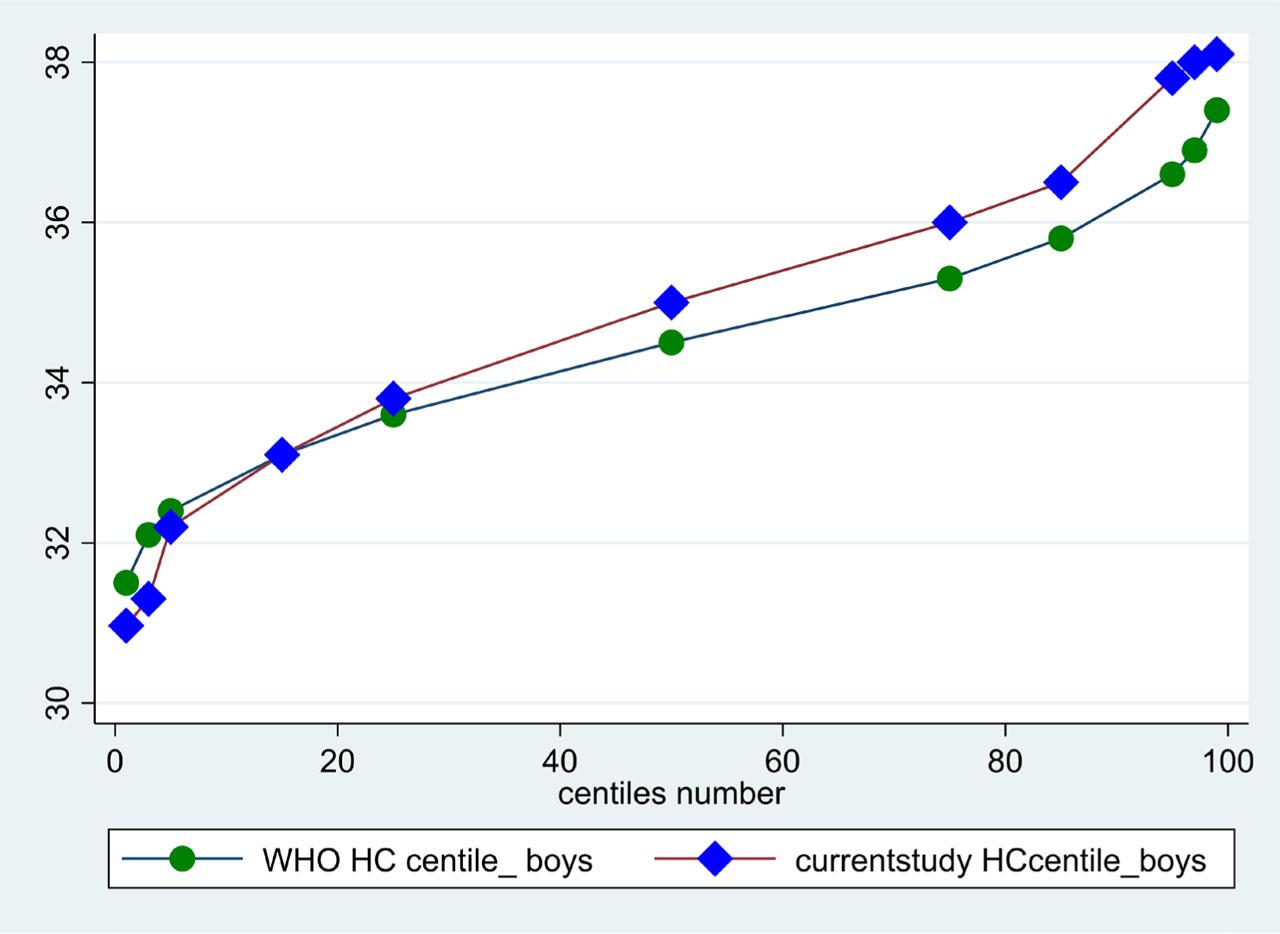
Figure 7.
Pairwise comparison of mean birth weight, length and HC between female and male term newborns at different GA with its statistical significance in UoGCSH, Northwest Ethiopia (n = 333)_
| GA and sex | Contrast (mean difference) | Standard error | Tuckey result | |
|---|---|---|---|---|
| t statistic | P value | |||
| Birth weight | ||||
| (37#female) vs. (37#male) | 53.97 | 75.42 | 0.72 | 1.000 |
| (38#female) vs. (38#male) | −34.42 | 91.55 | −0.38 | 1.000 |
| (39#female) vs. (39#male) | −84.99 | 92.13 | −0.92 | 0.999 |
| (40#female) vs. (40#male) | −122.11 | 101.76 | −1.20 | 0.989 |
| (41#female) vs. (41#male) | −81.67 | 152.54 | −0.54 | 1.000 |
| (42#female) vs. (42#male) | 39.67 | 171.68 | 0.23 | 1.000 |
| Crown heel length | ||||
| (37#female) vs. (37#male) | 0.45 | 0.60 | 0.76 | 1.000 |
| (38#female) vs. (38#male) | −0.85 | 0.73 | −1.17 | 0.991 |
| (39#female) vs. (39#male) | 0.02 | 0.73 | 0.03 | 1.000 |
| (40#female) vs. (40#male) | −1.51 | 0.81 | −1.86 | 0.781 |
| (41#female) vs. (41#male) | −1.79 | 1.22 | −1.47 | 0.947 |
| (42#female) vs. (42#male) | −2.36 | 1.37 | −1.72 | 0.856 |
| HC | ||||
| (37#female) vs (37#male) | 0.13 | 0.29 | 0.46 | 1.000 |
| (38#female) vs (38#male) | −0.36 | 0.35 | −1.02 | 0.997 |
| (39#female) vs (39#male) | −0.73 | 0.36 | −2.06 | 0.655 |
| (40#female) vs (40#male) | −0.39 | 0.39 | −0.99 | 0.998 |
| (41#female) vs (41#male) | −1.53 | 0.59 | −2.61 | 0.280 |
| (42#female) vs (42#male) | −0.26 | 0.66 | −0.39 | 1.000 |
Sex-specific (male, female, and both sex) mean ± SD value for newborn characteristics (GA, birth weight, length, and HC) in UoGCSH, Northwest Ethiopia 2022 (n = 333)_
| Parameters | Male Mean (SD) | Female Mean (SD) | Total Mean (SD) | 95% CI for the total |
|---|---|---|---|---|
| GA (weeks) | 38.6 (1.49) | 38.8 (1.53) | 38.7 (1.52) | 38.54–38.86 |
| Birth weight (gm) | 2983.6 (395) | 2970.5 (372.1) | 2977 (383.1) | 2935.7–3018.3 |
| Length (cm) | 47.27 (3.2) | 46.8 (2.85) | 47.05 (3.05) | 46.72–47.37 |
| HC (cm) | 34.86 (1.6) | 34.57 (1.44) | 34.7 (1.51) | 34.6–34.88 |
Birth weight, length and HC percentiles values for term newborn in the UoGCSH, Northwest Ethiopia, 2022 (n = 333)_
| Variables | Percentiles | ||||||
|---|---|---|---|---|---|---|---|
| 3rd | 10th | 25th | 50th | 75th | 90th | 97th | |
| Boys (n=165) | |||||||
| Birth weight | 2200 | 2500 | 2700 | 3000 | 3200 | 3500 | 3800 |
| Length | 41 | 42.26 | 45.2 | 47.2 | 50 | 51.3 | 52.5 |
| HC | 31.3 | 33 | 33.8 | 35 | 36 | 37 | 38 |
| Girls (n=168) | |||||||
| Birth weight | 2300 | 2509 | 2700 | 3000 | 3215 | 3500 | 3697.9 |
| Length | 41 | 43 | 45 | 47 | 48.6 | 50.5 | 52 |
| HC | 31.5 | 32.5 | 33.5 | 34.9 | 35.8 | 36.1 | 37 |
Pearson Correlation coefficient (r) between newborn and maternal anthropometry with the levels of significance at UoGCSH, Northwest Ethiopia, 2022 (n = 333)
| Newborn anthropometry | Maternal anthropometry | ||||
|---|---|---|---|---|---|
| Weight | Height | MUAC | BMI | LBM | |
| Birth weight | 0.36*** | 0.2077*** | 0.3715*** | 0.2661*** | 0.3601*** |
| Length | 0.2998*** | 0.2220*** | 0.3532*** | 0.1878*** | 0.3244*** |
| HC | 0.2746*** | 0.1348* | 0.2820*** | 0.2169*** | 0.2598*** |
GA specific mean ± SD value of birth weight, length and HC of term newborns (both sex), in the UOGCSH, Northwest Ethiopia, 2022 (n = 333)_
| GA (weeks) | Number (%) | Birth weight (g) mean (SD) | Length (cm) Mean (SD) | HC (cm) Mean (SD) |
|---|---|---|---|---|
| 37 | 99 (29.7) | 2867.5 (403.64) | 46.31 (3.05) | 34.17 (1.63) |
| 38 | 67 (20) | 2942.7 (318.63) | 47.01 (2.66) | 34.65 (1.28) |
| 39 | 67 (20) | 3027.3 (373.5) | 46.89 (3.1) | 34.8 (1.5) |
| 40 | 54 (16.2) | 2993.7 (397.38) | 47.72 (3.25) | 34.92 (1.36) |
| 41 | 27 (8) | 3103.3 (330.1) | 48.07 (3.1) | 35.59 (1.39) |
| 42 | 19 (5.7) | 3264.2 (349.5) | 48.16 (2.54) | 35.6 (1.25) |