
1. Introduction
The southwestern Tibetan Plateau (TP) is the headwater region of several large rivers of Asia, including the Yarlungzangbo-Brahmaputra, Indus and Ganges. The water resources in this region are particularly important for billions of people through sustaining the agriculture and industry downstream in the context of climate change (Barnett et al., 2005; Immerzeel et al., 2010; Kapnick et al., 2014; Yao et al., 2012). An understanding of regional hydroclimate in the headwaters of these large rivers is critical for prudent water resource management. Water stable isotopes (δ18O and δD) have become increasingly used as valuable naturally occurring tracers of water cycle in remote areas. The forefront of isotopic hydroclimate studies has specifically emphasised on temporal and spatial variability in water isotopes across the Indus headwaters (Karim and Veizer, 2002) and the Ganges headwaters (Ramesh and Sarin, 1992; Lambs, 2000) to determine the moisture sources, surface runoff generation, environmental and geographical controls on precipitation. In contrast, the Yarlungzangbo headwater region is much less studied in the field of stable isotopic tracing, although it is geographically important in regional geology, hydrology and climatology.
The Yarlungzangbo is the highest large river in the world, and the Himalaya significantly influences the moisture transport over this basin. Studies have revealed the monsoonal air masses penetrate into this basin mainly along the Yarlungzangbo from the eastern Himalayan syntaxis (Gao et al., 1985; Hren et al., 2009), and less moisture is transported directly through low passes (Trans-Himalayan rivers) in the central Himalaya (Kang et al., 2002; Bookhagen et al., 2005; He et al., 2015). More recently, isotopic investigations in the Yarlungzangbo basin have sought to gain an insight into regional moisture sources and the ‘isotopic altitude effect’. Tian et al. (2001, 2007) reported that precipitation in the southern TP (e.g. Lhasa) is predominantly controlled by the summer monsoon circulation. Yu et al. (2015) studied the dates of the monsoon inset and retreat north of the Himalaya. Yang et al. (2009) and Yu et al. (2010) revealed the vertical lapse rates of river δ18O in the southeastern TP and Lhasa river (a major tributary of the Yarlungzangbo) basin. Hren et al. (2009) and Liu et al. (2008b) demonstrated the moisture transport paths based on spatial variability in water stable isotopes in the lower/middle Yarlungzangbo basin. However, our understanding of water inventory in the Yarlungzangbo headwaters of the southwestern TP remains poor largely due to a paucity of hydrological measurements/investigations.
In this study, a range of water samples (including snow, ice, stream, river, pond and lake waters) were collected in the Yarlungzangbo headwater region and its vicinity in July 2012. Here we identify the isotopic variation patterns of these waters as well as the corresponding controls. Data are particularly used to investigate hydrological processes in the upper Yarlungzangbo system and regional moisture sources.
2. General setting
The Yarlungzangbo flows from west to east in the southern TP (Fig. 1a), extending ~2000 km and covering a catchment area of ~240 000 km2 in China. Its headwaters are located in the southwestern TP and are situated between two approximately east–west trending mountain ranges of the western Himalaya and Gangdise (Fig. 1b). This river ultimately rises in the Jiemayangzong (JMYZ) Glacier in the northern slope of the western Himalaya (Fig. 1b and c), which encompasses an altitude range between ~5100 and ~5700 m a.s.l. A glacier lake (~1.9 km long and ~0.6 km wide) with an apparent outlet situates in front of this glacier. The upper Yarlungzangbo is approximately flowing from the JMYZ Glacier to the Saga city (Fig. 1b) and the tributaries mainly include the Angsequ, Mayouzangbo, Caiqu and Jiadazangbo. Two large inland lakes of the Manasarovar and Lhanag Co are just located west of the Yarlungzangbo headwaters (Fig. 1b). The average altitude of this area is >5000 m a.s.l., and the climate here is semiarid primarily because of the Himalaya which blocks moisture transport from the Indian Ocean to the south, and the Karakoram and Pamir which block moisture transport from the Mediterranean and Atlantic Ocean to the west. Precipitation at the nearest meteorological station of Pulan (30.29 °N, 81.17 °E, 3890 m a.s.l., ~100 km west of the JMYZ Glacier, Fig. 1b) concentrates in winter-spring and summer. Annual average precipitation amount and temperature at Pulan are 157 mm and 3.2 °C, respectively. Nonetheless, the precipitation at higher elevations (e.g. on the Naimonanyi Glacier, Fig. 1b) can reach as much as ~5 times of that at Pulan (Tian et al., 2012).
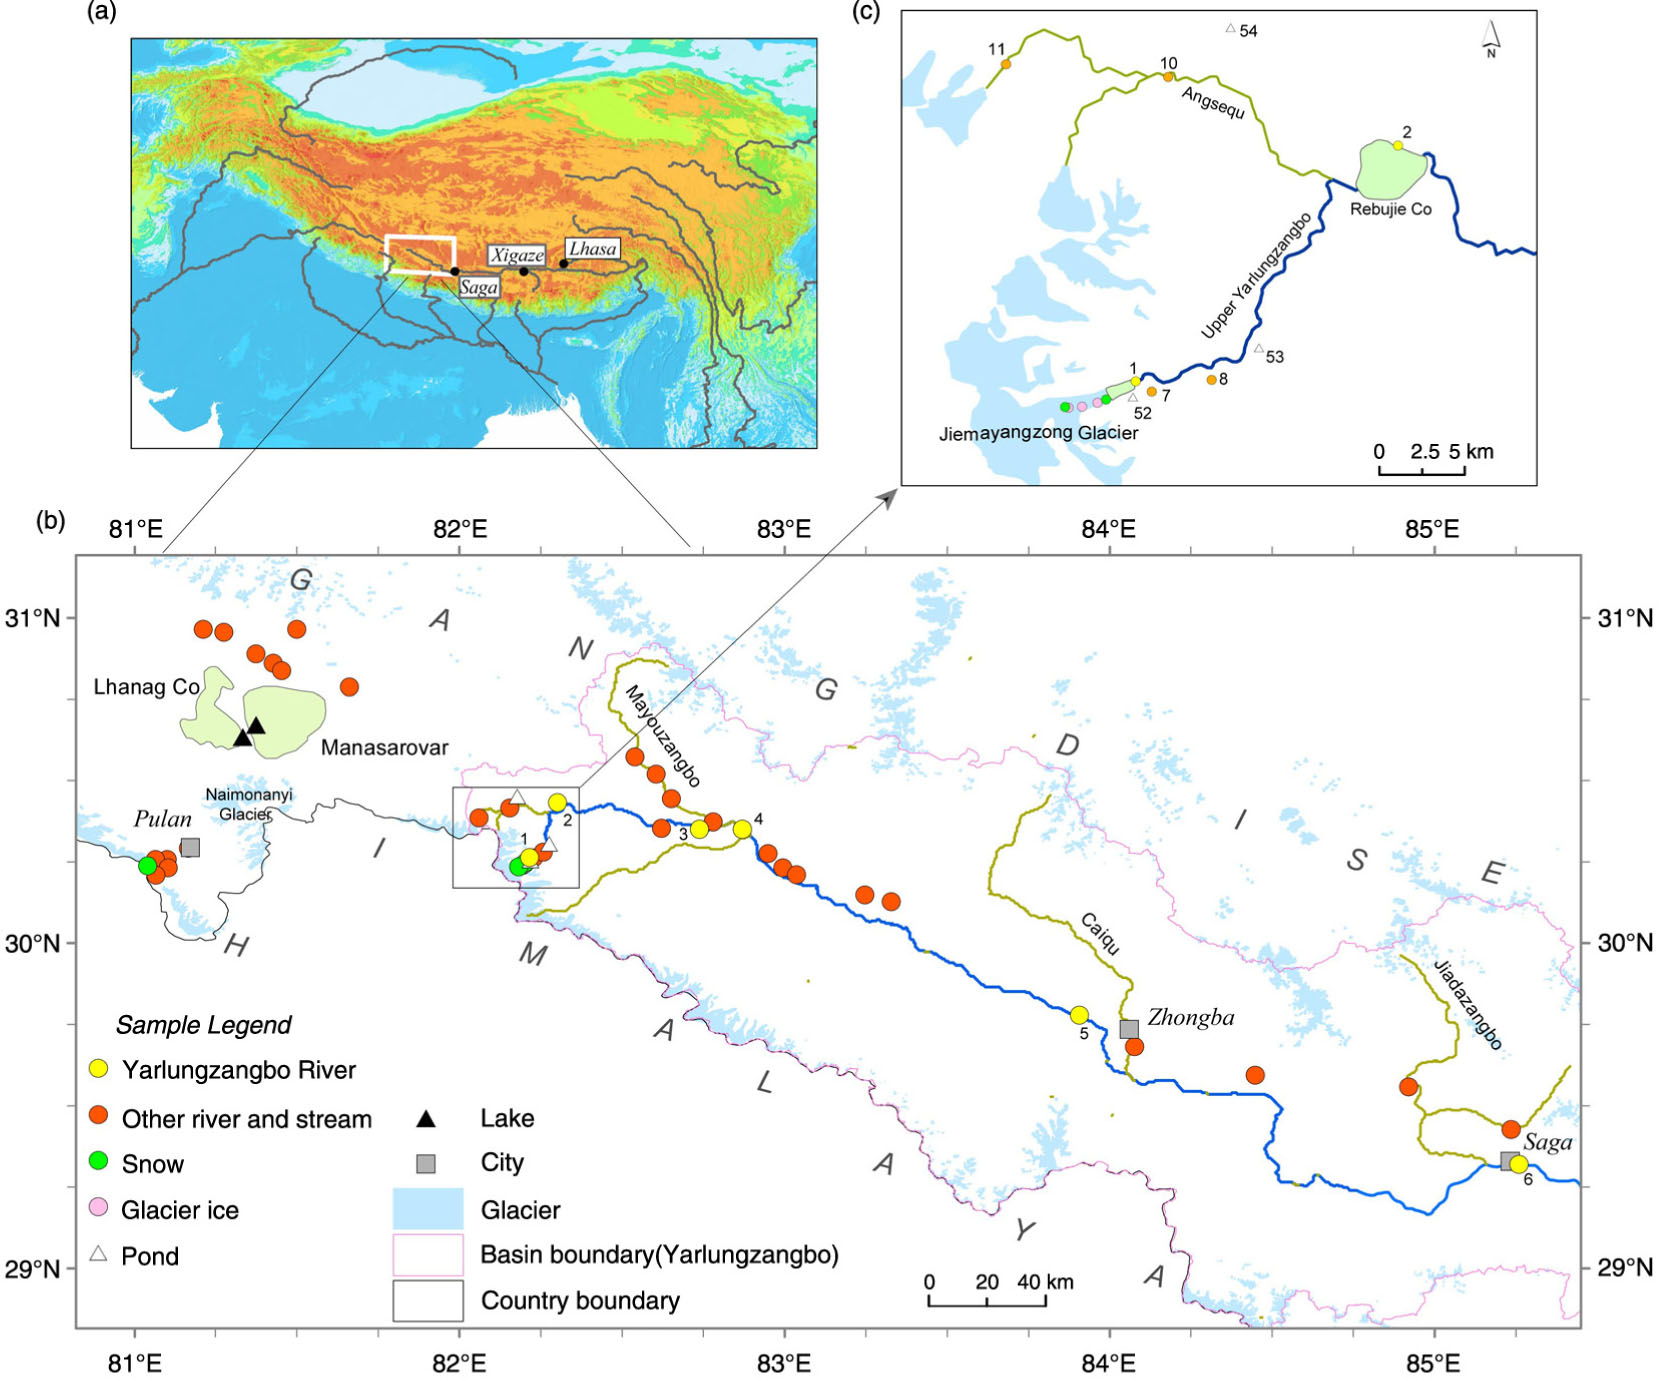
Fig. 1
(a) Geographical location of the Yarlungzangbo headwater region; (b) sample location map of various waters from the Yarlungzangbo headwater region and its vicinity, showing the upper Yarlungzangbo flows from the Jiemayangzong Glacier in the western Himalaya to the site near Saga; (c) sample location map of waters in the Yarlungzangbo source area. Some sample numbers are also shown.
3. Method
A range of water samples were collected during a synoptic survey in July 2012 across the headwater region of the Yarlungzangbo and its vicinity. Three surface glacier ice and two surface snow samples were obtained at altitudes of ~5120 to ~5330 m a.s.l. from the ablation zone of the JMYZ Glacier. Three pond water samples were obtained near the JMYZ Glacier (Fig. 1c). Two ponds (for sample 52 and 54) have no outlet or inlet and the third large but shallow one (for sample 53) is connected with the main channel through a narrow outlet. We sampled waters in the upper Yarlungzangbo and its tributaries (river/stream) from the JMYZ Glacier lake to Saga (Fig. 1b). Tributaries originating from the western Himalaya were not sampled completely due to the inaccessibility. We also collected waters in the western vicinity of the Yarlungzangbo headwaters (i.e. Manasarovar/Lhanag Co/Pulan region), including one surface snow, two lake and twelve stream samples. Moreover, we collected nine river/stream samples from Xigaze in the middle Yarlungzangbo basin (Fig. 1a) westward to the study area along National Roads 318 and 219, conducting a generally east–west transect (covering ~8 degrees longitude).
All water samples were sealed in 50 mL high-density polyethylene bottles. These bottles were filled completely and kept at cool temperatures prior to analysis to avoid post-sampling evaporation. The δ18O and δD of all water samples were measured by cavity ringdown laser spectroscopy (CRDS) using a L1102-i Picarro water isotope analyzer in the key Laboratory of Tibetan Environment Change and Land Surface Processes, Chinese Academy of Sciences. Analytical uncertainties are ±0.1 ‰ for δ18O and ±0.5 ‰ for δD. Results are calibrated respect to VSMOW (Vienna Standard Mean Ocean Water) standard.
4. Results
All measured isotopic values are listed in Table 1 and plotted in Fig. 2a. The linear relationship between δ18O and δD values of global fresh waters was proposed by Craig (1961) as δD=8δ18O+10 or by Clark and Fritz (1997) as δD=8.17δ18O+10.35. The global meteoric water line (GMWL) has proven to be a useful reference line for understanding the spatial variability in precipitation isotopes and evaporation effect based upon the deviation from it (Rozanski et al., 1993). Precipitation and surface waters commonly lie close to the GMWL, usually with a lower slope due to subcloud evaporation of rainfall and surface evaporation. From Fig. 2a, two lake waters (samples 55 and 56) and two pond waters (samples 52 and 54) significantly deviate from the GMWL, indicating the importance of evaporation due to long water residency time in surface storage. Other waters obtained from the Yarlungzangbo headwaters and the Manasarovar/Lhanag Co region fall well along the GMWL, indicating minimal evaporation. Some overlaps of data points for these two hydrological domains probably indicate some similarity in local hydroclimate due to the geographical proximity. However, waters obtained from the Pulan region all fall above the GMWL on the up-right side, while those from the middle Yarlungzangbo basin all fall below the GMWL on the down-left side. These suggest fundamental differences in hydroclimate between the Pulan region and the middle Yarlungzangbo basin, while the Yarlungzangbo headwaters and the Manasarovar/Lhanag Co region are probably in between.
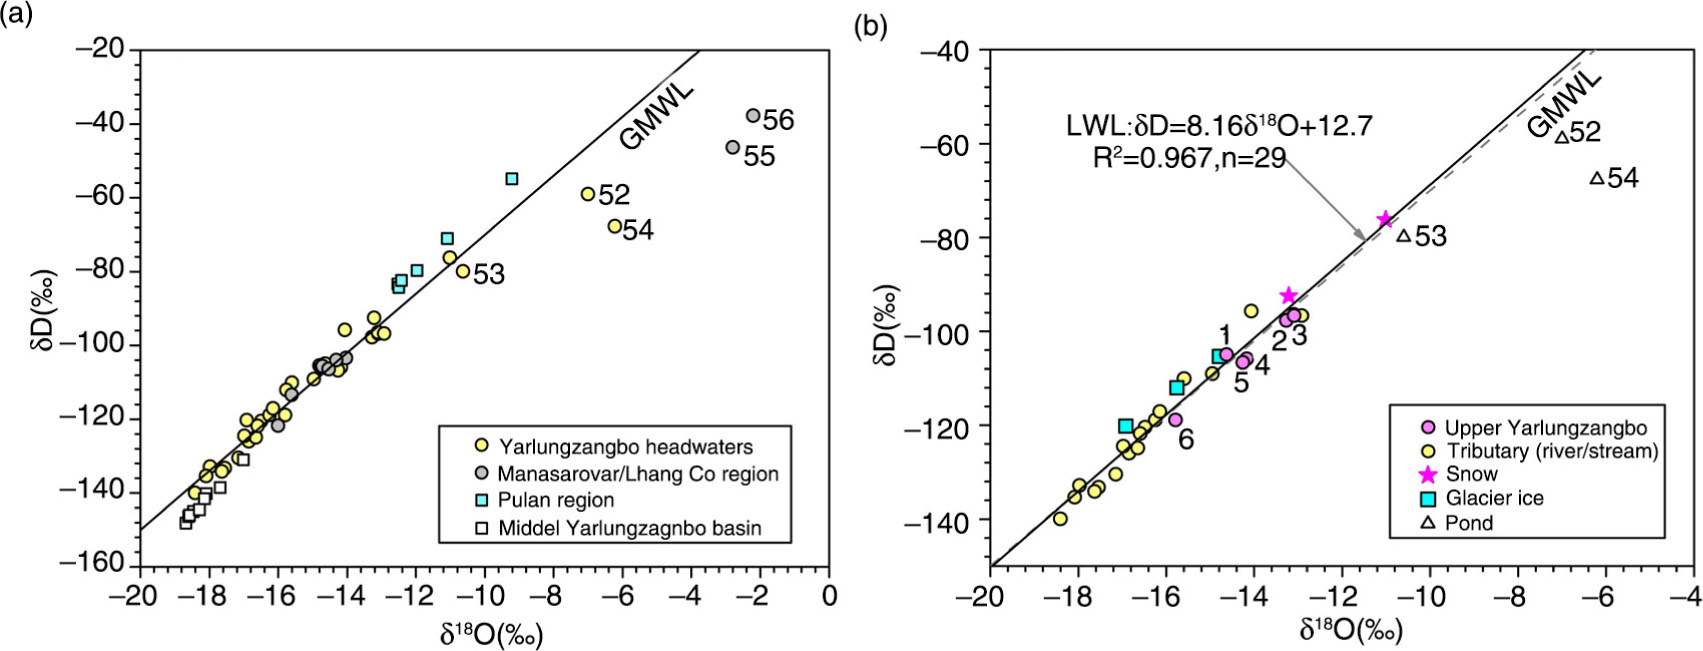
Fig. 2
(a) δ18O and δD results of all waters in relation to the GMWL (δD=δ18O+10) (samples are divided into four categories based upon their geographical locations and the lake/pond sample numbers are shown); (b) δ18O and δD results of various types of water in the Yarlungzangbo headwaters. The local water line (LWL) is developed using isotopic data of snow, ice, river and stream samples.
Table 1. Sample localities and measured isotopic data
[i] aMain flow of the upper Yarlungzangbo. bOut of the range of Fig. 1b and were sampled from Xigaze westward to Saga. cd-excess=δD – 8δ18O.
In the Yarlungzangbo headwaters, isotopic values range from −18.41 ‰ to −6.22 ‰ for δ18O and from −139.9 ‰ to −59.0 ‰ for δD, respectively. Two pond waters (sample 52, 54) are the most isotopically enriched, and the water obtained from the Caiqu River near Zhongba is the most isotopically depleted. Regression of data points with the exception of pond waters yields a local water line (LWL) of δD=8.16δ18O+12.77 (R 2=0.967, n=29) (Fig. 2b), which is very similar to the GMWL. The d-excess [d-excess=δD – 8δ18O (Dansgaard, 1964)] of precipitation, with a global average of 10 ‰, is associated with atmospheric conditions (e.g. relative humidity and temperature) in the moisture source region and kinetic effect during precipitation processes (Jouzel and Merlivat, 1984; Araguás-Araguás et al., 2000). It increases when moisture is recycled and decreases when subcloud/surface evaporation occurs (Clark and Fritz, 1997; Froehlich et al., 2008). Precipitation in the eastern Mediterranean is characterised by high d-excess of ~22 ‰ (Gat and Carmi, 1970), and moisture originating from the Mediterranean (or other inland seas) predominates the Indus headwaters in the Karakoram and the western Himalaya (Karim and Veizer, 2002). Across the TP and the Himalaya, precipitation derived from continental/local recycled moisture has high d-excess values. For example, in winter–spring months, substantial precipitation in the high Himalaya and scant precipitation in the southern TP is controlled by the westerlies and is characterised by much higher d-excess relative to summer monsoon precipitation (Tian et al., 2005, 2007; Yao et al., 2013). The weighted-average d-excess of summer monsoon precipitation is found to be as low as ~4 ‰ to ~6 ‰ in the northern slope of the central Himalaya and in the southern TP, which is believed to mainly result from the high relative humidity over the moisture source region (i.e. Bay of Bengal) (Kang et al., 2002; Tian et al., 2007; Xu et al., 2011). Water d-excess in the Yarlungzangbo headwaters in this study ranges from ~−18.0 ‰ (sample 54, a pond water) to ~16.9 ‰ (sample 11, a streamwater from the western Himalaya). With the exception of pond samples, waters have an average d-excess of 10.3±2.8 ‰, remarkably higher than that of monsoon precipitation in the southern TP but lower than the Mediterranean value. It is possible that processes during moisture transport/rainout (e.g. mixing of various summer-time moisture) and surface runoff generation (e.g. mixing of different seasonal precipitation) obscure the original moisture source signal.
5. Discussion
5.1. Stable isotopic pattern in the JMYZ Glacier area
The JMYZ Glacier can get snowfall accumulation in both winter–spring and summer due to its high altitude. Although the sample population is small, a systematic isotopic pattern still can be observed for surface snow and ice collected in the ablation zone of the JMYZ Glacier. Remarkably, the snow is significantly more isotopically enriched than the ice, and these waters demonstrate a pronounced linear correlation of δD=7.51δ18O+6.37 (R 2=0.999) in δ18O – δD space (Fig. 3), likely suggesting they follow a unique mixing line. The snow approximately represents recent summer-time precipitation because winter/spring snow in the ablation zone of this glacier had melt out during the late spring and early summer. However, the ice isotopes may be not original because of various processes in the ablation zone of a glacier. As revealed by chemical and isotopic investigation studies, processes such as evaporation, melt, sublimation and recrystallisation profoundly change the ice isotopic compositions, and these influences progressively diminish with depth (Moser and Stichler, 1974; Herreros et al., 2009; Lechler and Niemi, 2011). Among these, mixing between the original ice and precipitation is supposed to be the most important when isotopic compositions in ice and precipitation are substantially different (Arnason, 1981; Clark and Fritz, 1997; Rietti-Shati et al., 2000). In the ablation zone of the JMYZ Glacier, the original ice isotopes have probably been also altered by summer-time precipitation during its melting and percolation. Summer-time precipitation is the enriched end-member of the mixing line in which the original ice is the depleted end-member. From Fig. 3, it is apparent that the glacier lake water nearly falls on the snow-ice regression line and shows an intermediate isotopic value. However, it is difficult to make a broad conclusion at this present stage because the glacier lake hydrology is complicated due to varying contributions of glaciermelt, shallow groundwater and direct summer-time precipitation. If this lake water can represent long-term average glaciermelt of the JMYZ Glacier, the glaciermelt is thus a mixture of isotopically depleted icemelt and enriched summer-time precipitation. Furthermore, two streamwaters likely vary under a different regime and fall along the LWL, probably suggesting their major sources of long-term average precipitation. Based upon these observations, we recommend that a systematic strategy for snow, ice, glacier lake water collection should be applied in future efforts to better determine the local isotopic regime.
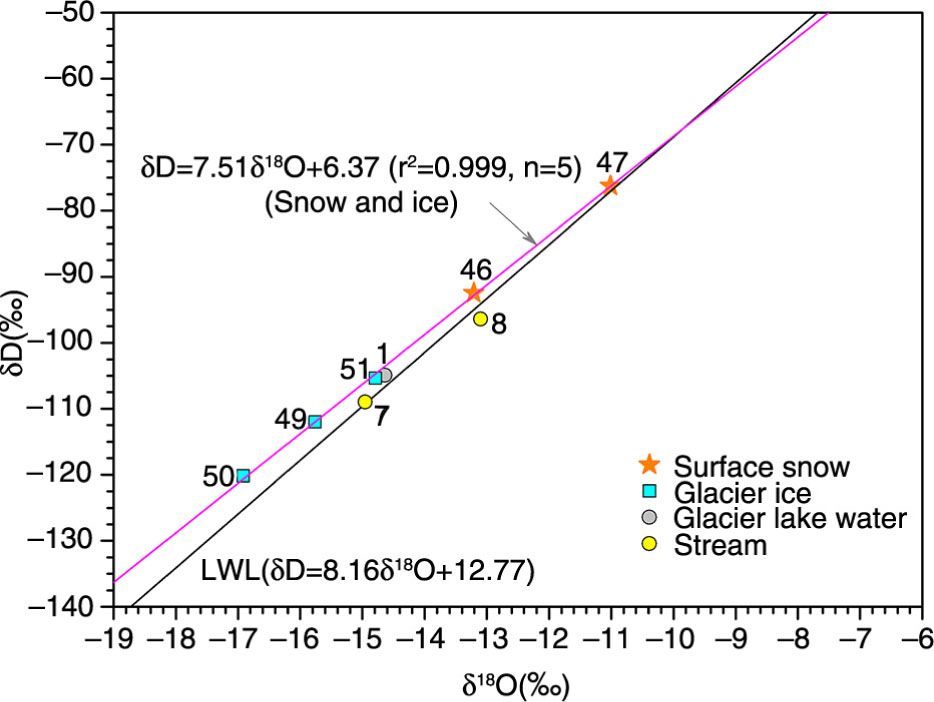
Fig. 3
δ18O and δD of surface snow/glacier ice (in the ablation zone of the Jiemayangzong Glacier), glacier lake and stream water samples in the Jiemayangzong Glacier area.
5.2. Hydrological processes along the upper Yarlungzangbo
As shown in Fig. 2b, waters in the main stem and tributaries in the upper Yarlungzangbo system fall close to the GMWL in despite of a semiarid climate, indicating the evaporation is not important because of the rapid flow due to steep elevation gradient and cold temperatures. From Fig. 4, main flow δ18O shows an increase (from −14.64 ‰ to −13.09 ‰) in the reach between the JMYZ Glacier lake and the site above the confluence with the Mayouzangbo. This is likely caused by a slight open-water evaporation because there are several flow-through lakes in this region (the largest one is the Rebujie Co, Fig. 1c) and the tributary flow of the Angsequ (sample 10, −15.60 ‰) is more isotopically depleted. Downstream from the site above the confluence with the Mayouzangbo, main flow δ18O values contrast sharply with those of tributary influx which are ~3 ‰ lower on average. Particularly, main flow δ18O values at two sites ~20 km apart (i.e. above vs. below the confluence with the Mayouzangbo) are significantly different (−13.09 ‰ and −14.18 ‰), while the influx δ18O is −16.15 ‰. By applying a two-member mixing model, a contribution of ~36% was needed from the Mayouzangbo to produce such an isotopic change in the sampled downstream flow, consistent with the traditional view that the Mayouzangbo is one of the most important tributaries of the upper Yarlungzangbo. Then, there is a large flow-through lake (~20 km long and ~3 km wide) in the main channel. Although the stream influx of this lake shows more depleted signal (samples 28–32, mean δ18O=−16.98±0.39 ‰), the outflow δ18O (sample 5, −14.26 ‰) is nearly identical to that upstream (sample 4, −14.18 ‰), presumably because water passes rapidly through this lake and the stream influx exerts minimal isotopic influence on main flows. Downstream from this flow-through lake, dilution of tributary input is clearly the leading cause of the progressive depletion in the main flow isotopes. For example, waters in the Caiqu and Jiadazangbo have δ18O values of ~−18 ‰, much lower than those of main flows. Thus, contribution of isotopically depleted tributary influx is the major hydrological process along the upper Yarlungzangbo, while the evaporation is minimal. Note that the upper Yarlungzangbo exhibits a characteristic downstream decrease in δ18O, which is opposite to the anticipated pattern due to the ‘altitude effect’ on precipitation isotopes and cumulative effect of evaporation as water flows downstream (Ramesh and Sarin, 1992; Karim and Veizer, 2002; Myers et al., 2010; Yi et al., 2010; Cockerton et al., 2013).
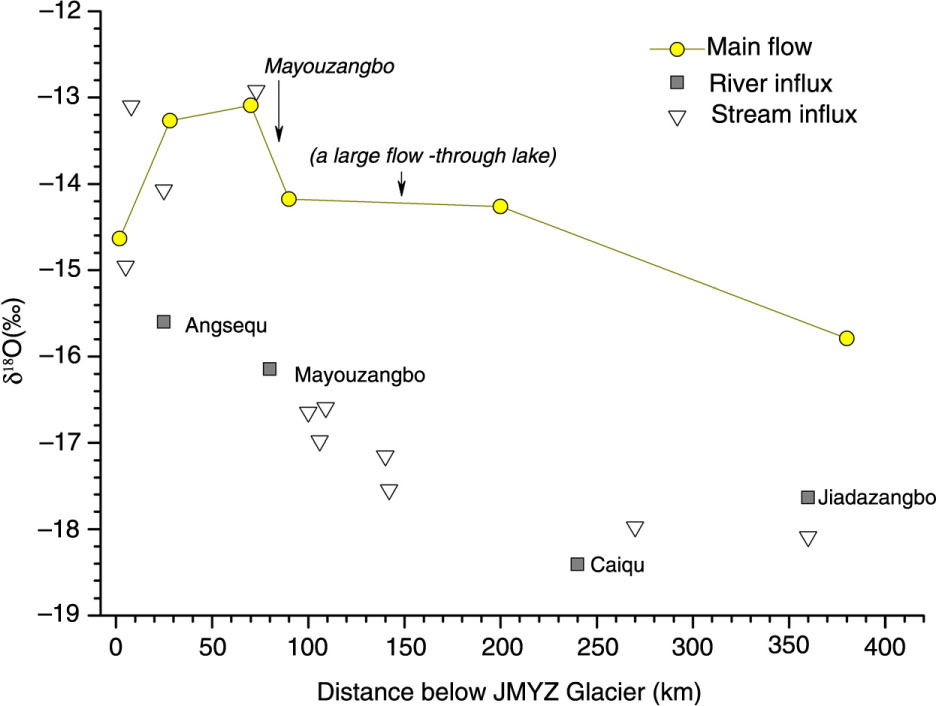
Fig. 4
Main flow (upper Yarlungzangbo) and tributary influx δ18O vs. distance downstream from the JMYZ Glacier (0 km) to Saga (~370 km).
5.3. East–west variability in stable isotopes and implications for moisture sources
The moisture over the TP and the Himalaya is derived from the Indian monsoon, westerlies and local recycling and the relative proportion of each varies spatially and temporally. Previous studies suggest the TP can be generally divided into three domains: westerlies (northern TP), Indian monsoon (southern TP) and transition in between (Tian et al., 2001, 2007; Yao et al., 2013). The monsoonal moisture is predominant in the southern TP and the central/eastern Himalaya in summer, while the westerlies are more important northward and westward, resulting in systematic latitudinal and longitudinal variability in water stable isotopes (Cannon et al., 2014; Tian et al., 2001, 2007; Kurita and Yamada, 2008; Hren et al., 2009; Kumar et al., 2010; Bershaw et al., 2012; Yu et al., 2015). Temporally, moisture source for a given site usually varies seasonally especially in the southern TP and the Himalaya (i.e. the westerlies-derived in winter–spring and the monsoonal in summer) (Tian et al., 2005; Hren et al., 2009; Xu et al., 2011). The ‘isotopic temperature effect’ is typically observed in the northern and northwestern TP, while the ‘isotopic amount effect’ usually occurs in the southern TP. From a geographical and climatological perspective (Araguás-Araguás and Froehlich, 1998; Yao et al., 1999, 2013), the Yarlungzangbo headwater region and its western vicinity likely situate at a transition between the monsoon system in the east and the westerly one in the west. Although long-term precipitation isotopic data for this area is not available yet, a shallow ice core drilled in the Naimonanyi Glacier (6100 m a.s.l., ~80 km west of the JMYZ Glacier, Fig. 1b) reveals high δ18Opp in summer and low δ18Opp in winter–spring and the δ18O values are found to positively correlate with temperatures at Pulan (so-called ‘temperature effect’) (Tian et al., 2012). These are consistent with the isotopic patterns in the northern TP and Tian et al. (2012) thus proposed a postulation that this region is controlled by the westerlies and the monsoonal moisture can reach here only through strong atmospheric activities.
Spatial variability in water stable isotopes on a broad scale usually provides robust evidence on regional change in moisture sources (Tian et al., 2001; Hren et al., 2009; Bershaw et al., 2012). During our survey, river/stream waters from Xigaze (Fig. 1a) westward to Saga were also sampled. As shown in Fig. 5, apparent east–west variation trends of water stable isotopes are shown (data of main flows in the Yarlungzangbo and waters from the western Himalaya are not included). The δ18O demonstrates no longitudinal variability east of near 84 °E longitude but progressively increases farther to the west (from ~−18 ‰ to ~−15 ‰). In contrast, d-excess fluctuations are more abrupt, reflecting disparate hydrological features of individual catchments rather than depicting a smooth regional signal. The d-excess generally stepwise varies in two sections at the division near Saga. From Xigaze westward to Saga, the d-excess maintains low values of ~3 ‰, while those to the west are much higher (mean: 9.7±2.0 ‰). These trends are consistent with those observed by Hren et al. (2009) (i.e. streamwater δ18O and d-excess generally decrease and then increase from east to west in the southern TP, reaching minima near 86 °E longitude) which were attributed to regional changes in moisture sources. Furthermore, the east–west variability in water isotopes likely also occurs in the western Himalaya. The surface snow collected near Pulan (sample 48) has significantly higher δ18O and d-excess (−9.22 ‰ and 18.9 ‰) than that collected on the JMYZ Glacier (samples 49 and 50, mean: −12.11 ‰ and 12.5 ‰). Similarly, streams near Pulan show significantly higher δ18O and d-excess (samples 12–16, mean: −12.10±0.61 ‰ and 16.6±0.8 ‰) than those near the JMYZ Glacier (sample 7 and 8, mean: −14.03 ‰ and 9.5 ‰). Therefore, the Yarlungzangbo headwaters are probably at a critical geographical transition between the east and west.
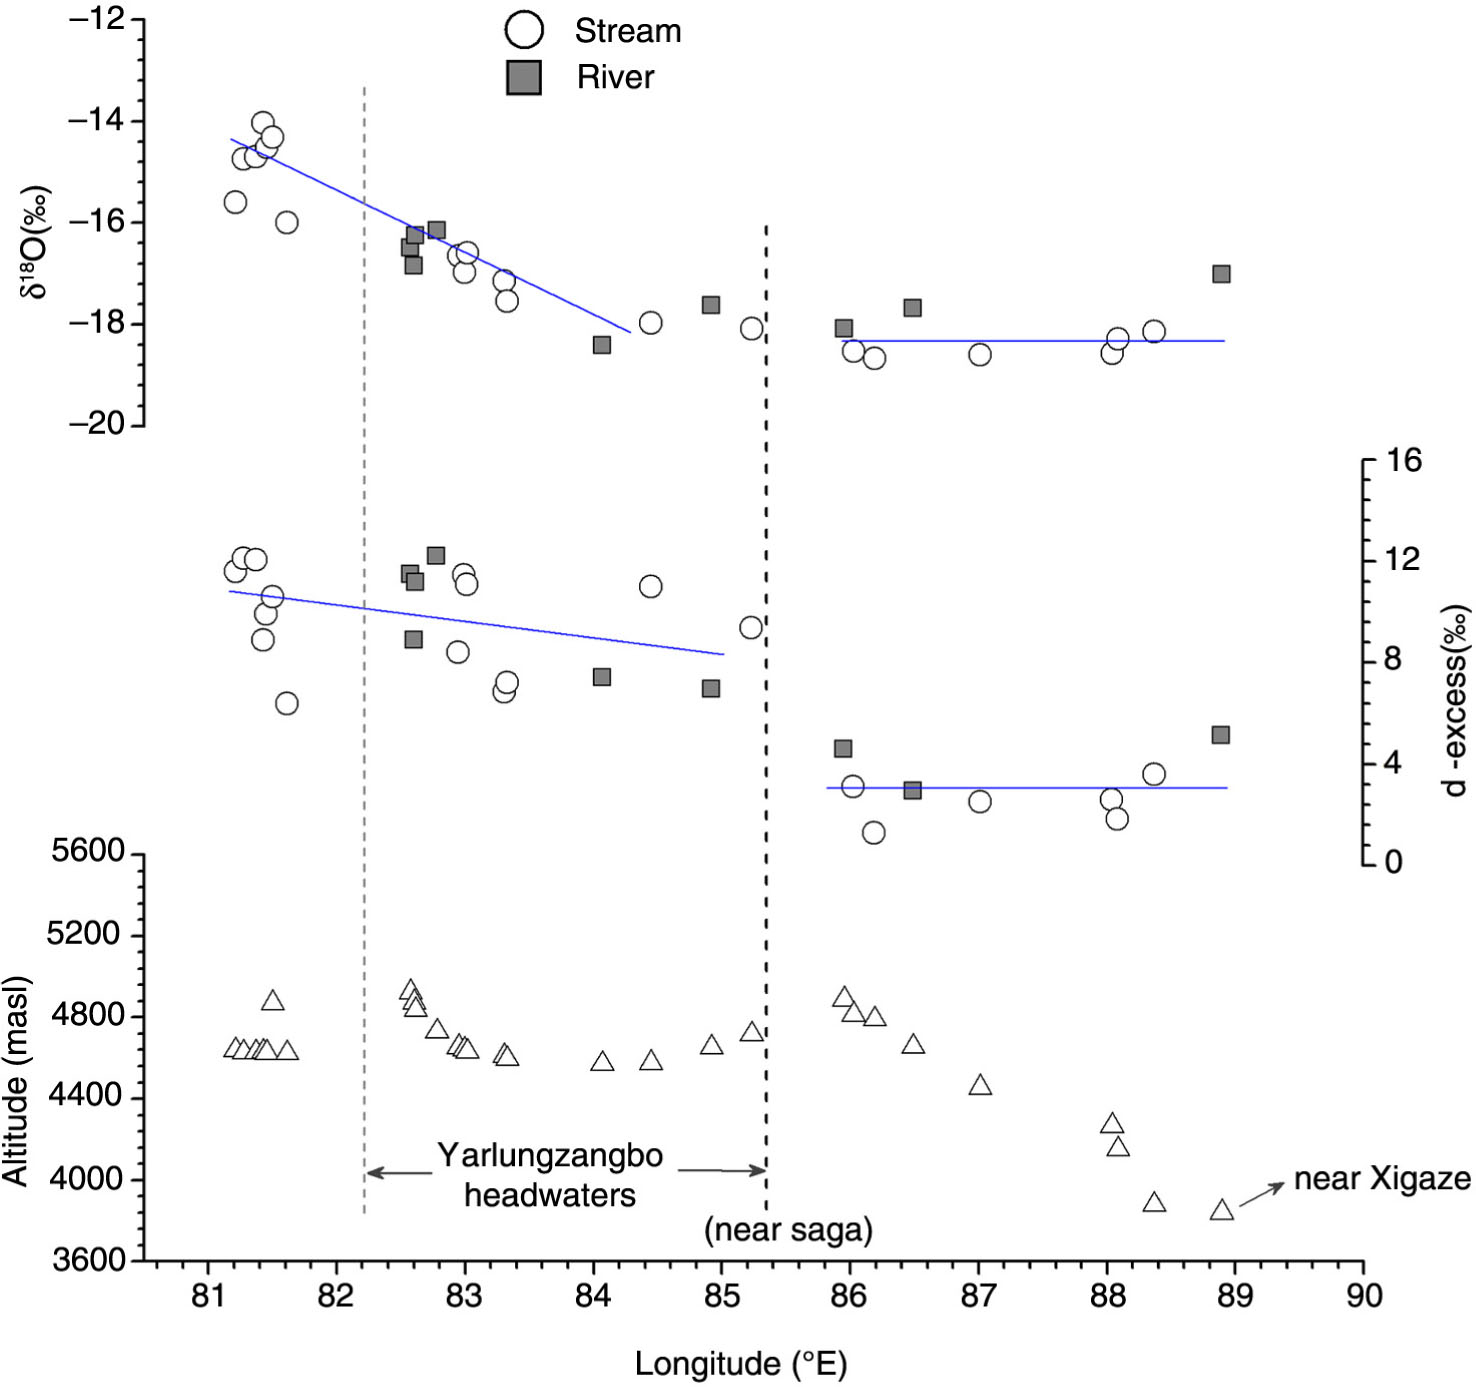
Fig. 5
Plot of river/stream δ18O, d-excess and sampling altitude vs. longitude. These samples do not include main flows in the Yarlungzangbo and waters collected from the western Himalaya. Blue lines represent individual variation trends for each section.
The stable isotopes in river/stream waters are controlled by hydroclimate conditions in the catchment upstream. We examined the relationship between δ18O and mean catchment elevations for water samples to assess the topography influences, but no significant correlation is observed for waters either east or west of Saga. This implies the δ18O pattern in Fig. 5 is controlled by other processes rather than the ‘isotopic altitude effect’. As river/stream integrates different seasonal precipitation over its catchment, surface water isotopes represent varying proportions of different seasonal precipitation and, ultimately, seasonal moisture sources. In the northern slope of the central Himalaya and the southern TP, most (~90%) of the annual precipitation falls in summer (JJAS), the low river/stream δ18O and d-excess values east of Saga in this study are consistent with the fact that the monsoonal moisture predominates surface water recharge in this area of the TP. Monsoonal moisture is transported along the Yarlungzangbo valley from the east and/or through low passes in the central Himalaya (Gao et al., 1985; Kang et al., 2002; Hren et al., 2009; He et al., 2015; Yu et al., 2015). The similarity between the average d-excess (mean: 3.0±1.2 ‰) and the average monsoon precipitation value (~4 ‰ to ~6 ‰) provides compelling support for this notion. Considering the precipitation either derived from summer-time continental/local recycled moisture or winter–spring westerlies in the southern TP and the Himalaya has significantly higher d-excess and δ18O values compared to those of summer monsoon precipitation, the different isotopic trends farther west can be explained by spatial changes in summer-time moisture sources or mixing of different seasonal precipitation in surface runoff. The increases in d-excess and δ18O west of Saga can be caused by increasing contributions of summer-time continental/local recycled moisture vs. monsoonal moisture westward, although it is difficult to identify the ultimate source(s) at this present stage (i.e. local recycled, westerlies or north-derived). In addition, it is also possible that the increasing contributions of winter–spring vs. summer monsoon precipitation in the surface runoff generation westward result in the observed increases in d-excess and δ18O west of Saga, because the winter–spring precipitation increases significantly from the southern TP to the southwestern TP (e.g. ~51% of the annual precipitation falls in the December–May period at Pulan). If the weighted-average d-excess of winter–spring precipitation at Lhasa (~18 ‰) represents the continental (or westerly) value, the d-excess values in the Yarlungzangbo headwaters in Fig. 5 (mean: 9.5±2.0 ‰) are intermediate between the monsoon and continual values. However, the extremely high d-excess of the surface snow and streamwaters near Pulan (sample 51: 18.9 ‰ and samples 12–16: 16.6±0.8 ‰) probably indicate the predominance of the continental recycled moisture in that region. These data thus confirm the geographical transition of the Yarlungzangbo headwaters between the monsoon system in the east and the westerly one in the west.
5.4. Predicted local evaporation line
Isotope mass balance models provide a theoretical framework to simulate and interpret hydroclimate signals (e.g. input, evaporation and their seasonality) in lake/river systems (Gonfiantini, 1986; Gat, 1996; Benson and Paillet, 2002; Jones and Imbers, 2010; Steinman et al., 2010; Gibson et al., 2016). Surface waters submitted to evaporation would deviate from the GMWL and plot in a linear cluster with a lower slope than 8. The extent of heavy-isotope enrichment in residual liquid phase during evaporation and the slope of the local evaporation line (LEL) are primarily controlled by local atmospheric conditions (e.g. temperature, relative humidity and isotopes in ambient atmospheric moisture) (Craig and Gordon, 1965; Gat, 1996; Gibson, 2002, 2016; Wolfe et al., 2007). The predicted LEL can be defined using an isotope mass balance model and can be potentially used to assess the connectivity of various water bodies and changes in input. As illustrated in Fig. 6a, the predicted LEL is defined by three key parameters (Appendix A) including δp, the isotopic composition in local annual mean precipitation; δss, the isotopic composition in a special hydrological case (i.e. evaporation=inflow, E=I) for a closed basin with input isotopic composition of δp; and δ*, the theoretical limiting isotopic composition in a desiccating water body under average thaw season conditions. The displacement of waters away from this line usually represents different input water compositions, and the water distribution in relation to three key parameters actually reflects individual water balance of their basins. Here, we establish the predicted LEL for the Yarlungzangbo source region and its western vicinity to provide a primary baseline of local isotopic hydroclimate.
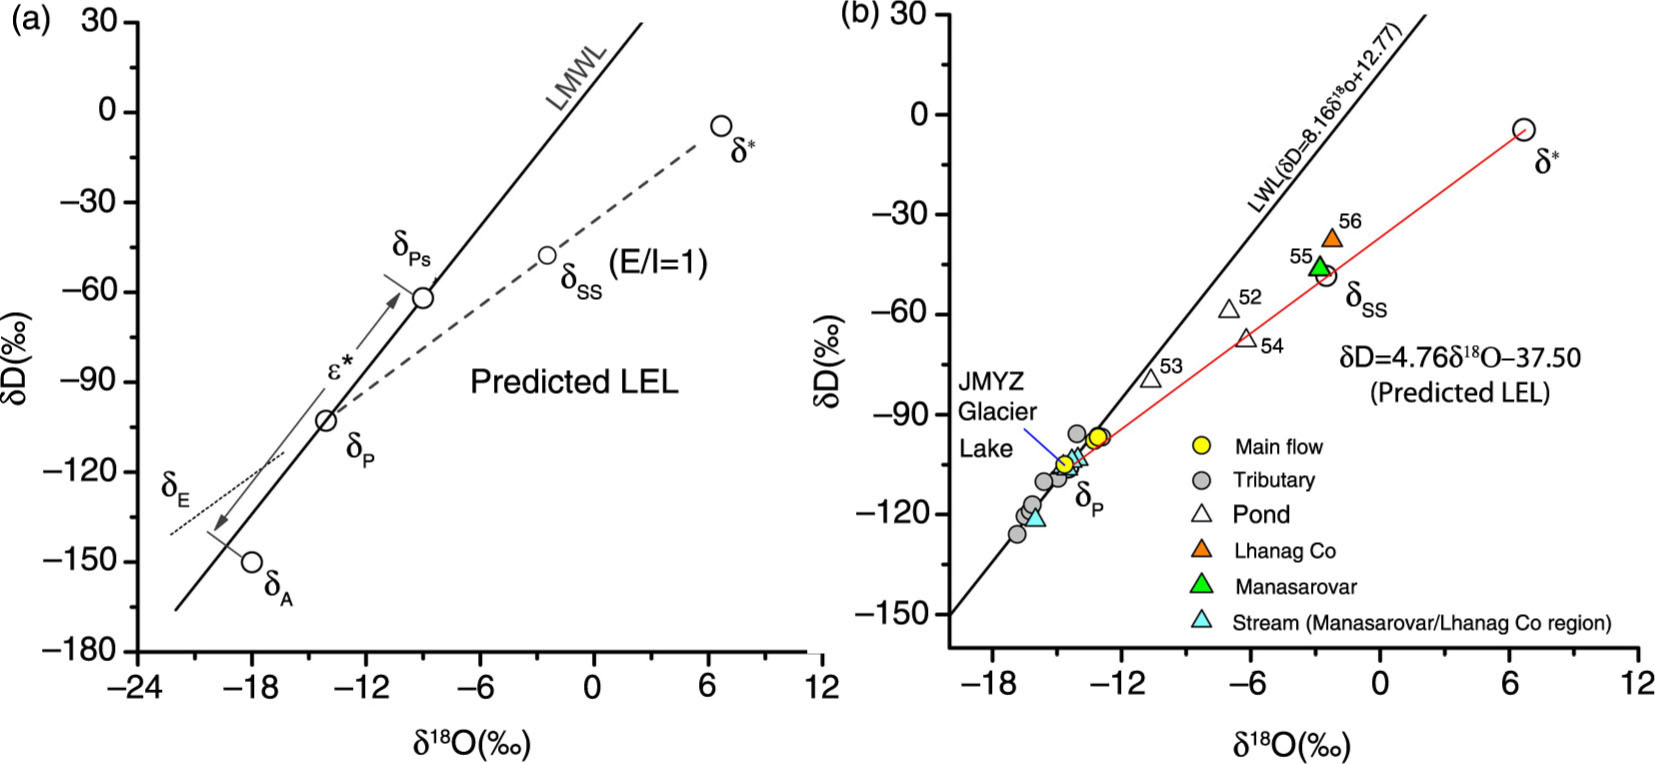
Fig. 6
(a) Schematic representation of the buildup of the predicted LEL relative to LMWL (local meteoric water line) for a given region. δps is the isotopic composition in precipitation in average thaw season. δA is the average isotopic composition in evaporative-flux-weighted atmospheric moisture and is assumed to be in approximate isotopic equilibrium with δps. δss is the isotopic composition in a terminal (closed-drainage) basin fed by annual mean precipitation with an isotopic value of δp in a steady state (evaporation=inflow, E=I). δ* represents the theoretical limiting isotopic composition attainable for water bodies under average evaporative conditions in summer (Appendix A). (b) Isotopic compositions in various waters from the Yarlungzangbo source region (above the confluence with the Mayouzangbo) and the Manasarovar/Lhanag Co region in relation to the LWL and the predicted LEL.
By using existing meteorological data for Pulan, water isotopic data in this study and geographically based δ18Opp model for the TP and other areas of China (Liu et al., 2008a), the predicted LEL is defined as δD=4.76δ18O – 37.50 (Fig. 6b, Appendix B). Waters from the Manasarovar and Lhanag Co (two large inland lakes with areas of ~400 km2 and ~300 km2 respectively) should be excellent monitors of long-term average isotopic hydroclimate conditions in the vicinity of the Yarlungzangbo source region. The predicted LEL is in good agreement with the empirical LEL for the Manasarovar: δD=4.71δ18O – 34.03 (Yao et al., 2009). It is obvious waters from these two lakes plot in a region close to δss, consistent with the occurrence of generally steady-state net evaporation (E=I) for these two lakes. Therefore, the used information for the predicted LEL provides a reasonable assessment of regional average isotopic hydroclimate to a large extent. It should be noted that the LELs for individual waters somewhat rely on the input water compositions which can vary considerably in a broad region. Displacement above (or below) the LEL indicates more isotopically enriched (or depleted) input submitted to individual hydroclimate conditions (e.g. precipitation seasonality, runoff generation and evaporation). As shown in Fig. 6b, the majority of river/stream waters from the Yarlungzangbo source region and the Manasarovar/Lhanag Co region plot close to δp, reflecting a close input isotopic composition of δp and minimal evaporation. Those waters significantly falling below the line (e.g. waters from the Mayouzangbo) are accordingly fed by more isotopically depleted source waters relative to δp in isotopic composition. In contrast, three pond waters are localised in a region between δp and δss, thus indicating the importance of evaporation and the hydrological cases of E<I in their catchments.
6. Conclusion
This study presents δ18O and δD data of various types of waters in the Yarlungzangbo headwater region and its vicinity of the southwestern TP. In the upper Yarlungzangbo system, a generally downstream (or eastward in terms of the flowing direction) decrease in main flow δ18O is shown due to the progressive dilution of more isotopically depleted tributary influx. The evaporation on river/stream waters is minimal, despite a semiarid climate, due to the fast flow and cold temperatures. On the regional scale (from the middle Yarlungzangbo basin to the Manasarovar/Lhanag Co region), the river/stream δ18O and d-excess both show increases westward, consistent with the increasing contributions of summer-time continental/local recycled vs. monsoonal moisture or winter–spring vs. summer monsoon precipitation in the runoff generation westward in this part of the TP. Data suggest the Yarlungzangbo headwaters are at a transition between the westerly system in the west and the monsoon one in the east, while the Pulan region of the western Himalaya is controlled by continental recycled moisture (regardless of ultimate sources). At last, a predicted LEL is proposed for the Yarlungzangbo source region and its vicinity, which would help to determine the relationships between local hydroclimate and water stable isotopes. Further investigation into long-term variability in precipitation and surface water isotopes in this region will better refine the hydroclimate interpretations.
7. Acknowledgements
We thank Wei Yang and Dong Cai for their help in field work and we are also grateful to Dongmei Qu for her assistance in analysis of water samples in the laboratory. Two anonymous reviewers are thanked for their constructive comments to improve our manuscript. This study was supported by the National Nature Science Foundation of China (no. 41190081) and the Fundamental Research Funds for the Central Universities (no. XDJK2015C006, SWU114058).
Appendices
8. Appendix
8.1. Appendix A: Isotope mass balance theory
The water mass balance for a terminal or closed-drainage basin can be quantified in terms of an evaporative-to-inflow ratio (E/I) via isotope mass balance theory using oxygen or hydrogen isotopic data, as described by:
where δI is the average isotopic composition in input, δW is the isotopic composition in surface water, and δE is the isotopic composition in the evaporative flux (Gibson and Edwards, 2002). δE can be estimated using the Craig–Gordon equation (Craig and Gordon, 1965; Gat et al., 1994; Machavaram and Krishnamurthy, 1995; Gibson et al., 2016):
where δW is the isotopic composition in surface water, δA is the isotopic composition in atmospheric moisture, h is the average relative humidity, ɛ is a combination of both equilibrium (ɛ*) and kinetic (ɛK) enrichment factors (ɛ=ɛ*+ɛK). The equilibrium enrichment factor [ɛ*=(1-α)·1000] is dependent on the fractionation factor (α) and consequently on temperatures. α can be calculated as (Majoube, 1971; Friedman and O'Neil, 1977; Criss, 1999):
where T represents surface temperature in K. The kinetic enrichment factors are evaluated as (Gonfiantini, 1986; Araguás-Araguás et al., 2000):
Substitute eq. (A2) into eq. (A1) then yield:
and
where δ* is the limiting isotopic composition attainable under local hydroclimate settings.
8.2. Appendix B: Calculation of the predicted LEL for the Yarlungzangbo headwater region and its vicinity
The predicted LEL for the JMYZ Glacier area and its western vicinity is determined by existing metrological and isotopic data. Calculation equations were elaborated in Appendix A. Detailed processes are given below:
The evaporative-flux-weighted (summer) isotopic composition in precipitation (δPs) is estimated to be −12.1 ‰ for δ18O and −84.4 ‰ for δD (average values of two surface snow samples obtained from the JMYZ Glacier).
Evaporative-flux-weighted temperature T and relative humidity h are average values during the summer (June to September) at Pulan: T=12.5°C and h=57%.
The isotopic composition in atmospheric moisture δA is assumed to be in isotopic equilibrium with δPs (δA=δPs − ɛ*), yielding −22.7 ‰ for δ18O and −178.8 ‰ for δD.
Using the eq. (A8), the limiting isotopic enrichment δ* is 6.7 ‰ for δ18O and −4.6 ‰ for δD.
The annual average precipitation δP in this area is estimated using the geographically based model of precipitation δ18O for China (Liu et al., 2008a). Since this model (δ18O=−0.0073 Lat2+0.3261 Lat – 0.0015 Alt – 9.777) is derived from a dataset including ice core and precipitation isotopic data across the Tibetan Plateau, it provides a receivable assessment of average isotopic composition in precipitation in this study area. Accordingly, δP is −14.5 ‰ for δ18O and −105.6 ‰ for δD using the LWL (δD=8.16δ18O+12.77), where the mean altitude and latitude are ~5200 m a.s.l. and ~30.3 °Nbased on the 90 m resolution digital elevation model (DEM).
The predicted LEL is defined as δD=4.76δ18O − 37.50.
Calculation of δSS (E/I=1 for a terminal or closed basin) through eqs. (A7) and (A8) yields −2.5 ‰ for δ18O and −48.4 ‰ for δD (by using the predicted LEL).