
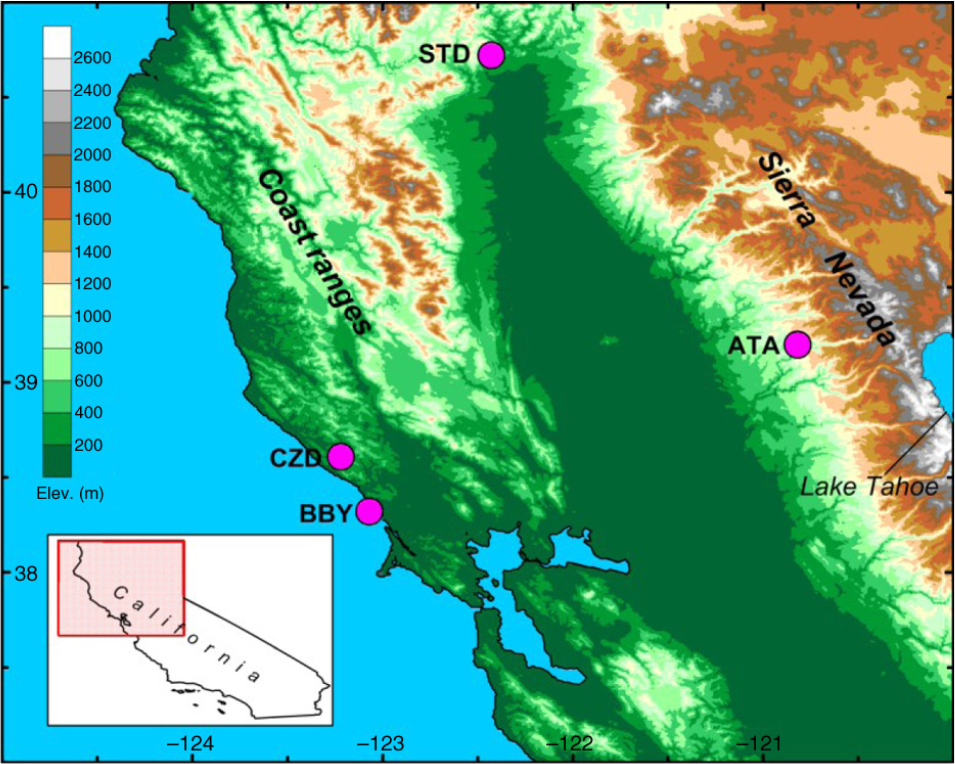
Fig. 1
Location of data collection sites in this investigation.
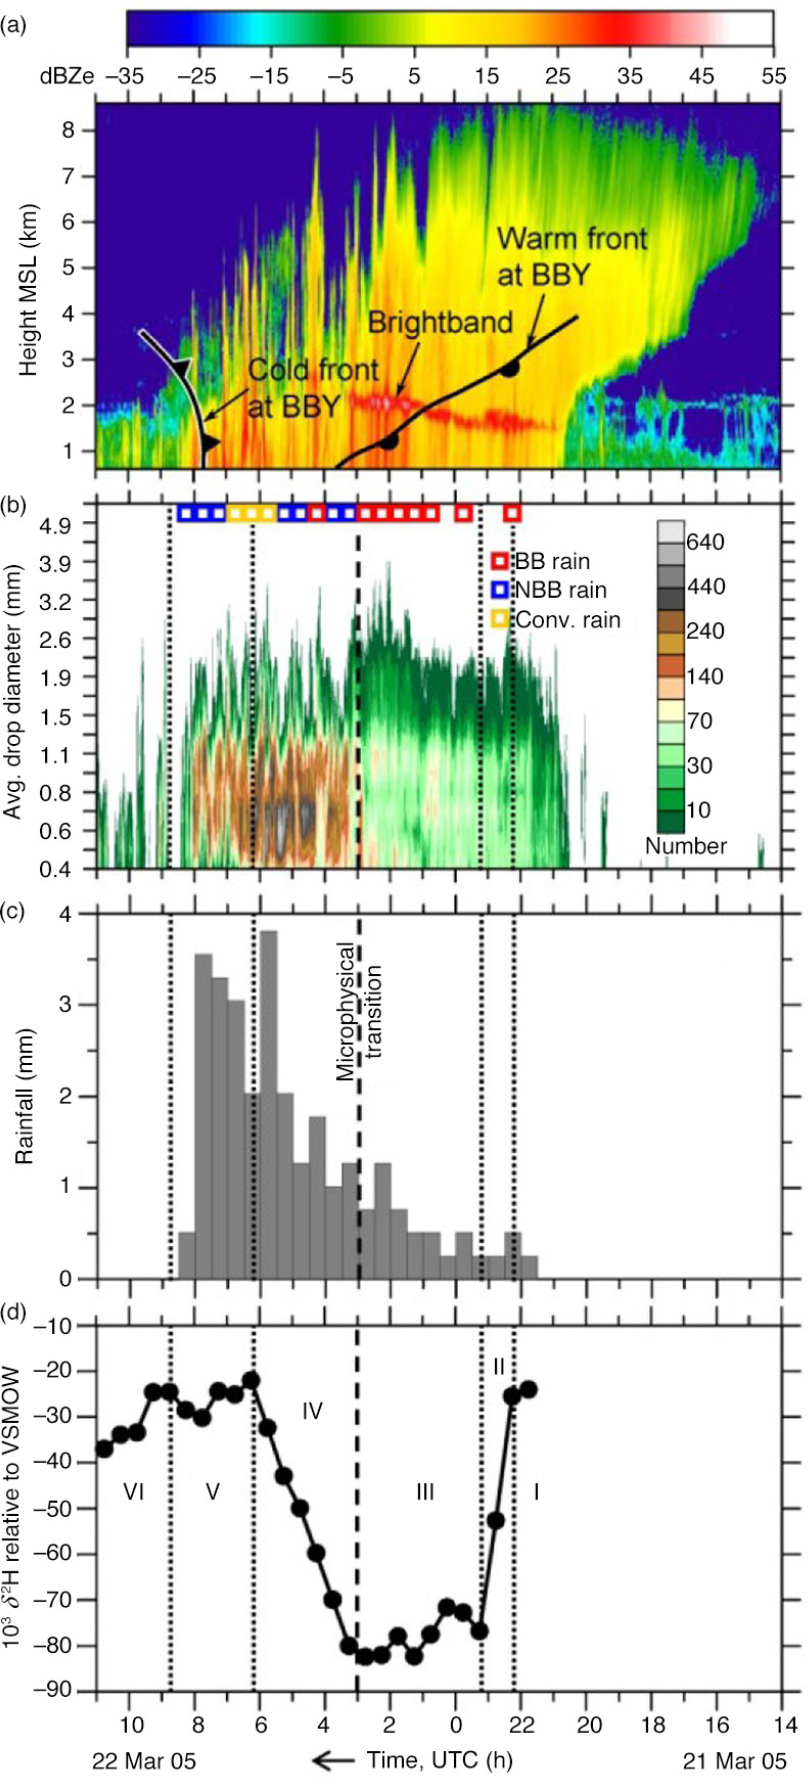
Fig. 2
Observations at Cazadero, CA (CZD) on 21–22 March 2005 (from Coplen et al., 2008). Time increases from right to left. (a) Time–height section of equivalent radar reflectivity factor (dBZe; see colour scale). (b) Contoured drop-size distributions of rainfall at the surface as a function of time and diameter (see colour scale). Open squares indicate objective categorisation of the rainfall occurring during selected half-hour periods; BB (red), rain with a radar brightband signature; NBB (blue), rain without a radar brightband signature; Conv. (yellow), convection rain. (c) Histogram of hourly rainfall (mm). (d) Time series of stable hydrogen isotopic composition of 30-min, time-integrated precipitation samples. A primary change in precipitation microphysical properties is marked by the vertical dashed lines in Fig. 2b–d. Zones of distinct isotope behaviour are enclosed by the vertical lines and labelled with Roman numerals in (d): I, pre-cold frontal precipitation of marine air; II, transitional mixing of I and III; III, precipitation from deep, cold cloud layer via the seeder–feeder mechanism; IV, transitional mixing between III and V; V, shallow, locally generated orographic rain; VI, light rainfall with passage of cold front.
Table 1. Sample collection sites in California
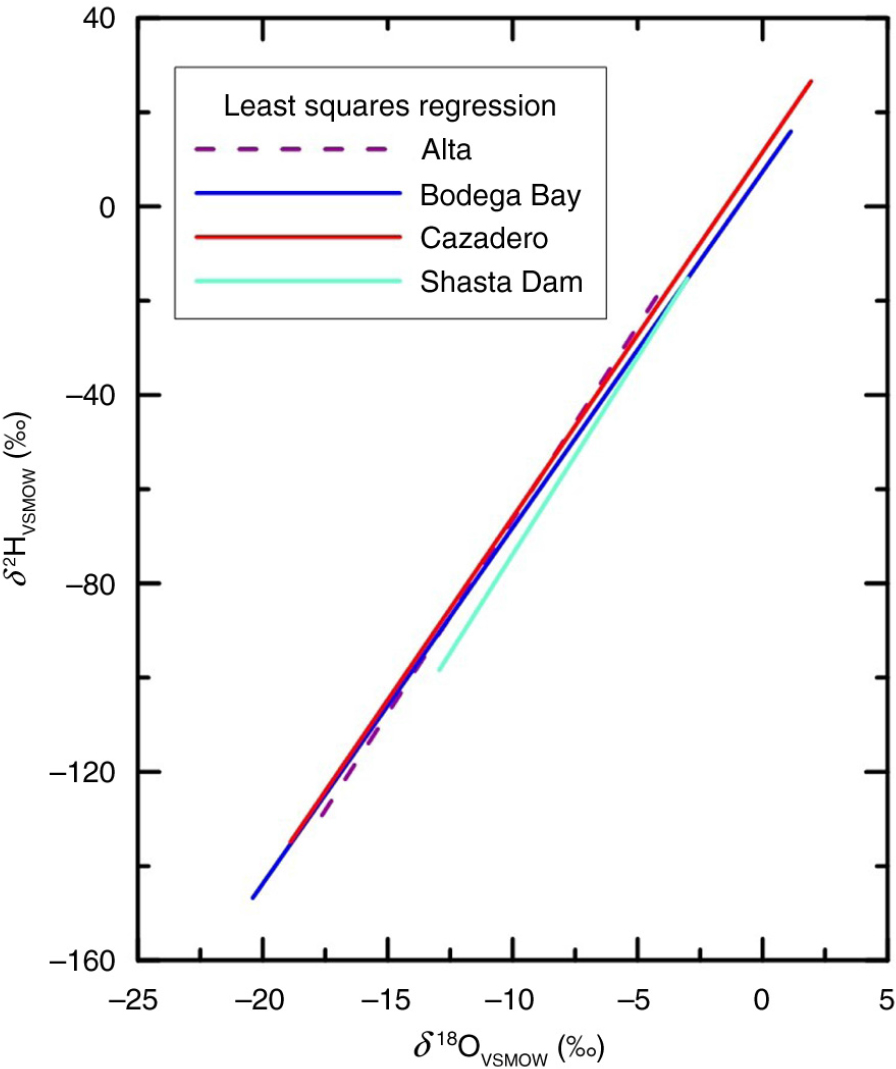
Fig. 3
Crossplot of δ 2HVSMOW and δ 18OVSMOW measurements from the four sites in this study.
Table 2. Decreases and increases in δ 2HVSMOW of precipitation in this study
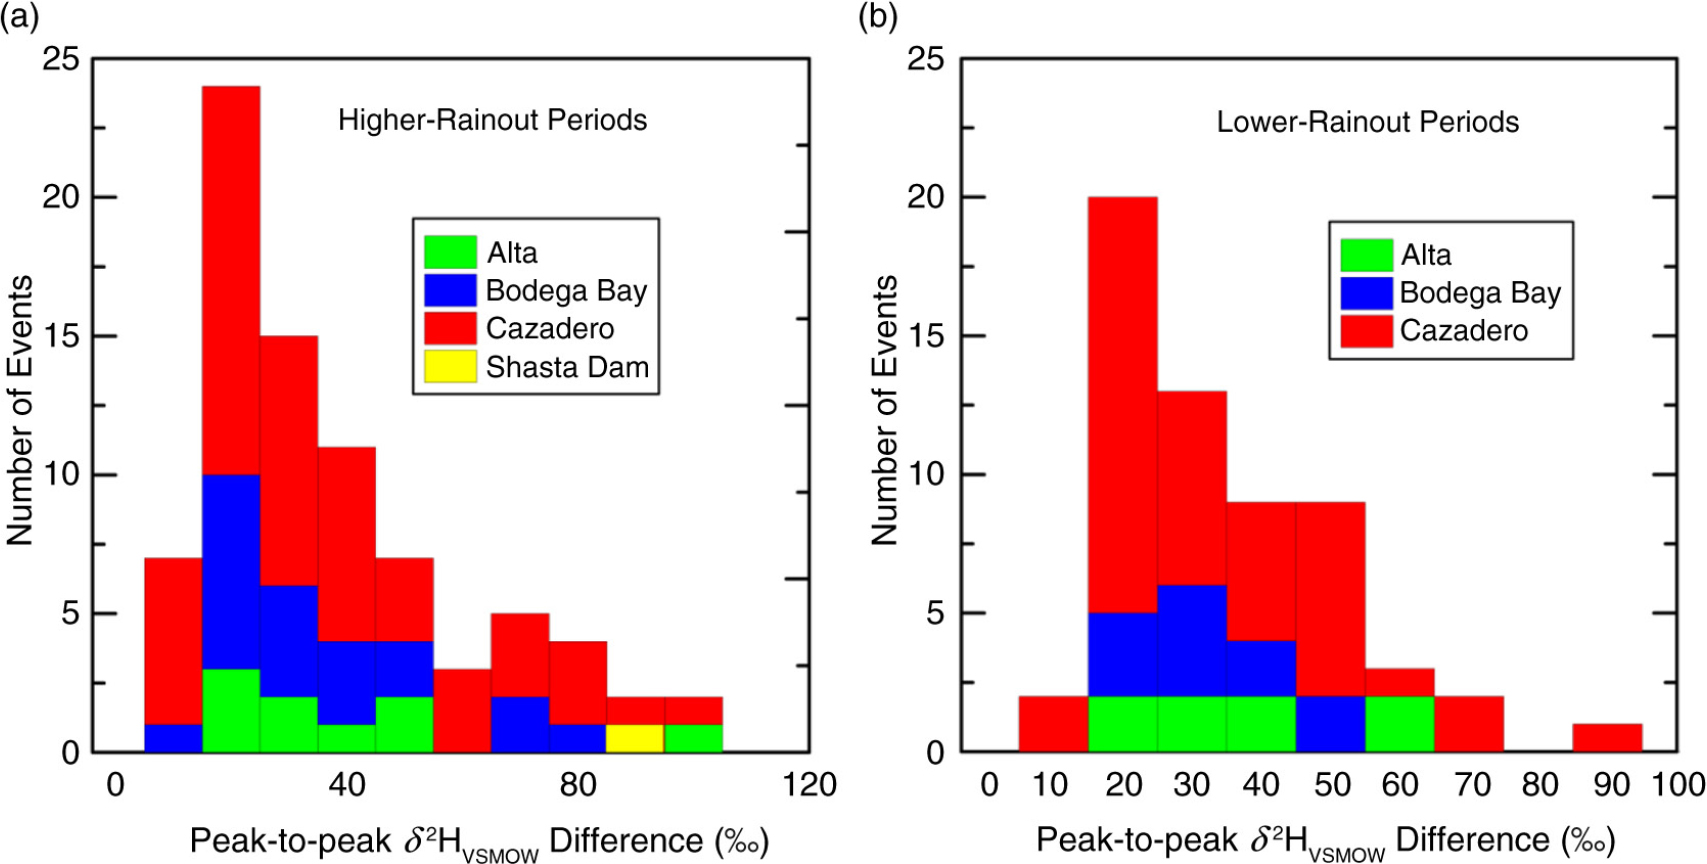
Fig. 4
Histograms of peak-to-peak δ 2HVSMOW differences for sites in this study: (a) peak-to-peak δ 2HVSMOW differences for higher rainout periods and (b) peak-to-peak δ 2HVSMOW differences for lower rainout periods. Data are from Table 2.
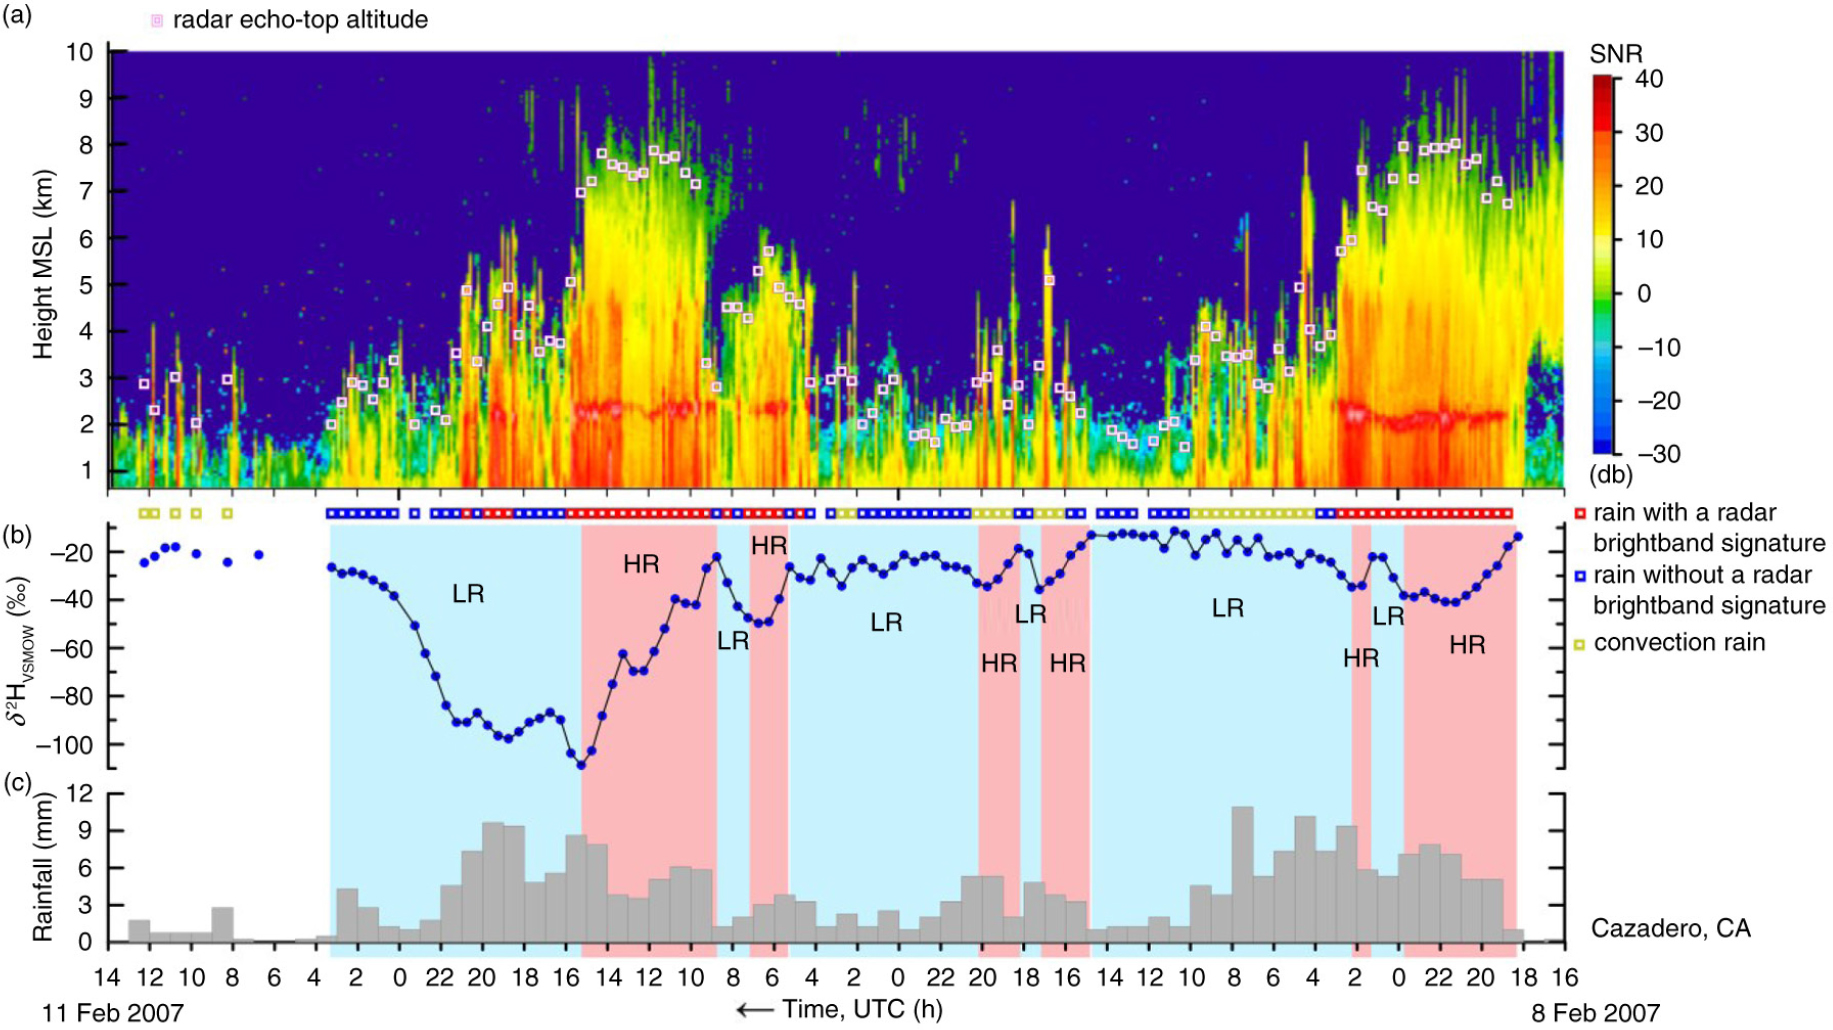
Fig. 5
(a) Time-height section of equivalent radar reflectivity factor with signal-to-noise ratio (SNR), (b) time series of δ 2HVSMOW values of 30-min, time-integrated precipitation samples and (c) histogram of hourly rainfall at Cazadero, CA, collected between 16 UTC 8 February 2007 and 14 UTC 11 February 2007. Open magenta squares indicate echo-top height. HR, pink panels, higher rainout, decreasing or low δ 2HVSMOW values. LR, blue panels, lower rainout, increasing or high δ 2HVSMOW values. Open red, blue, and yellow-gold squares indicate objective categorisation of rainfall occurring during selected half-hour periods. Time increases from right to left.
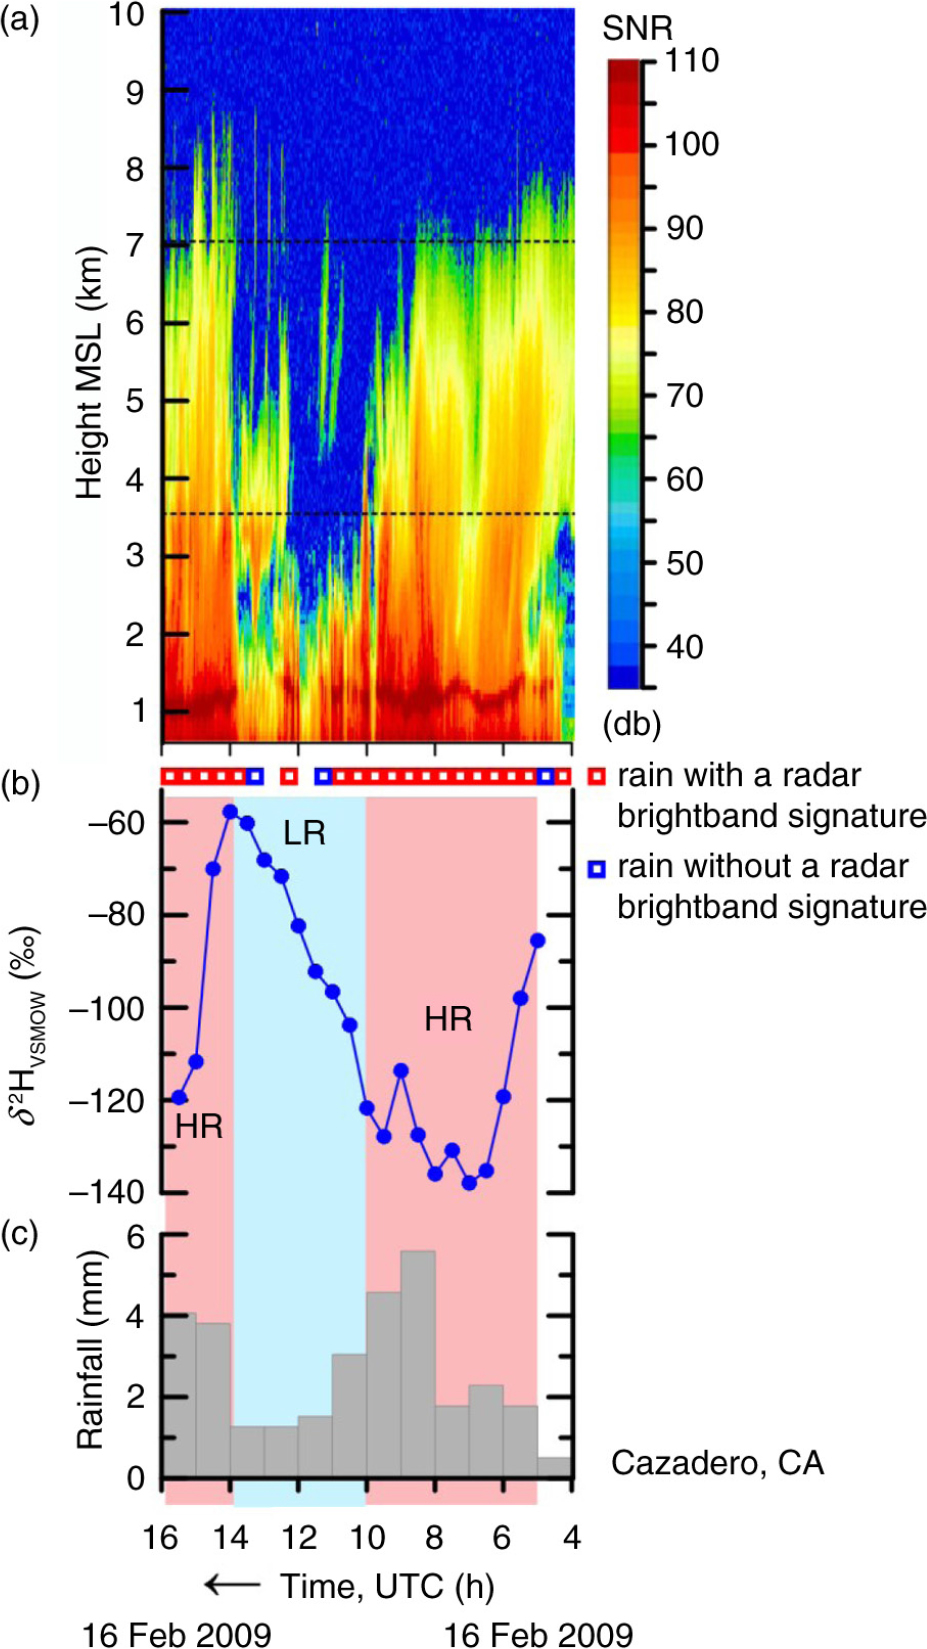
Fig. 6
(a) Time-height section of equivalent radar reflectivity factor with signal-to-noise ratio (SNR), (b) time series of δ 2HVSMOW values of 30-min, time-integrated precipitation samples, and (c) histogram of hourly rainfall at Cazadero, CA, collected between 4 and 16 UTC 16 February 2009. HR, pink panels, higher rainout, decreasing or low δ 2HVSMOW values. LR, blue panel, lower rainout, increasing or high δ 2HVSMOW values. Open squares indicate objective categorisation of the rainfall occurring during selected half-hour periods. Dashed horizontal lines are KMUX NEXRAD 0.5-degree beam. Time increases from right to left.
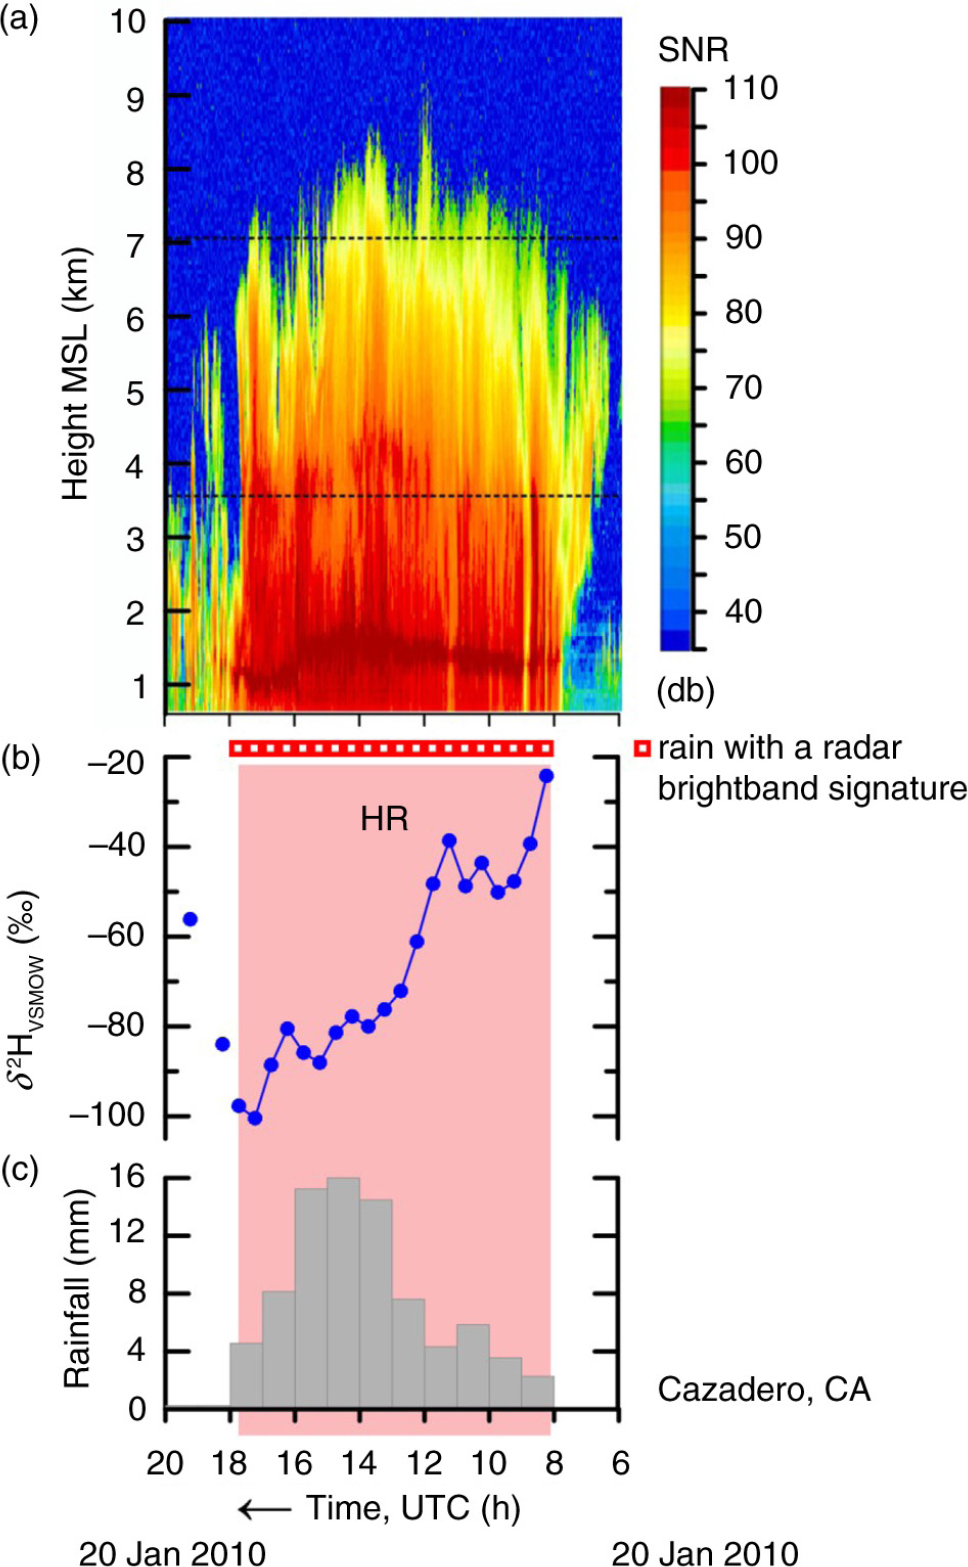
Fig. 7
(a) Time-height section of equivalent radar reflectivity factor with signal-to-noise ratio (SNR), (b) time series of δ 2HVSMOW values of 30-min, time-integrated precipitation samples and (c) histogram of hourly rainfall at Cazadero, CA, collected between 6 and 20 UTC 20 January 2010. HR, pink panel, higher rainout, decreasing or low δ 2HVSMOW values. Open squares indicate objective categorisation of the rainfall occurring during selected half-hour periods. Dashed horizontal lines are KMUX NEXRAD 0.5-degree beam. Time increases from right to left.
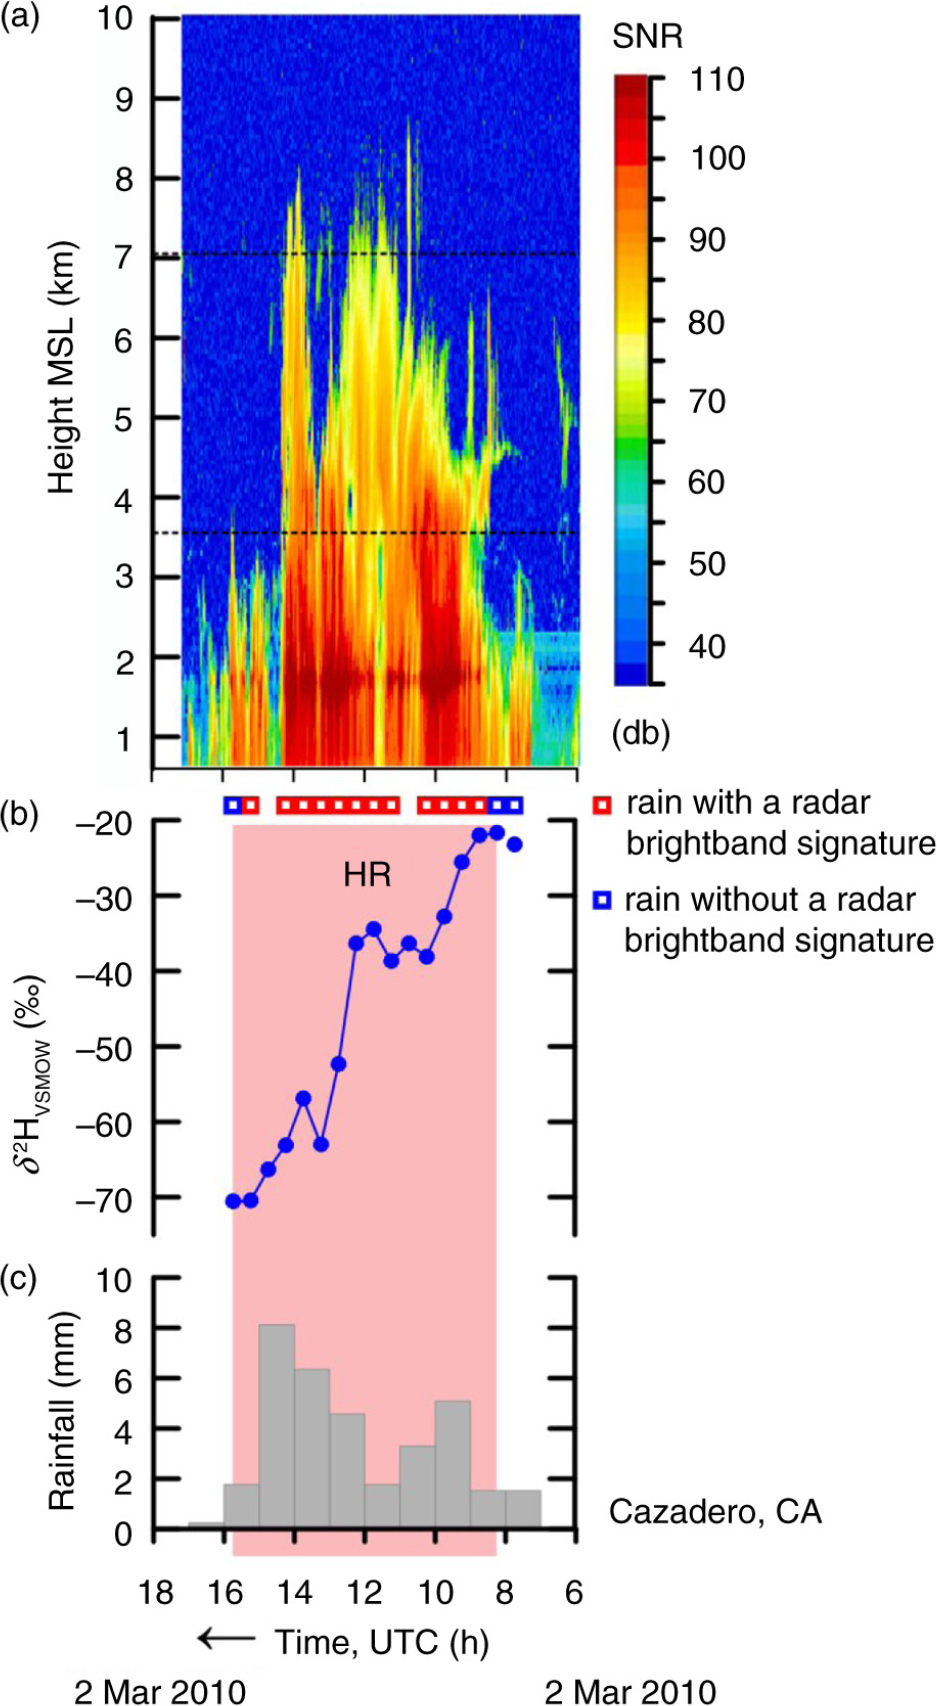
Fig. 8
(a) Time-height section of equivalent radar reflectivity factor with signal-to-noise ratio (SNR), (b) time series of δ 2HVSMOW values of 30-min, time-integrated precipitation samples and (c) histogram of hourly rainfall at Cazadero, CA, collected between 6 and 18 UTC 2 March 2010. HR, pink panel, higher rainout, decreasing or low δ 2HVSMOW values. Open squares indicate objective categorisation of the rainfall occurring during selected half-hour periods. Dashed horizontal lines are KMUX NEXRAD 0.5-degree beam. Time increases from right to left.
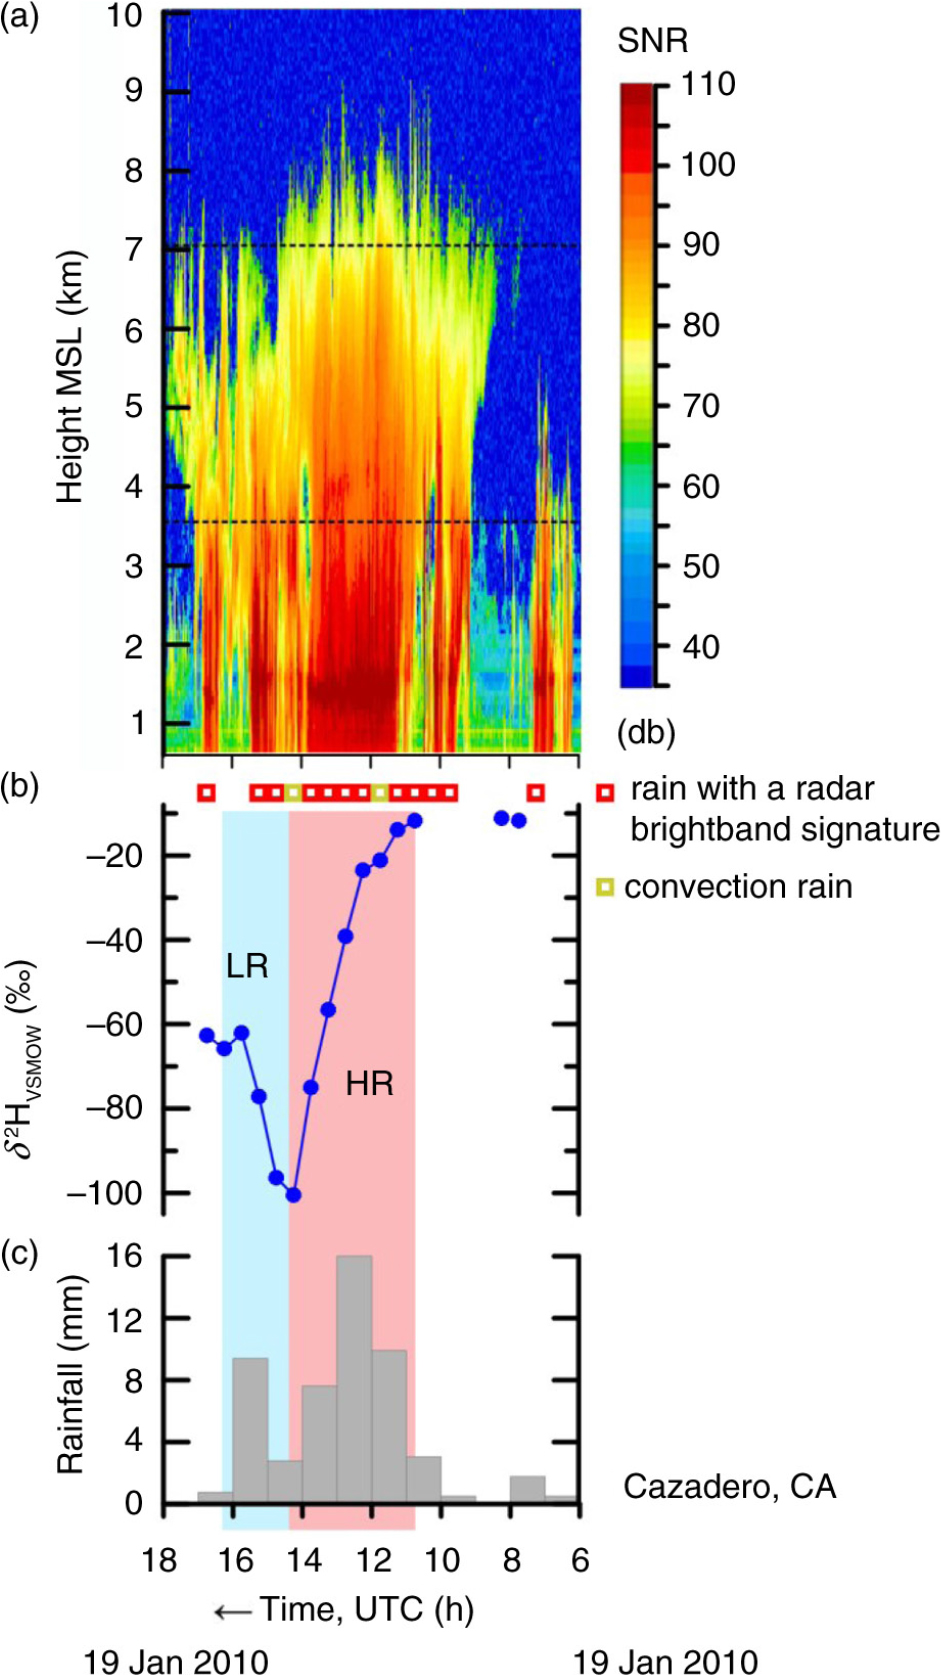
Fig. 9
(a) Time-height section of equivalent radar reflectivity factor with signal-to-noise ratio (SNR), (b) time series of δ 2HVSMOW values of 30-min, time-integrated precipitation samples and (c) histogram of hourly rainfall at Cazadero, CA, collected between 6 and 18 UTC 19 January 2010. HR, pink panel, higher rainout, decreasing or low δ 2HVSMOW values. LR, blue panel, lower rainout, increasing δ 2HVSMOW values. Open squares indicate objective categorisation of the rainfall occurring during selected half-hour periods. Dashed horizontal lines are KMUX NEXRAD 0.5-degree beam. Time increases from right to left.
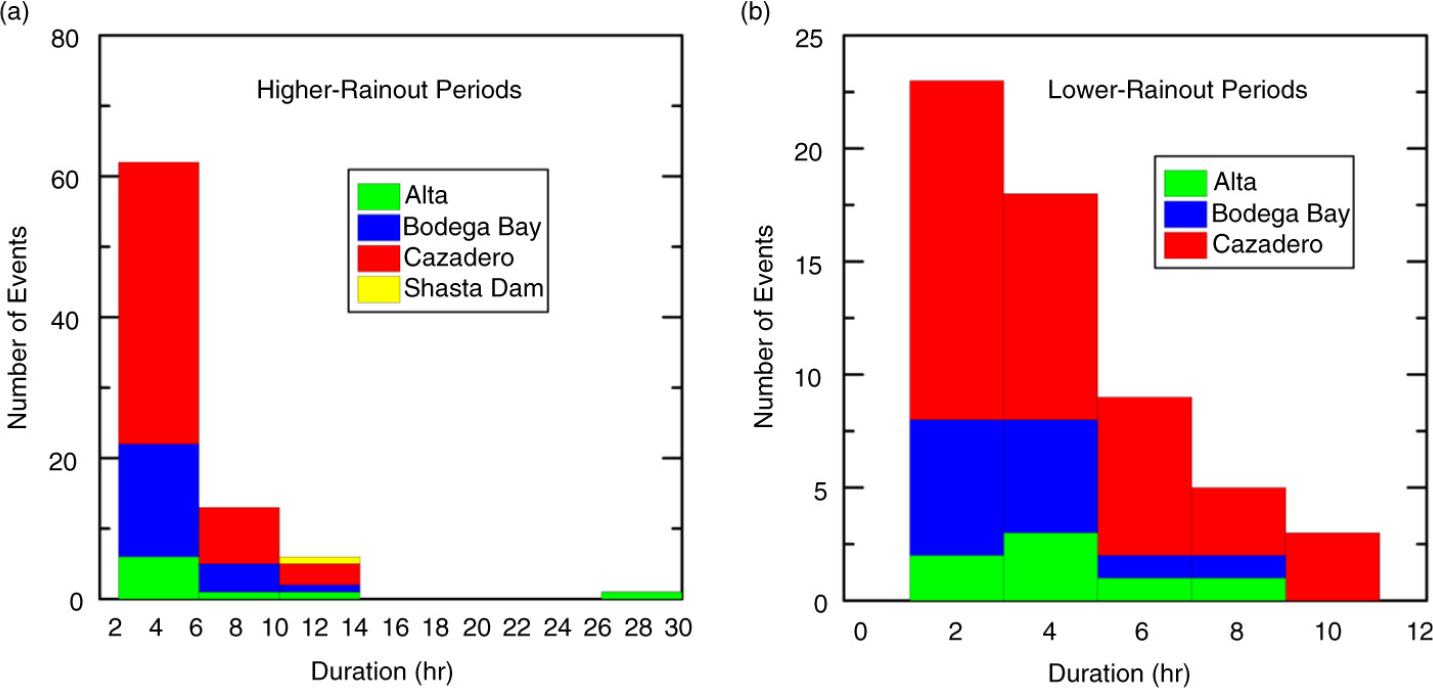
Fig. 10
Histograms of duration of rainout periods in this study. (a) Durations for higher rainout periods and (b) durations for lower rainout periods. Data are from Table 2.
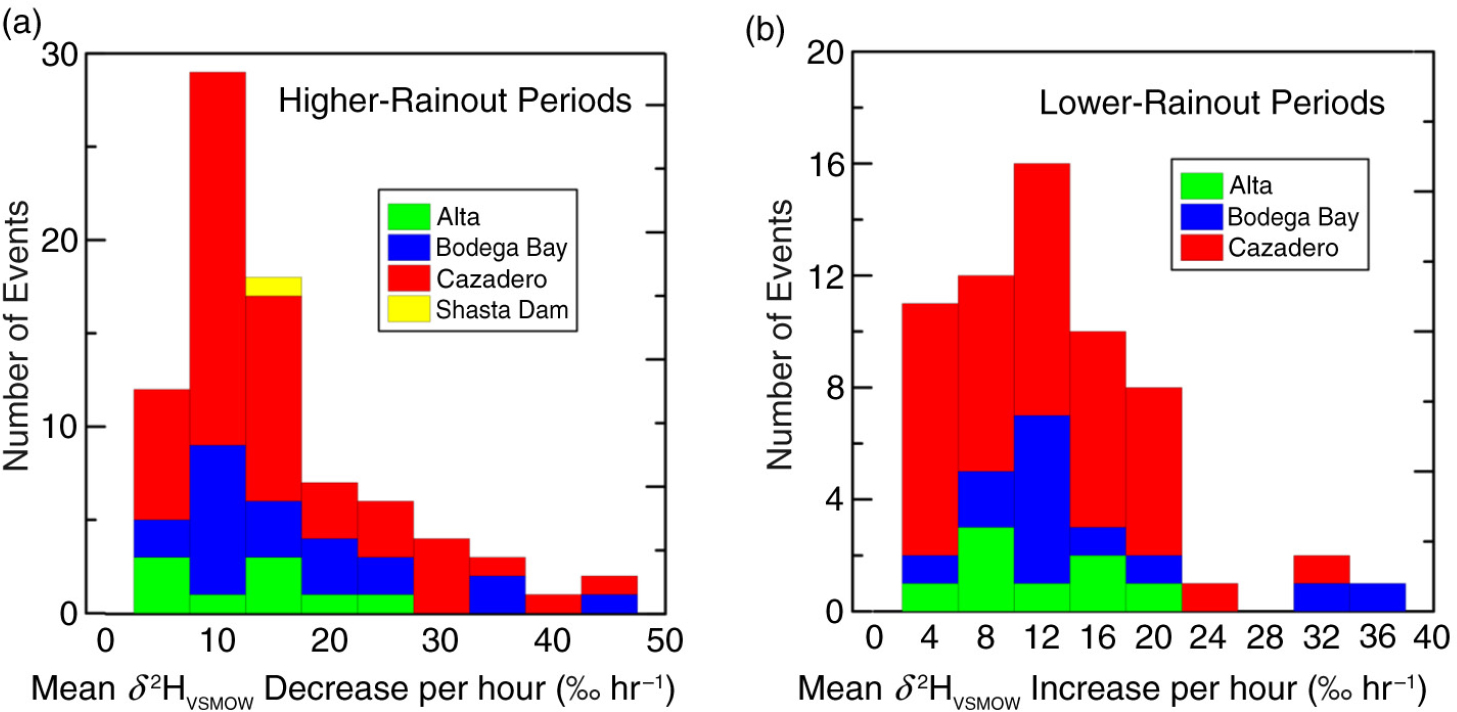
Fig. 11
Histograms of change in δ 2HVSMOW differences with time for sites in this study. (a) Peak-to-peak decreases in δ 2HVSMOW values with time for higher rainout periods and (b) peak-to-peak increases in δ 2HVSMOW values with time for lower rainout periods. Data are from Table 2.
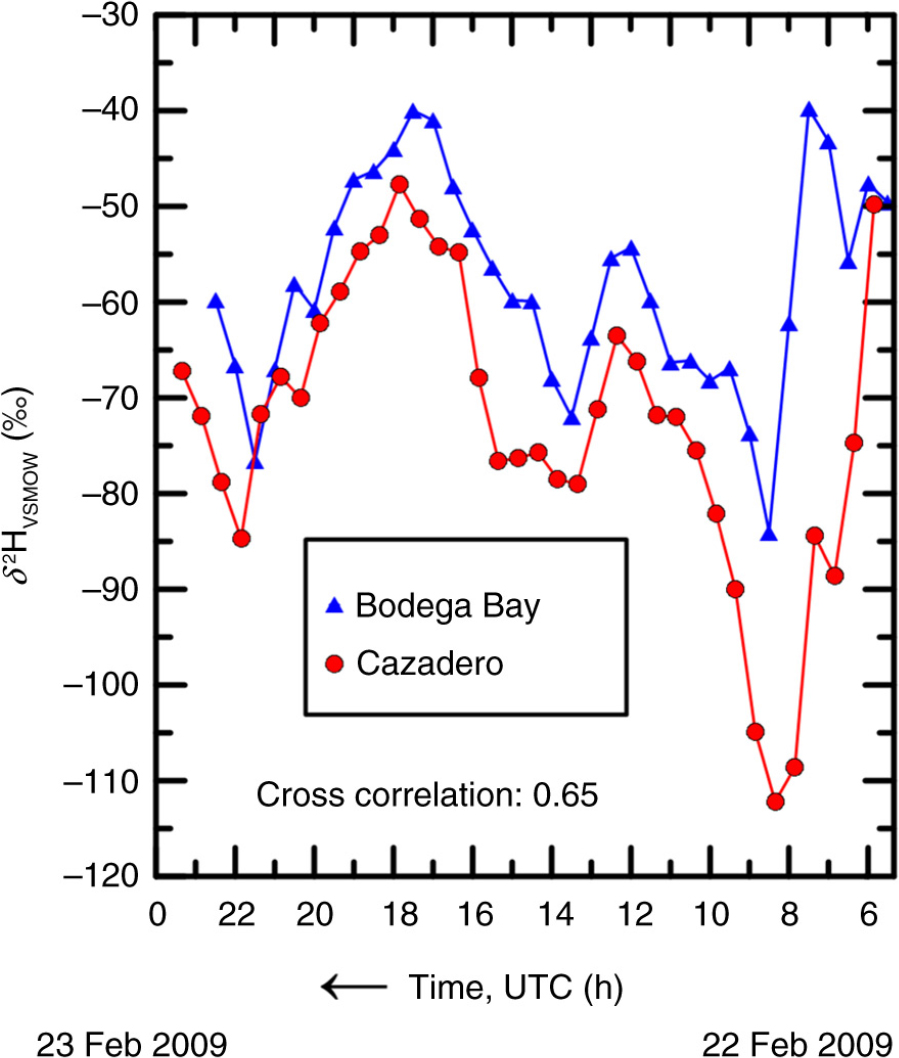
Fig. 12
Comparison of δ 2HVSMOW of Bodega Bay and Cazadero, CA, precipitation between 6 UTC 22 February 2009 and 0 UTC 23 February 2009. Time increases from right to left. The time of each CZD sample has been decreased by 9 min to account for travel time of the air mass from Bodega Bay to Cazadero.
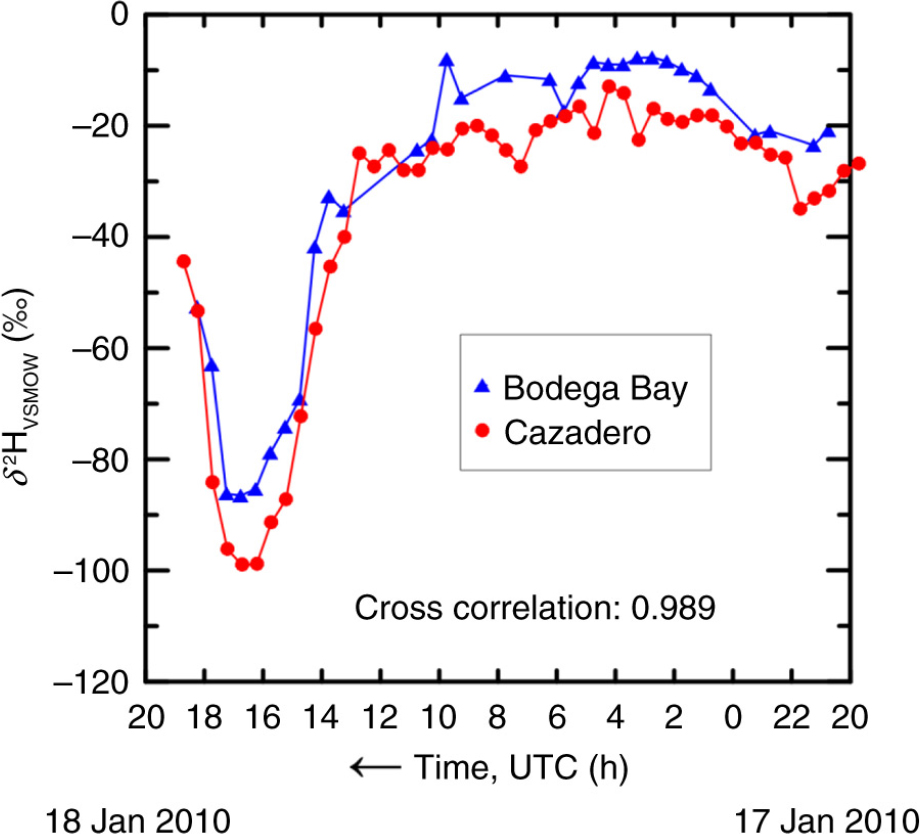
Fig. 13
Comparison of δ 2HVSMOW of Bodega Bay and Cazadero,CA, precipitation between 20 UTC 17 January 2010 and 20 UTC 18 January 2010. Time increases from right to left. The collection time of each CZD sample has been decreased by 32 min to account for travel time of the air mass from Bodega Bay to Cazadero.
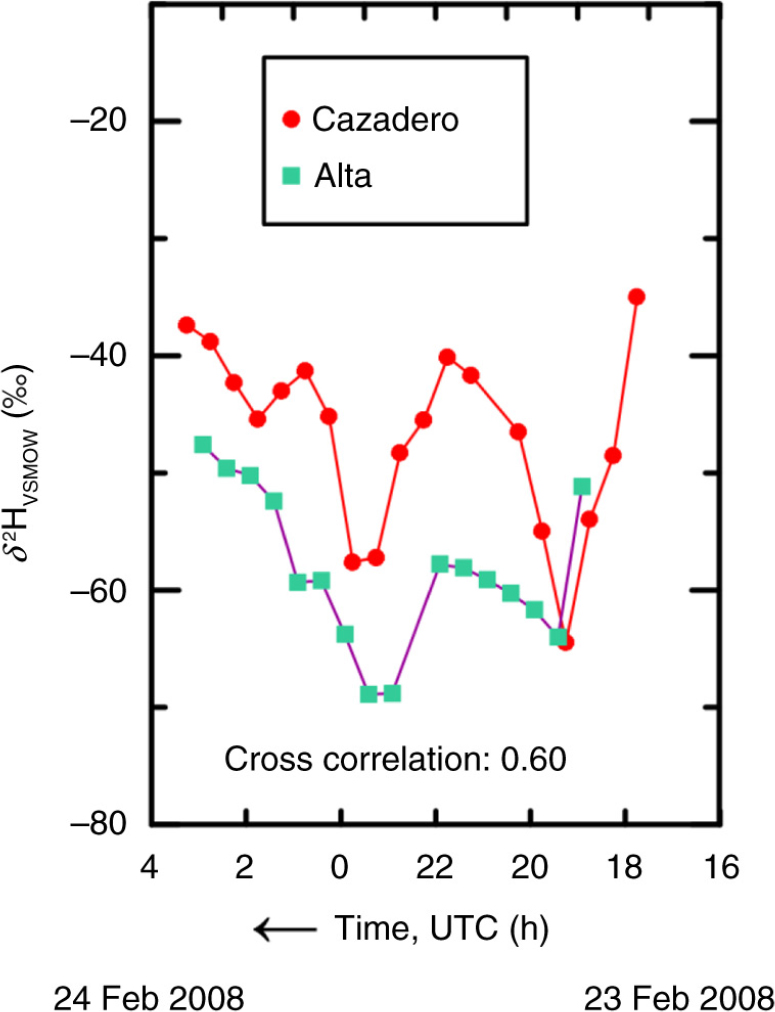
Fig. 14
Comparison of δ 2HVSMOW of Cazadero and Alta, CA, precipitation between 16 UTC 23 February 2008 and 8 UTC 24 February 2008. Time increases from right to left. The collection time of each Alta sample has been decreased by 200 min to account for travel time of the air mass from Cazadero to Alta.
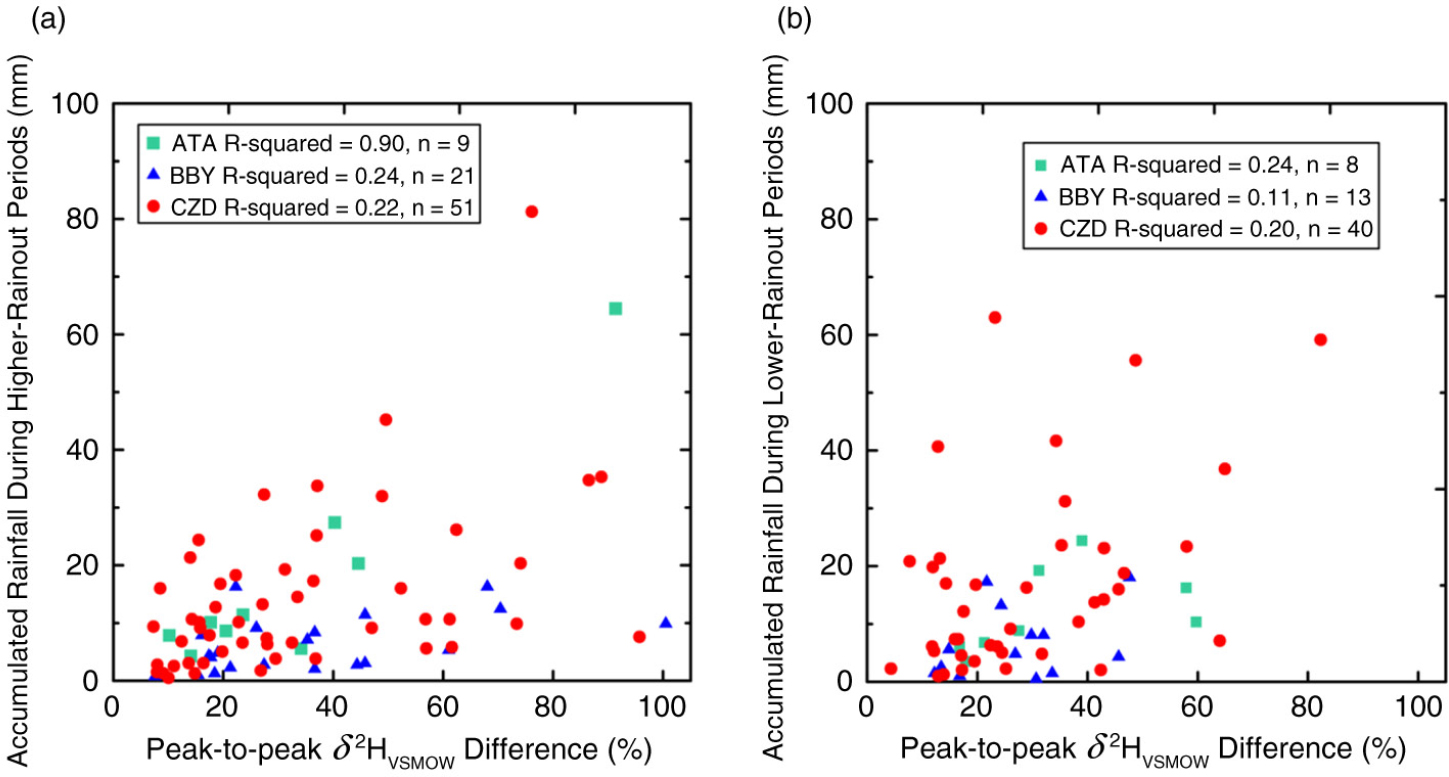
Fig. 15
Comparison of accumulated rainfall at Alta (ATA), Bodega Bay (BBY) and Cazadero (CZD) with peak-to-peak δ 2HVSMOW differences. (a) During higher rainout periods and (b) during lower rainout periods. Data are from Table 2.
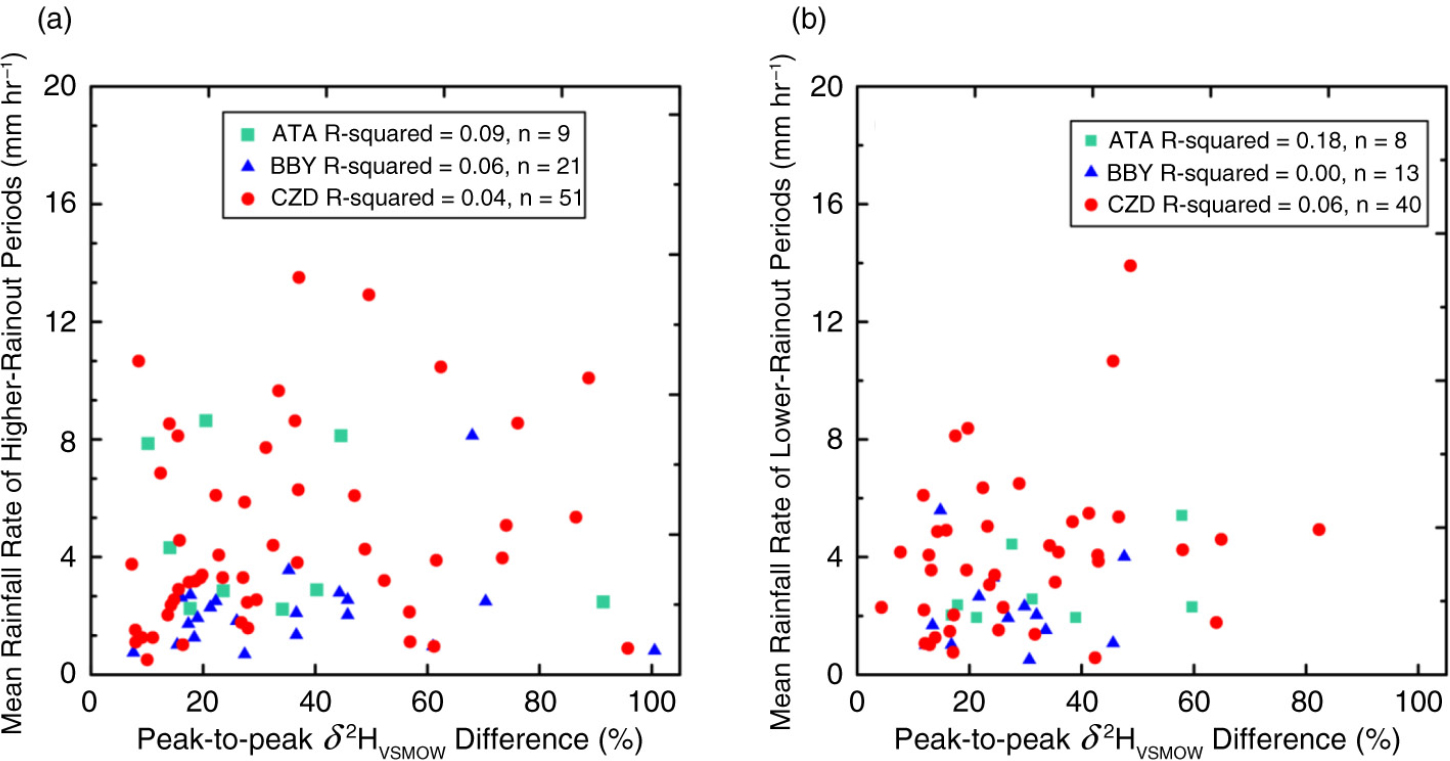
Fig. 16
Comparison of mean rainfall rate at Alta (ATA), Bodega Bay (BBY) and Cazadero (CZD) with peak-to-peak δ 2HVSMOW differences. (a) During higher rainout periods and (b) during lower rainout periods. Data are from Table 2.
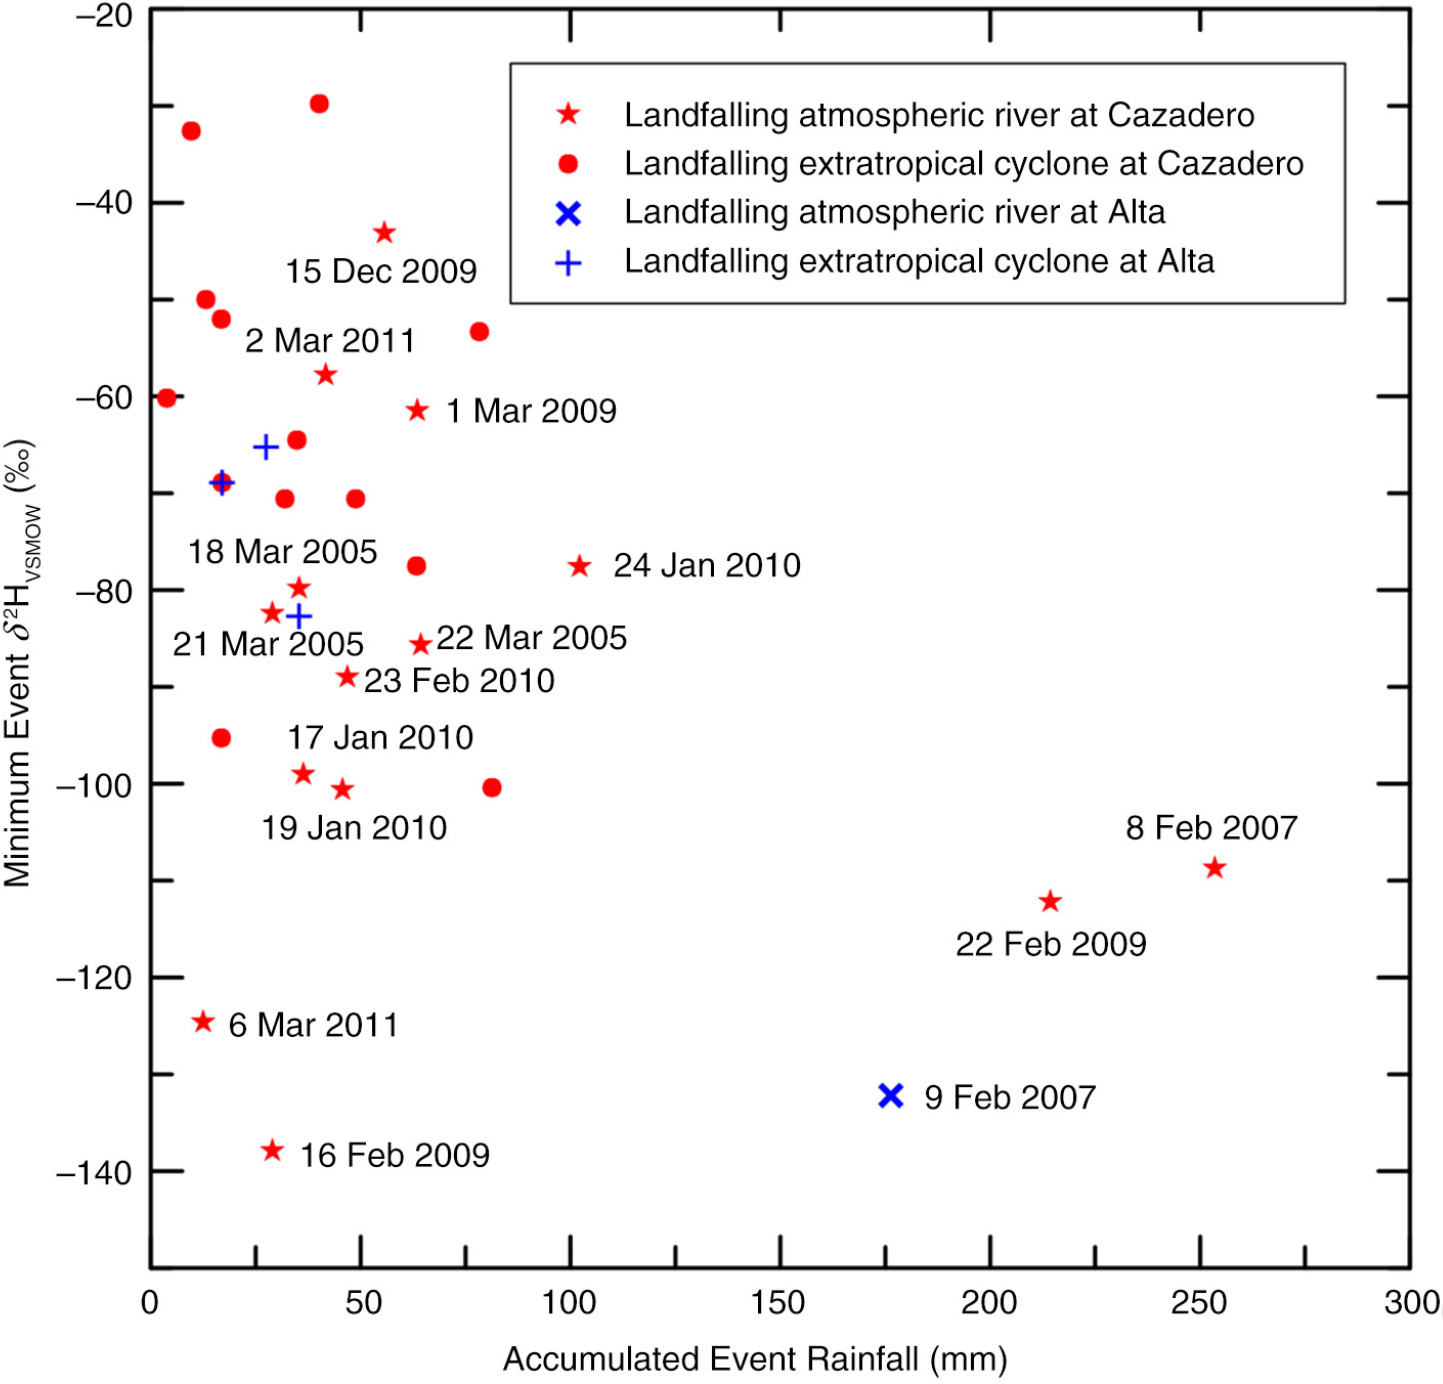
Fig. 17
Accumulated-event rainfall versus minimum δ 2HVSMOW values of rainfall of 27 CZD and 4 ATA events in this study. Landfalling atmospheric rivers are long, narrow plumes of integrated water vapour with core values >~2 cm that impacted the California coast (Neiman et al., 2008; Dettinger et al., 2011; Ralph et al., 2013a).
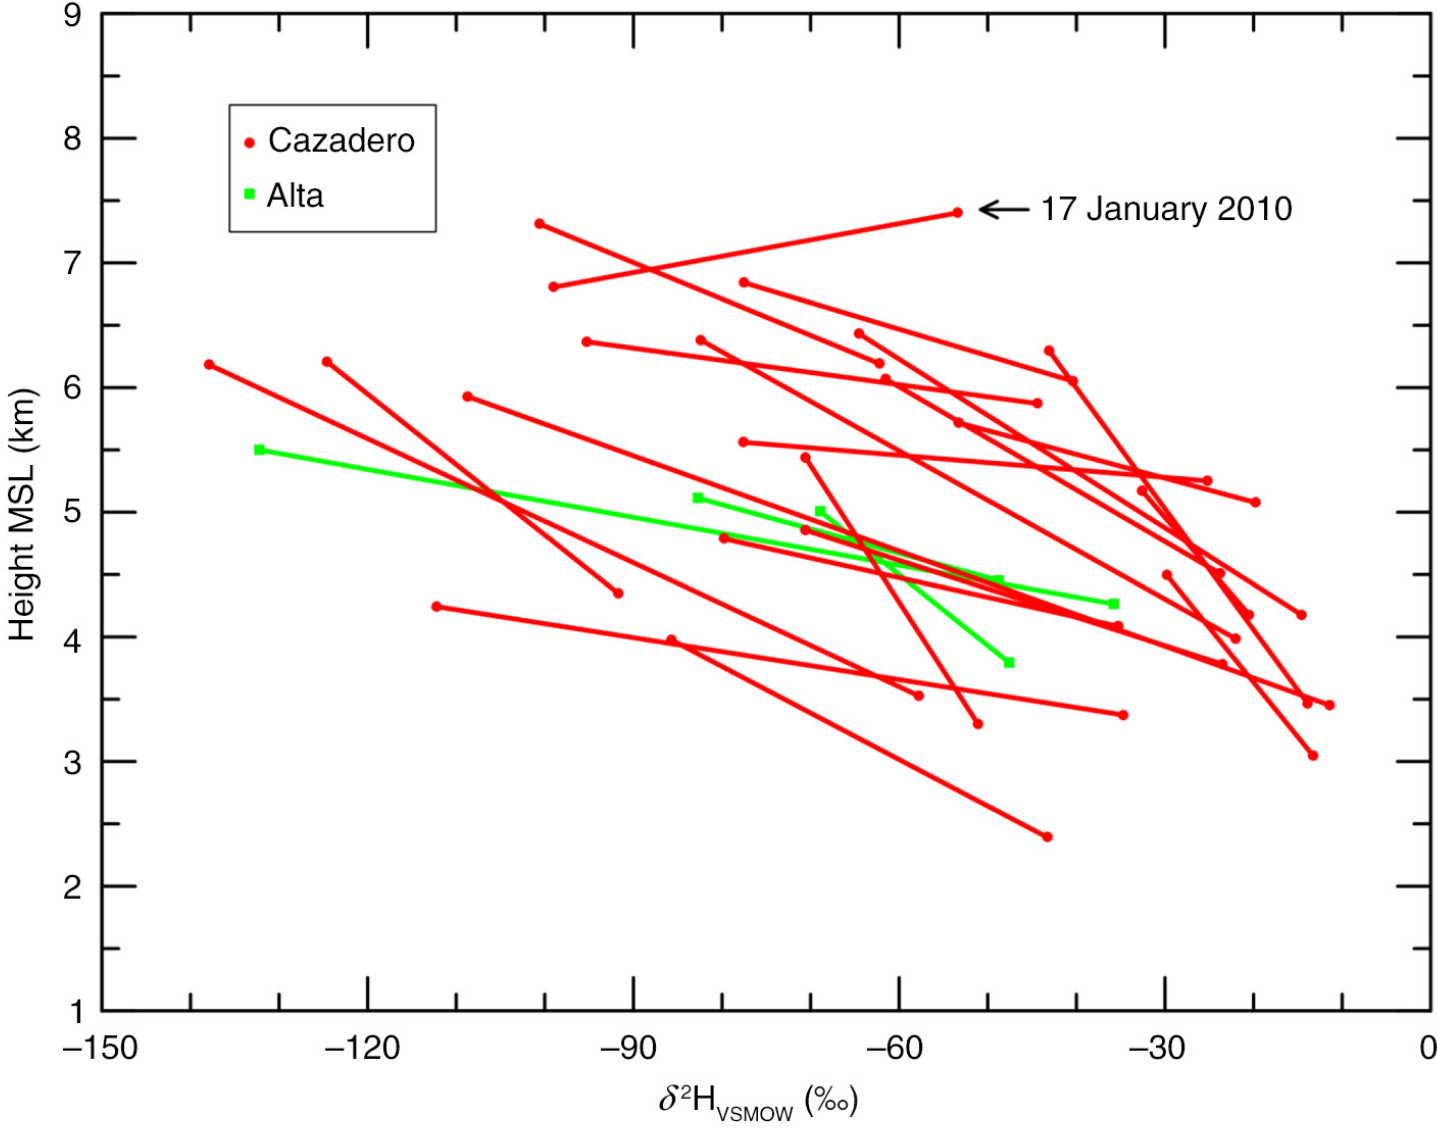
Fig. 18
Mean echo-top height of HR and LR periods versus maximum δ 2HVSMOW of rainfall for each LR period and minimum δ 2HVSMOW values of rainfall for each HR period for 21 Cazadero and 2 Alta events having echo-top data. The mean echo-top height of the HR period of the Cazadero 17 January 2010 event (Fig. A15) is lower than that of its LR period.
Table 3. Count of objective categorisation of rainfall for events having radar brightband signature data at 30-min intervals
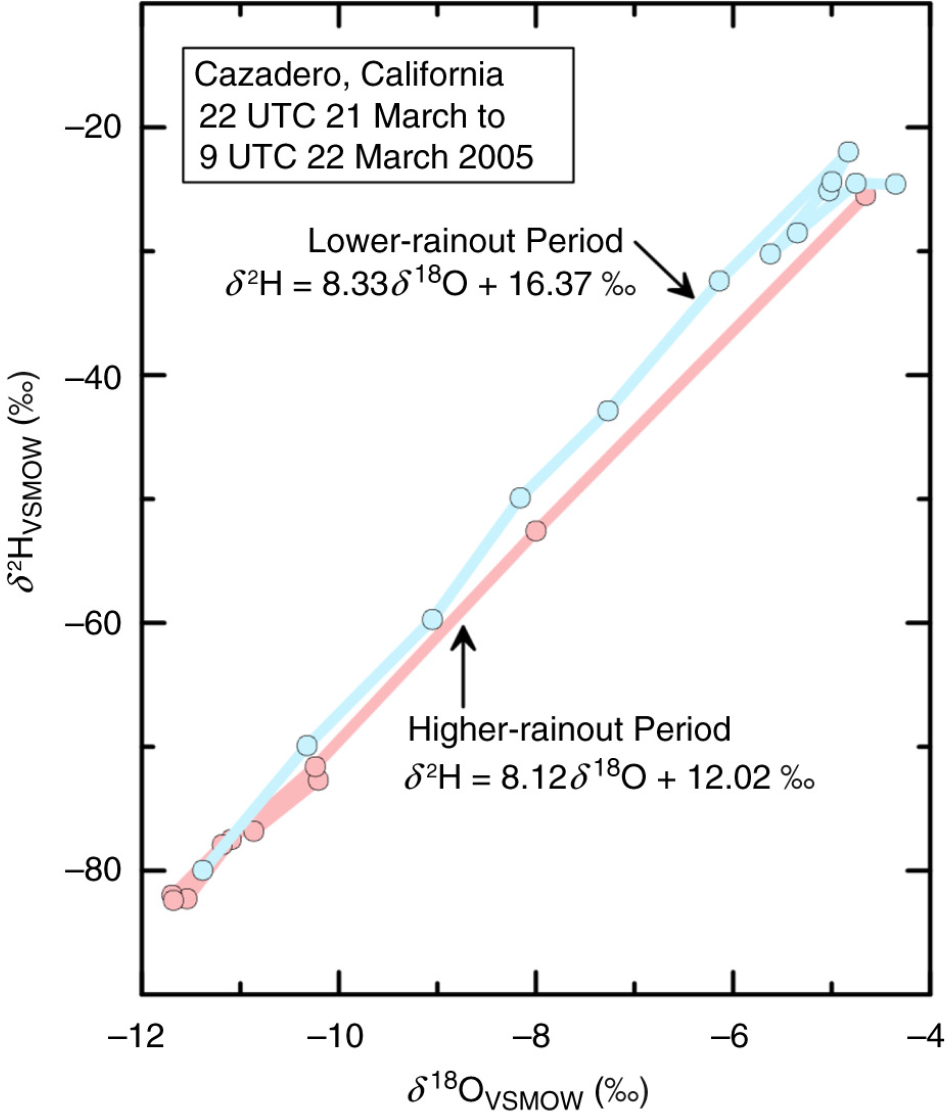
Fig. 19
Crossplot of δ 2HVSMOW and δ 18OVSMOW of precipitation collected on 21–22 March 2005 at Cazadero, CA.
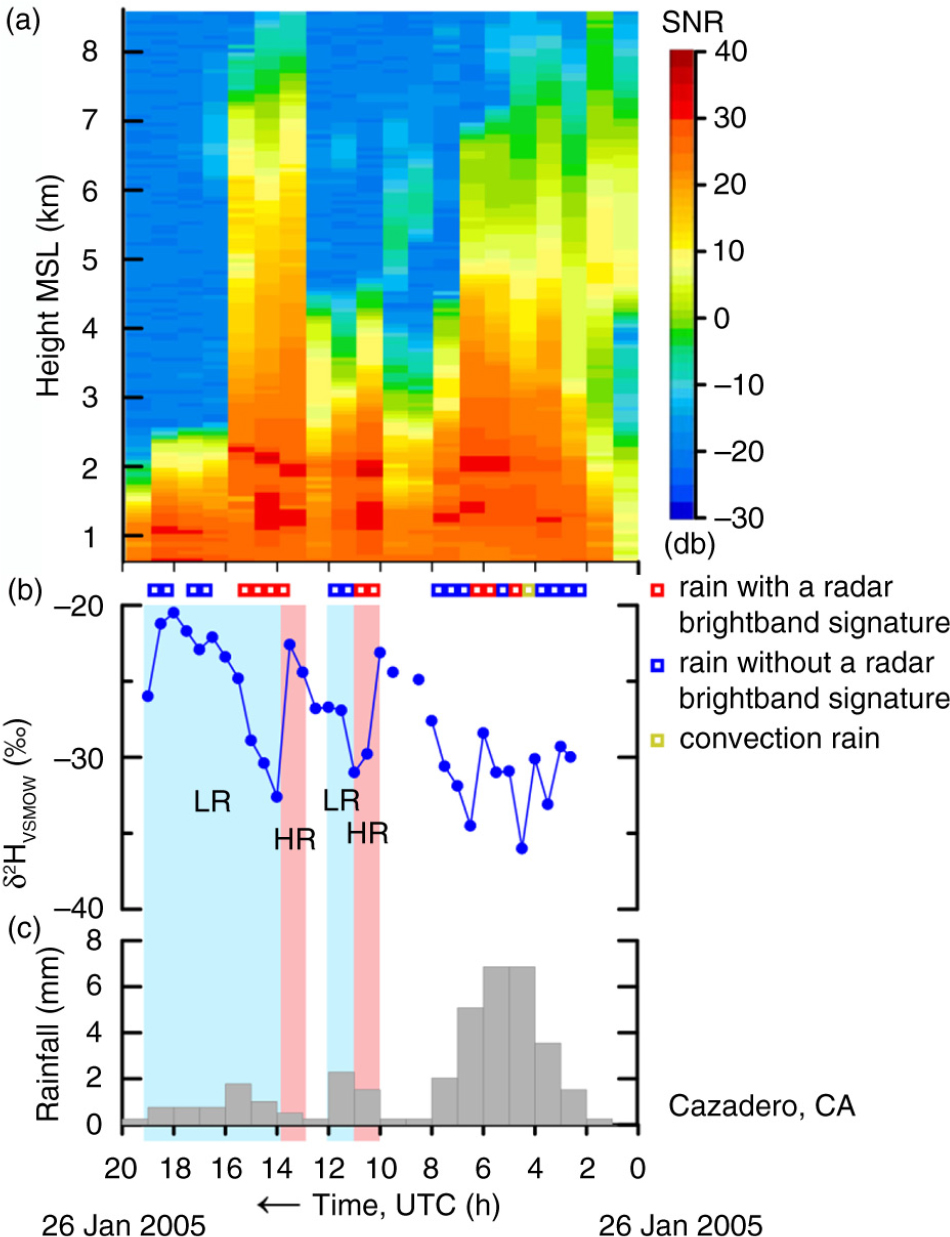
Fig. A1
(a) Time–height section of equivalent radar reflectivity factor with signal-to-noise ratio (SNR), (b) time series of δ 2HVSMOW values of 30-min, time-integrated precipitation samples and (c) histogram of hourly rainfall at Cazadero, CA, collected between 0 and 20 UTC 26 January 2005. HR, pink panels, higher rainout, decreasing or low δ 2HVSMOW values. LR, blue panels, lower rainout, increasing or high δ 2HVSMOW values. Open squares indicate objective categorization of the rainfall occurring during selected half-hour periods. Time increases from right to left.
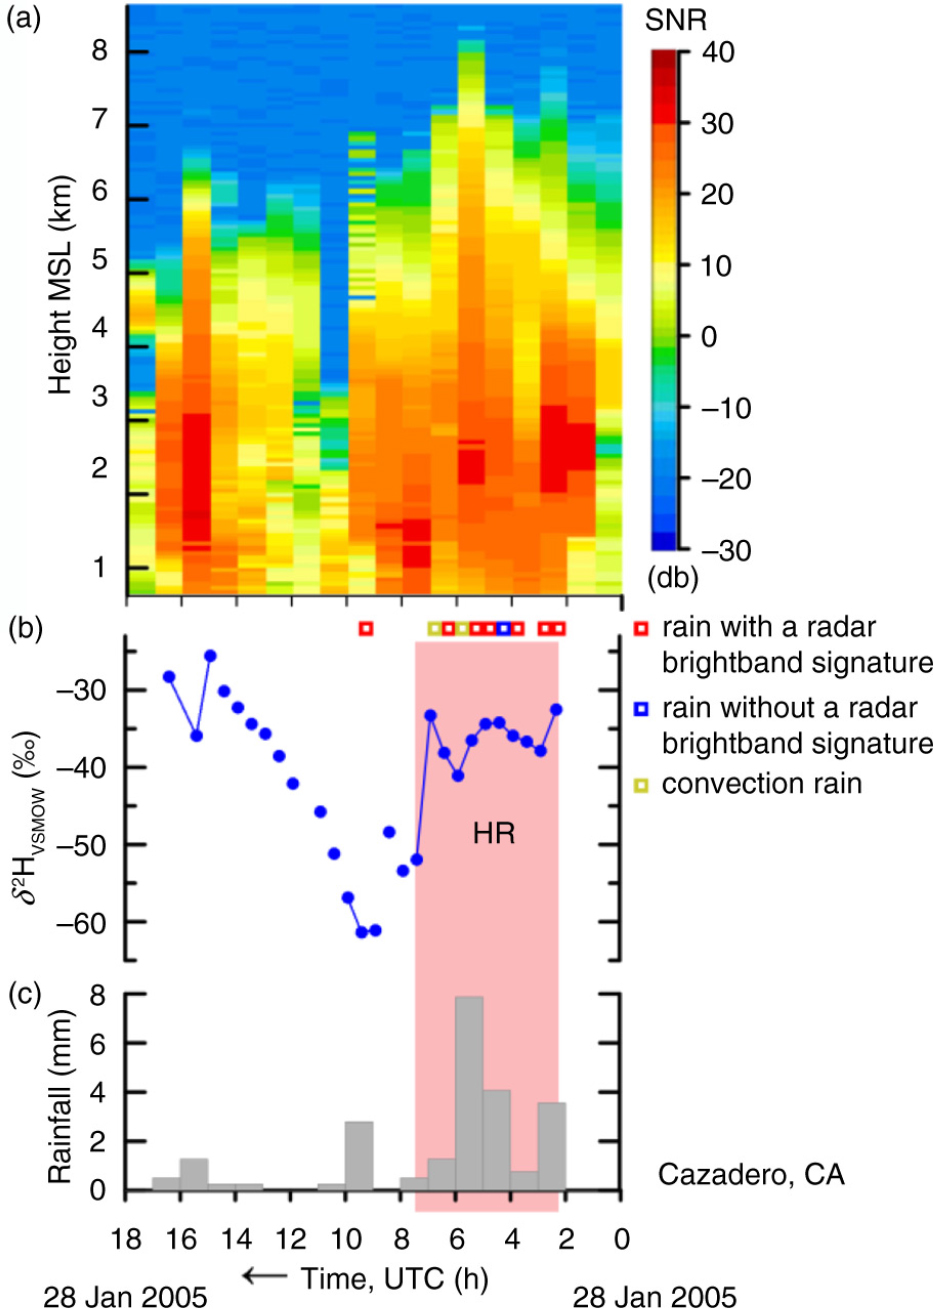
Fig. A2
(a) Time–height section of equivalent radar reflectivity factor with signal-to-noise ratio (SNR), (b) time series of δ 2HVSMOW values of 30-min, time-integrated precipitation samples and (c) histogram of hourly rainfall at Cazadero, CA, collected between 0 and 18 UTC 28 January 2005. Period A, pink panel, zone of decreasing or low δ 2HVSMOW values. HR, pink panel, higher rainout, decreasing or low δ 2HVSMOW values. Open squares indicate objective categorization of the rainfall occurring during selected half-hour periods. Time increases from right to left.
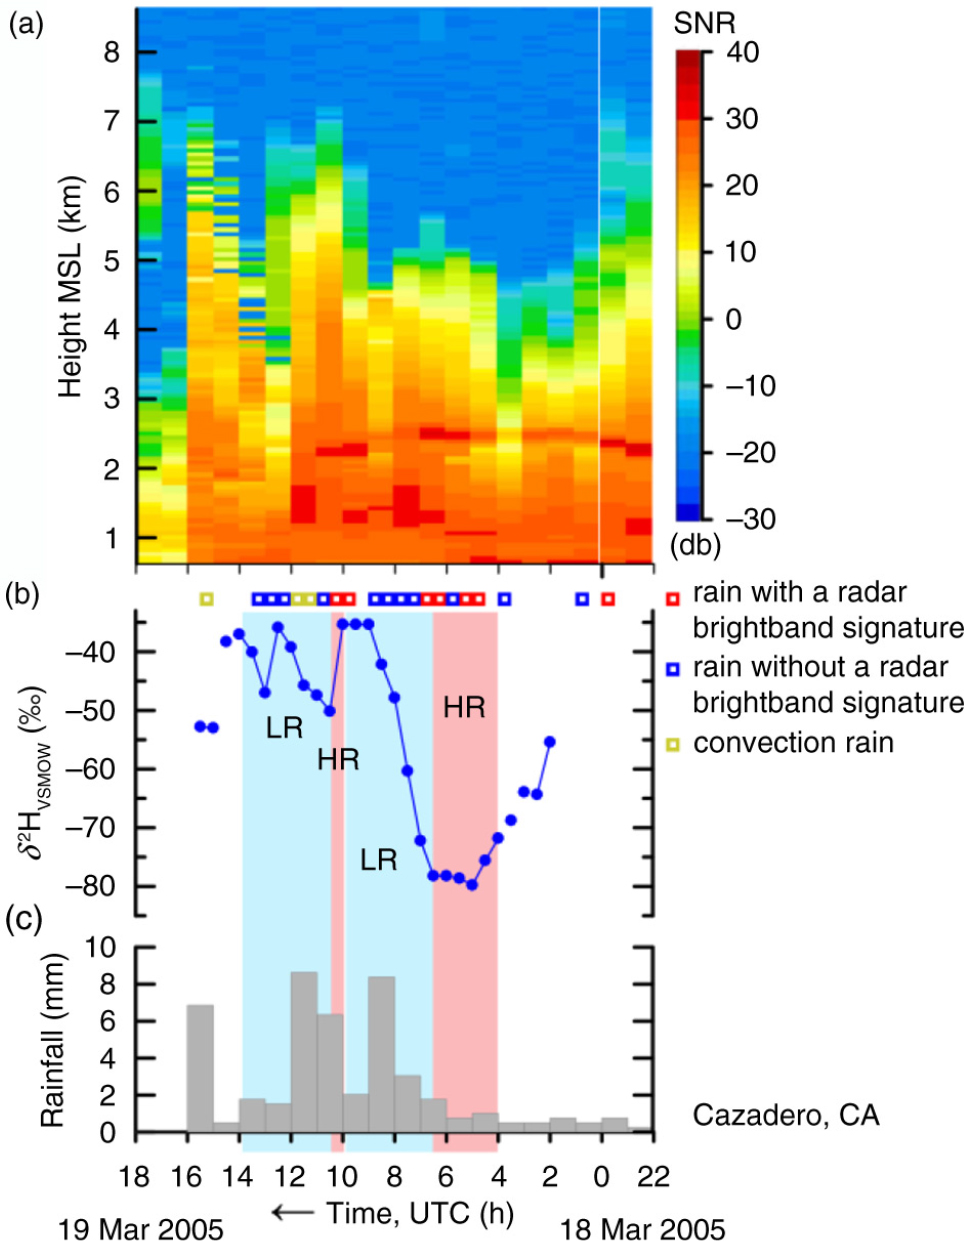
Fig. A3
(a) Time–height section of equivalent radar reflectivity factor with signal-to-noise ratio (SNR), (b) time series of δ 2HVSMOW values of 30-min, time-integrated precipitation samples and (c) histogram of hourly rainfall at Cazadero, CA, collected between 22 UTC 18 March 2005 and 18 UTC 19 March 2005. Period A, pink panel, zone of decreasing or low δ 2HVSMOW values. HR, pink panels, higher rainout, decreasing or low δ 2HVSMOW values. LR, blue panels, lower rainout, increasing or high δ 2HVSMOW values. Open squares indicate objective categorization of the rainfall occurring during selected half-hour periods. Time increases from right to left.
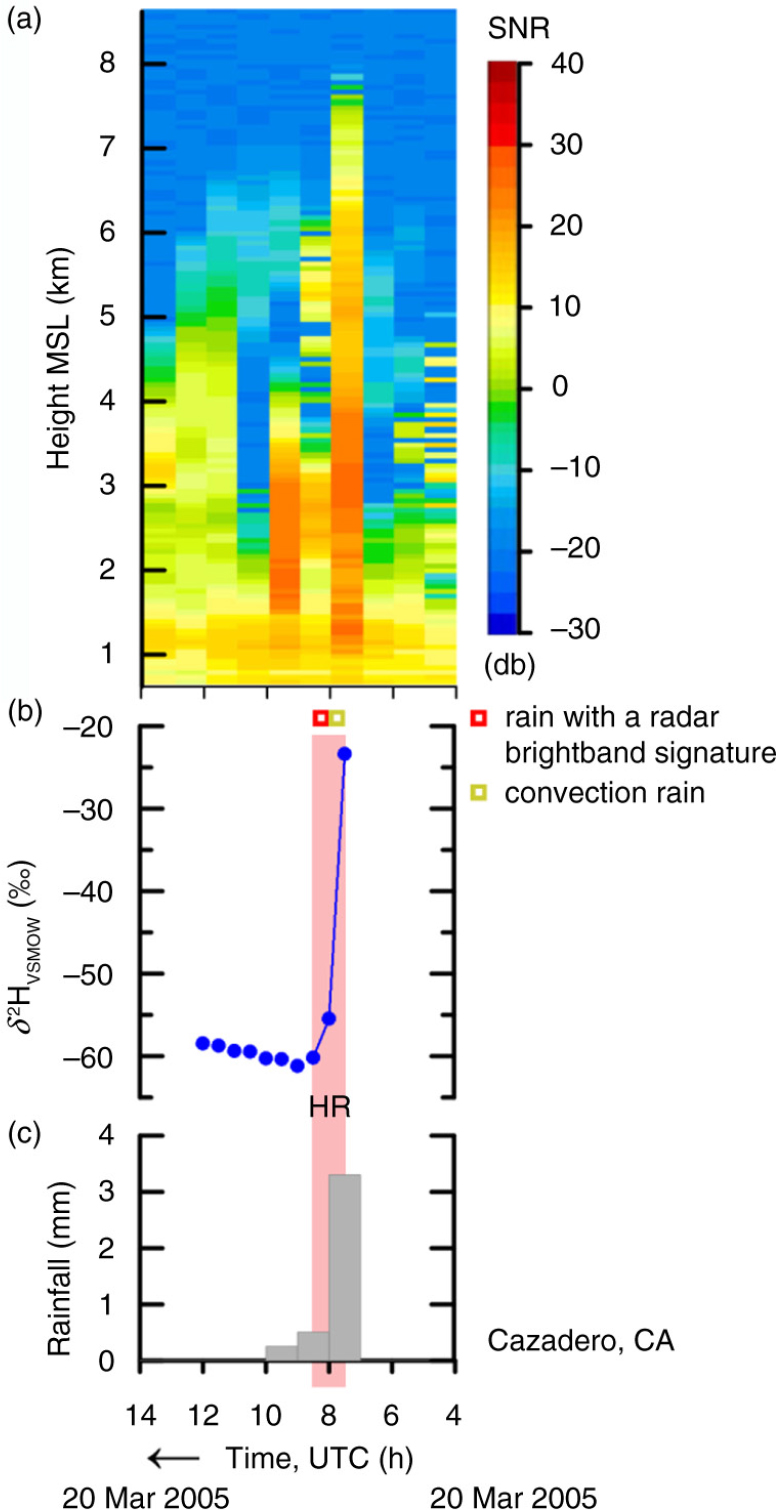
Fig. A4
(a) Time–height section of equivalent radar reflectivity factor with signal-to-noise ratio (SNR), (b) time series of δ 2HVSMOW values of 30-min, time-integrated precipitation samples and (c) histogram of hourly rainfall at Cazadero, CA, collected between 4 and 14 UTC 20 March 2005. HR, pink panel, higher rainout, decreasing or low δ 2HVSMOW values. Open squares indicate objective categorization of the rainfall occurring during selected half-hour periods. Time increases from right to left.
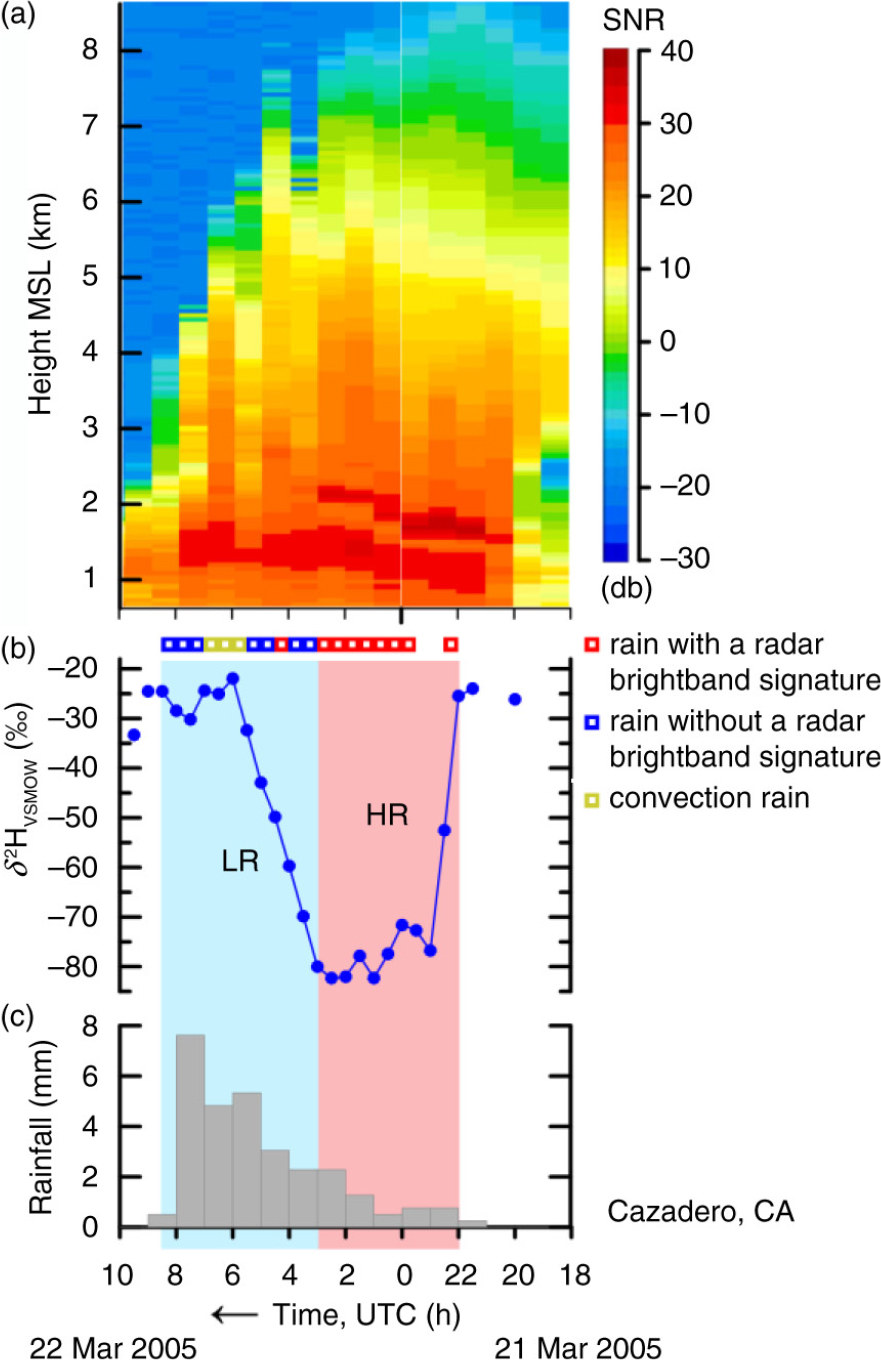
Fig. A5
(a) Time–height section of equivalent radar reflectivity factor with signal-to-noise ratio (SNR), (b) time series of δ 2HVSMOW values of 30-min, time-integrated precipitation samples and (c) histogram of hourly rainfall at Cazadero, CA, collected between 18 UTC 21 March 2005 and 10 UTC 22 March 2005. HR, pink panel, higher rainout, decreasing or low δ 2HVSMOW values. LR, blue panel, lower rainout, increasing or high δ 2HVSMOW values. Open squares indicate objective categorization of the rainfall occurring during selected half-hour periods. Time increases from right to left.
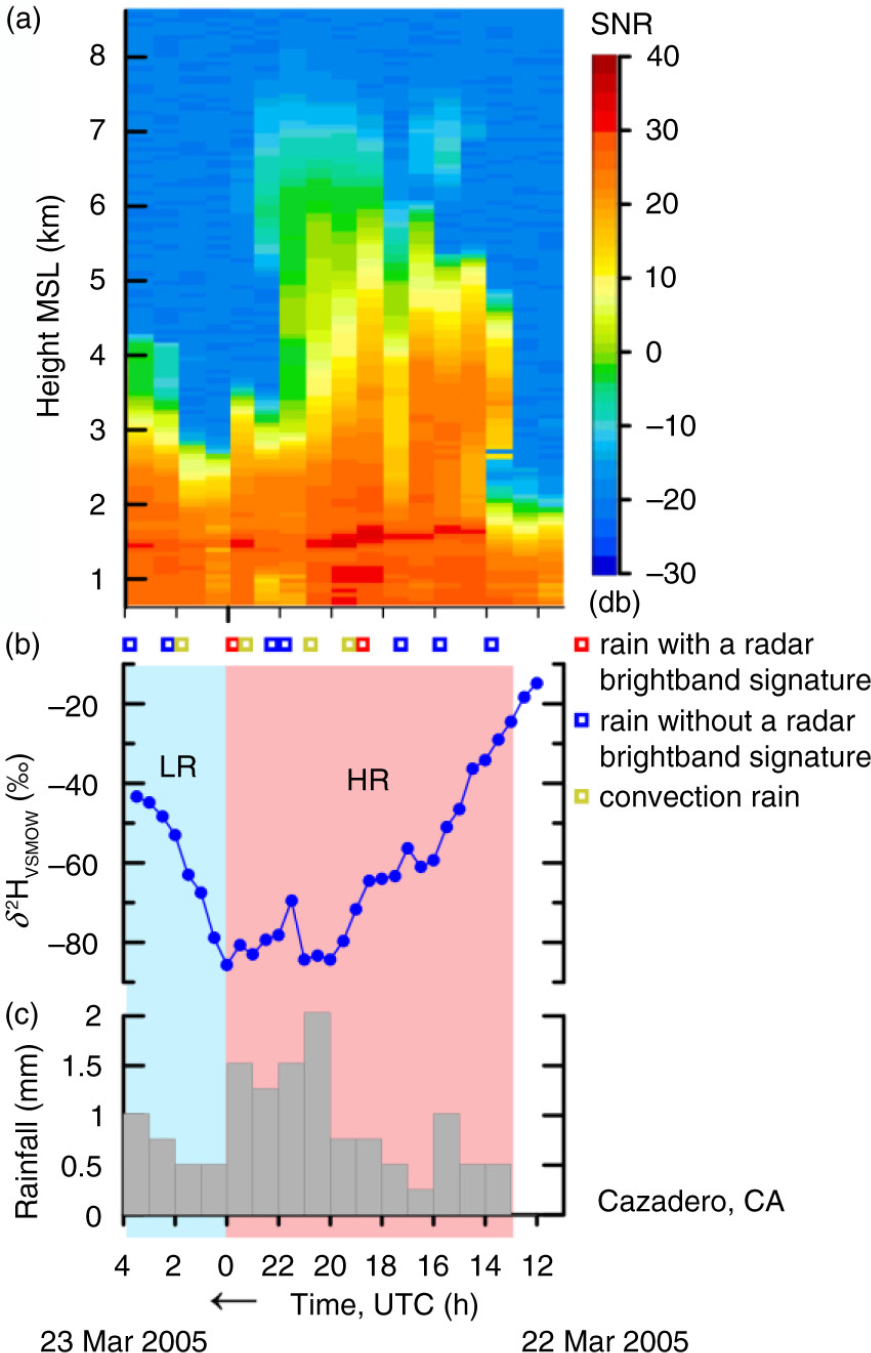
Fig. A6
(a) Time–height section of equivalent radar reflectivity factor with signal-to-noise ratio (SNR), (b) time series of δ 2HVSMOW values of 30-min, time-integrated precipitation samples and (c) histogram of hourly rainfall at Cazadero, CA, collected between 12 UTC 22 March 2005 and 4 UTC 23 March 2005. HR, pink panel, higher rainout, decreasing or low δ 2HVSMOW values. LR, blue panel, lower rainout, increasing or high δ 2HVSMOW values. Open squares indicate objective categorization of the rainfall occurring during selected half-hour periods. Time increases from right to left.
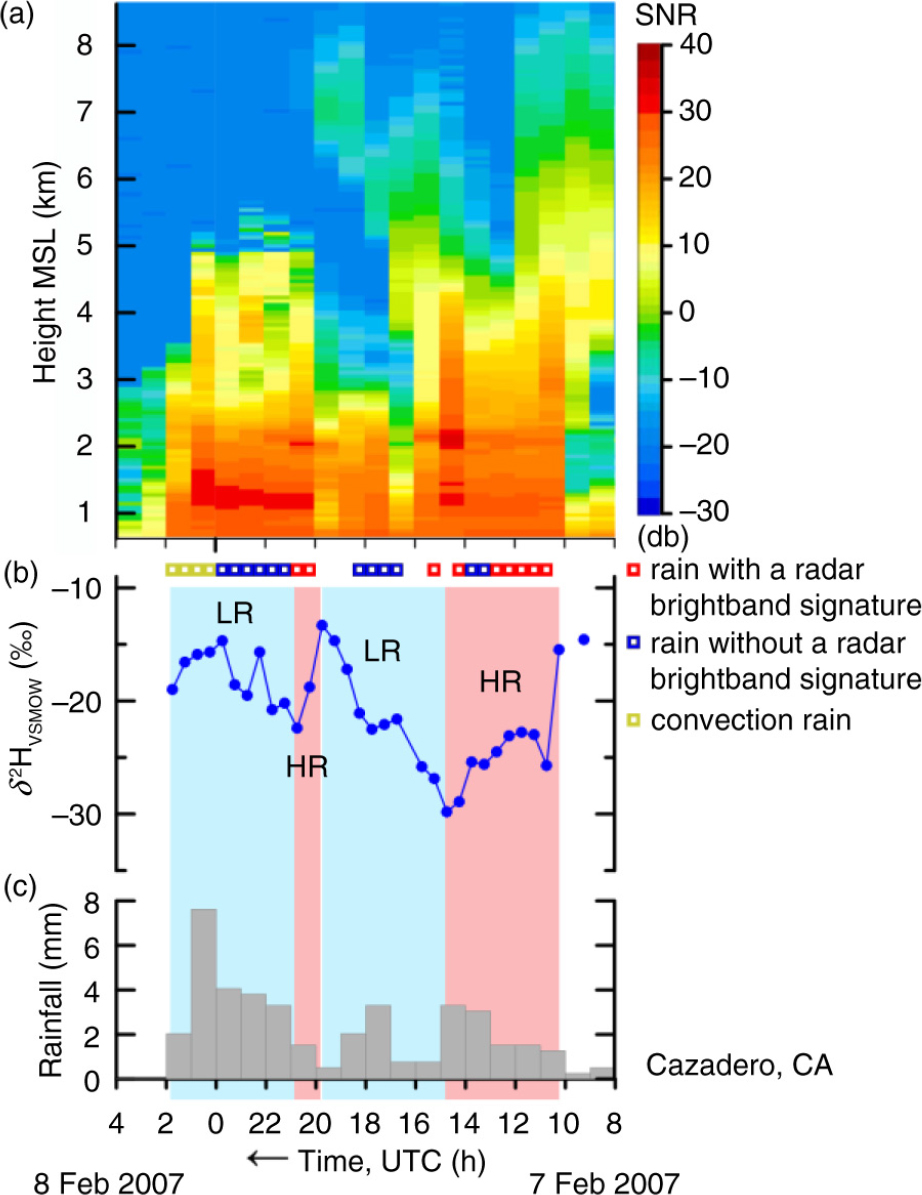
Fig. A7
(a) Time–height section of equivalent radar reflectivity factor with signal-to-noise ratio (SNR), (b) time series of δ 2HVSMOW values of 30-min, time-integrated precipitation samples and (c) histogram of hourly rainfall at Cazadero, CA, collected between 8 UTC 7 February 2007 and 4 UTC 8 February 2007. HR, pink panels, higher rainout, decreasing or low δ 2HVSMOW values. LR, blue panels, lower rainout, increasing or high δ 2HVSMOW values. Open squares indicate objective categorization of the rainfall occurring during selected half-hour periods. Time increases from right to left.
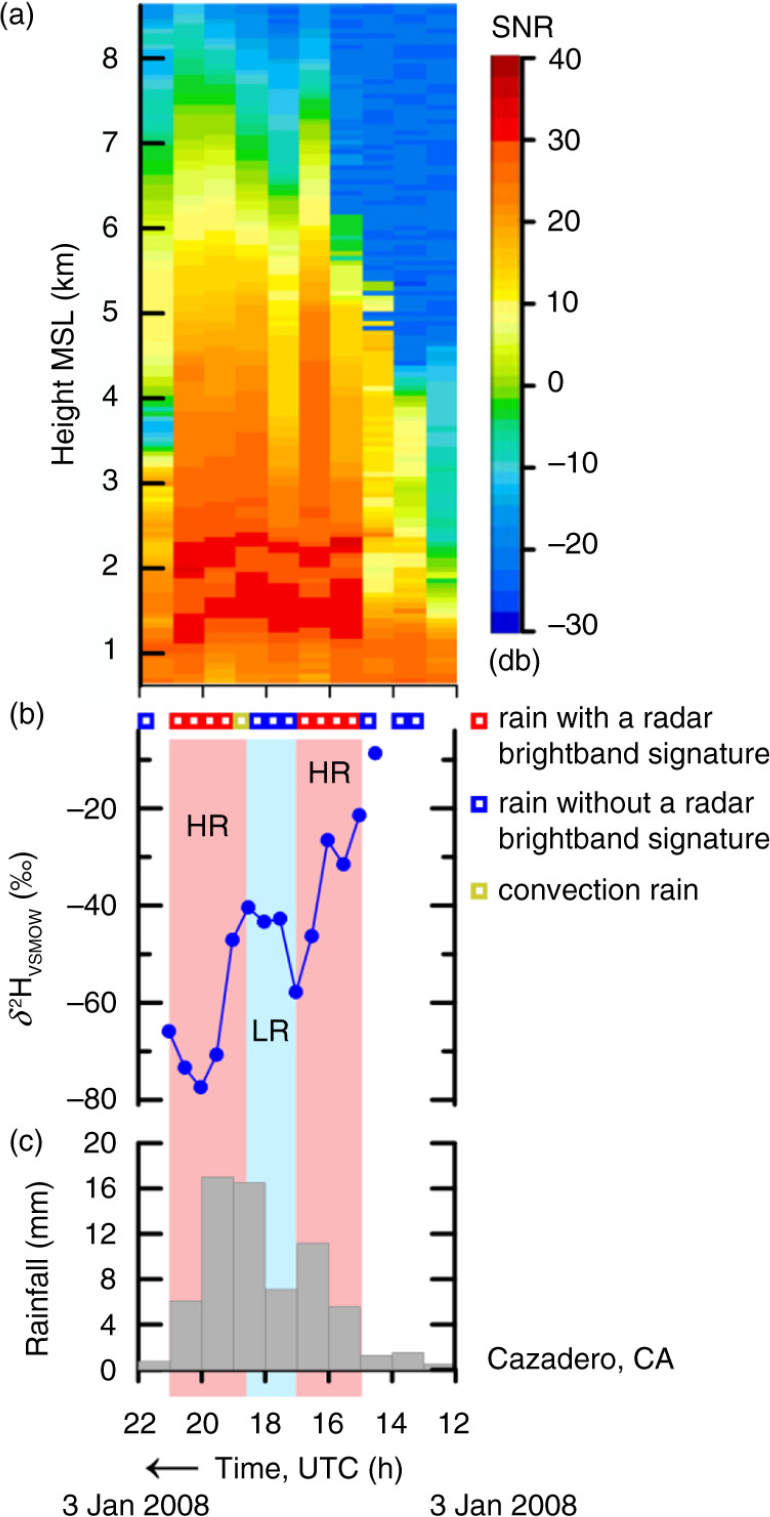
Fig. A8
(a) Time–height section of equivalent radar reflectivity factor with signal-to-noise ratio (SNR), (b) time series of δ 2HVSMOW values of 30-min, time-integrated precipitation samples and (c) histogram of hourly rainfall at Cazadero, CA, collected between 12 and 22 UTC 3 January 2008. HR, pink panels, higher rainout, decreasing or low δ 2HVSMOW values. LR, blue panel, lower rainout, increasing or high δ 2HVSMOW values. Open squares indicate objective categorization of the rainfall occurring during selected half-hour periods. Time increases from right to left.
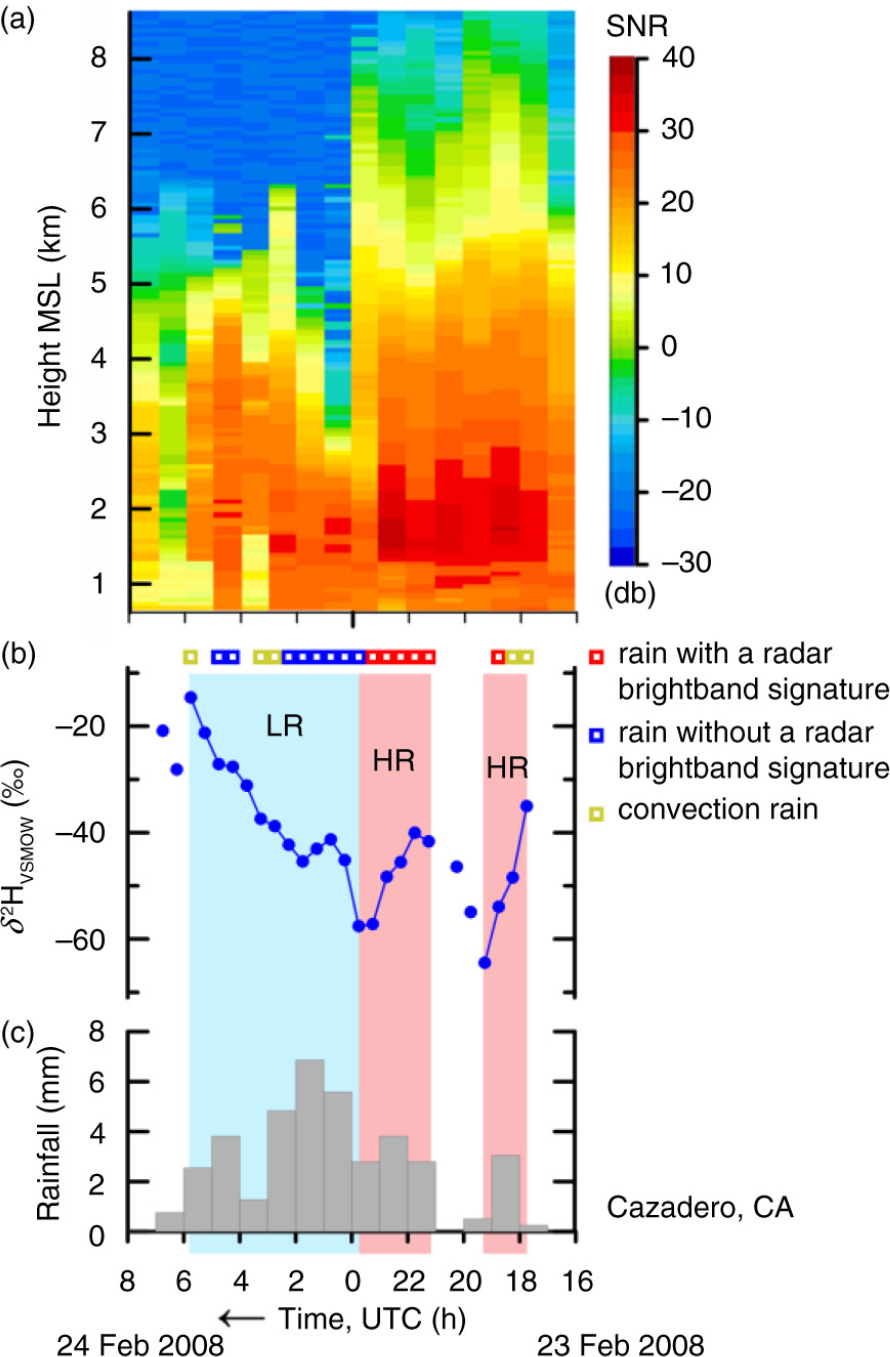
Fig. A9
(a) Time–height section of equivalent radar reflectivity factor with signal-to-noise ratio (SNR), (b) time series of δ 2HVSMOW values of 30-min, time-integrated precipitation samples and (c) histogram of hourly rainfall at Cazadero, CA, collected between 16 UTC 23 February and 8 UTC 24 February 2008. HR, pink panels, higher rainout, decreasing or low δ 2HVSMOW values. LR, blue panel, lower rainout, increasing or high δ 2HVSMOW values. Open squares indicate objective categorization of the rainfall occurring during selected half-hour periods. Time increases from right to left.
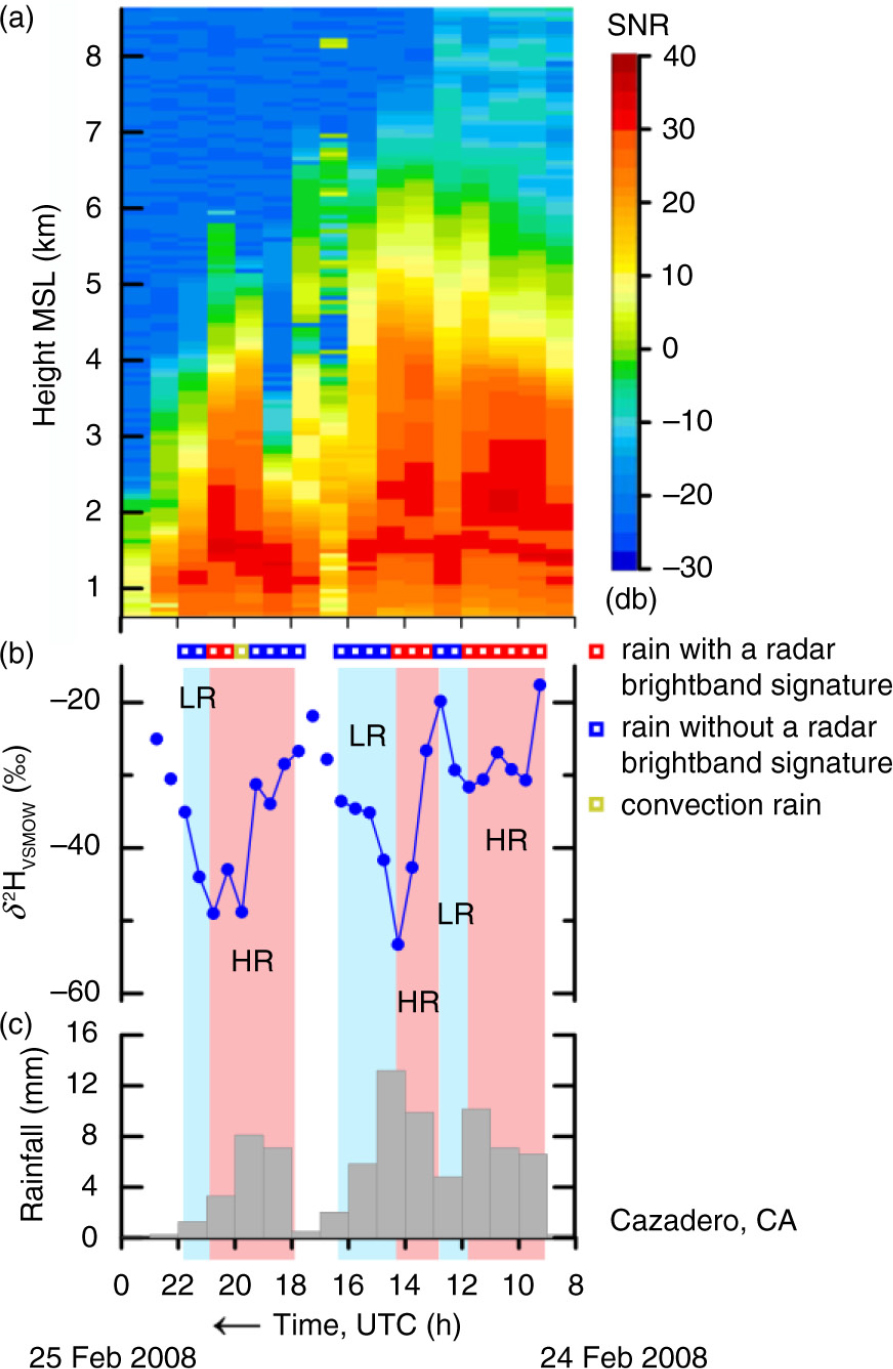
Fig. A10
(a) Time–height section of equivalent radar reflectivity factor with signal-to-noise ratio (SNR), (b) time series of δ 2HVSMOW values of 30-min, time-integrated precipitation samples and (c) histogram of hourly rainfall at Cazadero, CA, collected between 8 UTC 24 February 2008 and 0 UTC 25 February 2008. HR, pink panels, higher rainout, decreasing or low δ 2HVSMOW values. LR, blue panels, lower rainout, increasing or high δ 2HVSMOW values. Open squares indicate objective categorization of the rainfall occurring during selected half-hour periods. Time increases from right to left.
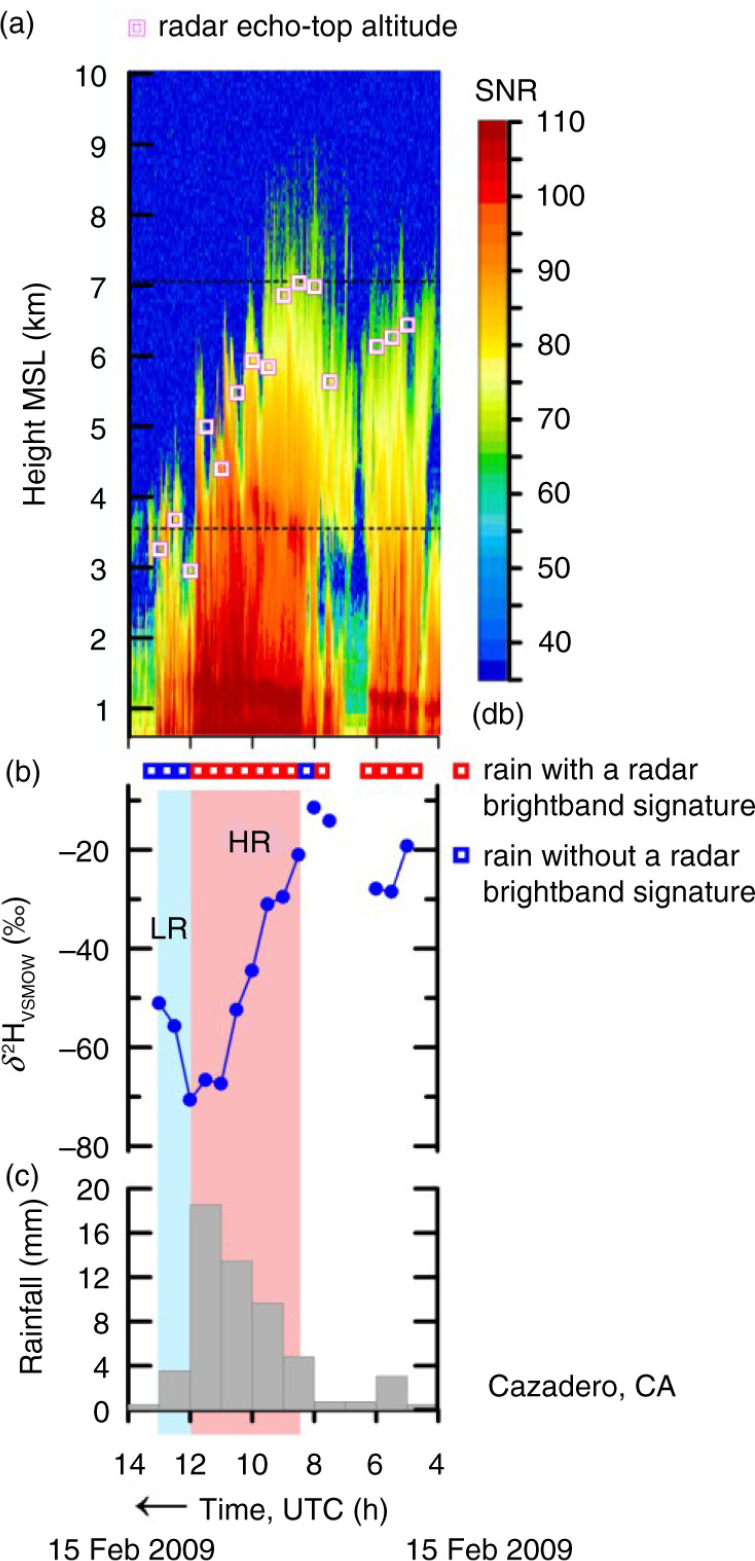
Fig. A11
(a) Time–height section of equivalent radar reflectivity factor with signal-to-noise ratio (SNR), (b) time series of δ 2HVSMOW values of 30-min, time-integrated precipitation samples and (c) histogram of hourly rainfall at Cazadero, CA, collected between 4 and 14 UTC 15 February 2009. Open magenta squares indicate echo-top height. HR, pink panel, higher rainout, decreasing or low δ 2HVSMOW values. LR, blue panel, lower rainout, increasing or high δ 2HVSMOW values. Open squares indicate objective categorization of the rainfall occurring during selected half-hour periods. Dashed horizontal lines are KMUX NEXRAD 0.5-degree beam. Time increases from right to left.
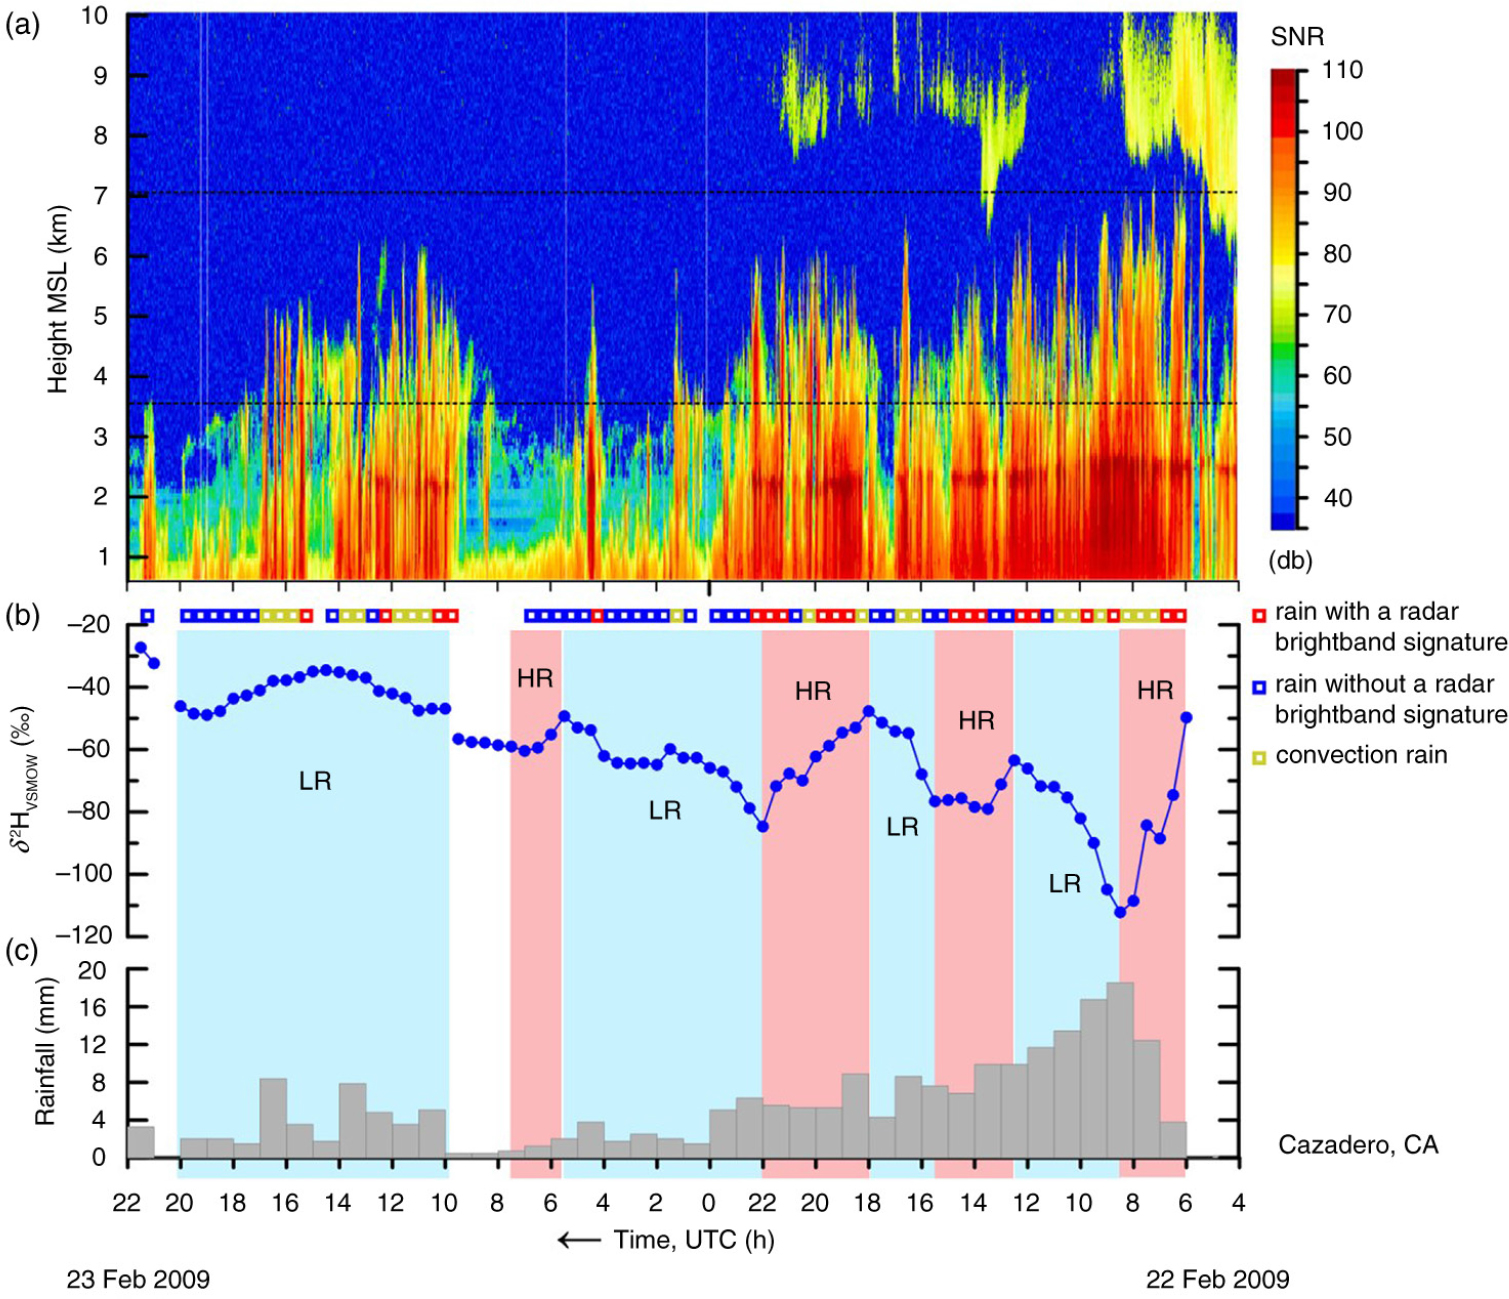
Fig. A12
(a) Time–height section of equivalent radar reflectivity factor with signal-to-noise ratio (SNR), (b) time series of δ 2HVSMOW values of 30-min, time-integrated precipitation samples and (c) histogram of hourly rainfall at Cazadero, CA, collected between 4 UTC 22 February 2009 and 22 UTC 23 February 2009. HR, pink panels, higher rainout, decreasing or low δ 2HVSMOW values. LR, blue panels, lower rainout, increasing or high δ 2HVSMOW values. Open squares indicate objective categorization of the rainfall occurring during selected half-hour periods. Dashed horizontal lines are KMUX NEXRAD 0.5-degree beam. Time increases from right to left.
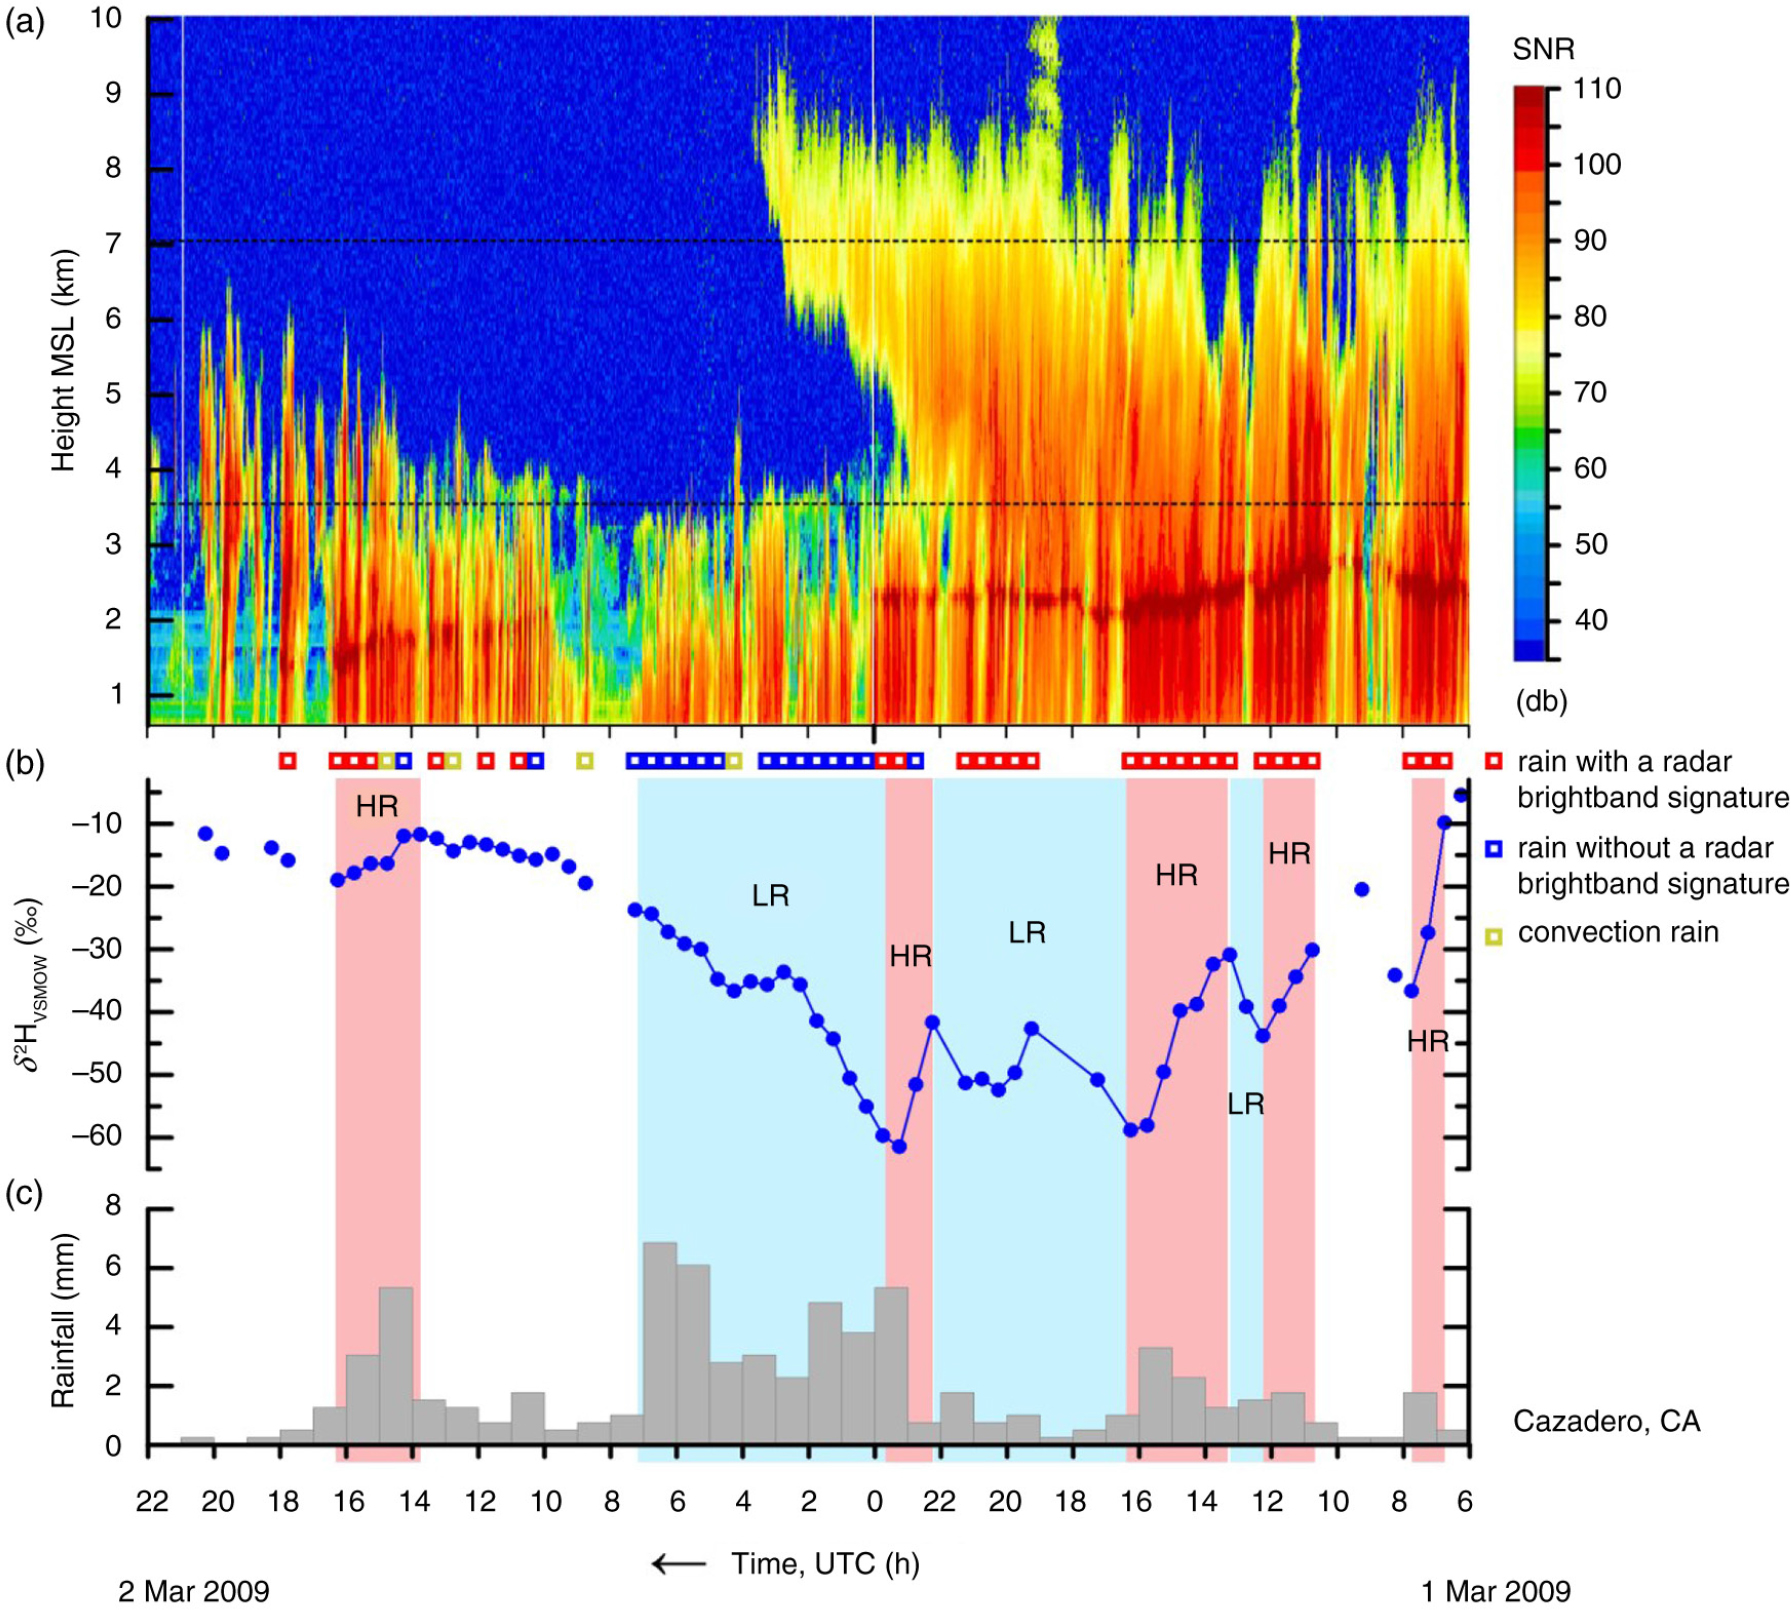
Fig. A13
(a) Time–height section of equivalent radar reflectivity factor with signal-to-noise ratio (SNR), (b) time series of δ 2HVSMOW values of 30-min, time-integrated precipitation samples and (c) histogram of hourly rainfall at Cazadero, CA, collected between 6 UTC 1 March 2009 and 22 UTC 2 March 2009. HR, pink panels, higher rainout, decreasing or low δ 2HVSMOW values. LR, blue panels, lower rainout, increasing or high δ 2HVSMOW values. Open squares indicate objective categorization of the rainfall occurring during selected half-hour periods. Dashed horizontal lines are KMUX NEXRAD 0.5-degree beam. Time increases from right to left.
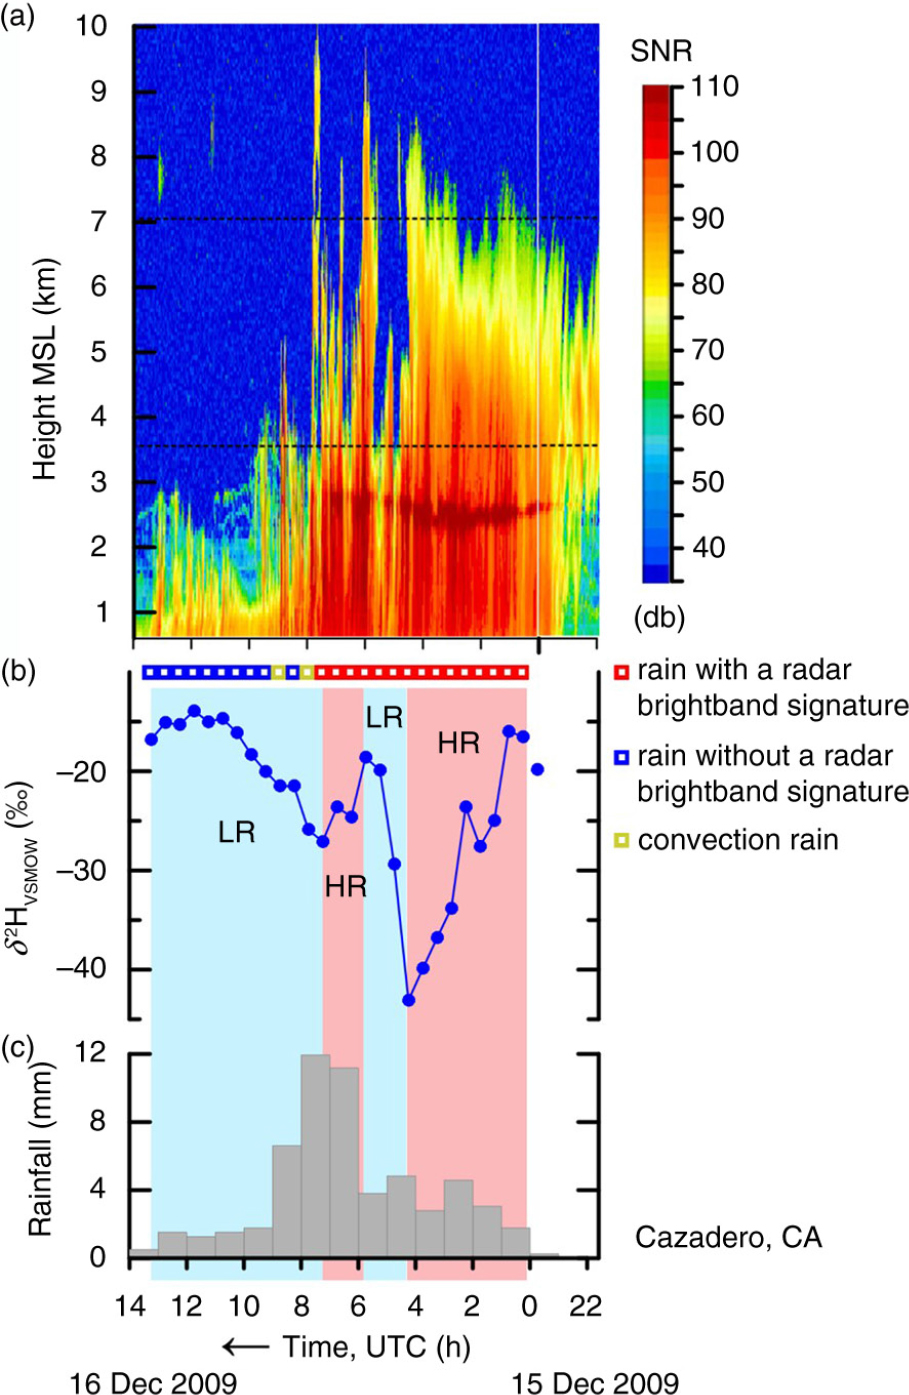
Fig. A14
(a) Time–height section of equivalent radar reflectivity factor with signal-to-noise ratio (SNR), (b) time series of δ 2HVSMOW values of 30-min, time-integrated precipitation samples and (c) histogram of hourly rainfall at Cazadero, CA, collected between 22 UTC 15 December 2009 and 14 UTC 16 December 2009. HR, pink panels, higher rainout, decreasing or low δ 2HVSMOW values. LR, blue panels, lower rainout, increasing or high δ 2HVSMOW values. Dashed horizontal lines are KMUX NEXRAD 0.5-degree beam. Time increases from right to left.
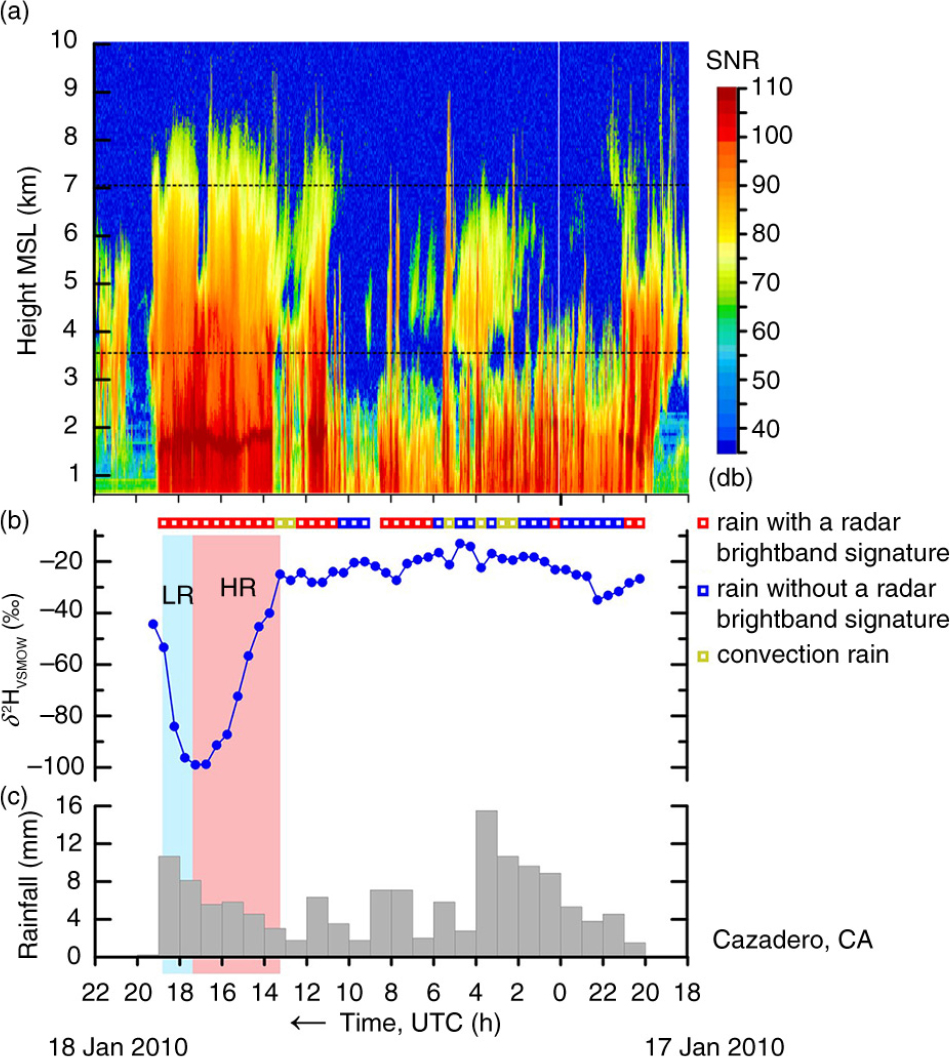
Fig. A15
(a) Time–height section of equivalent radar reflectivity factor with signal-to-noise ratio (SNR), (b) time series of δ 2HVSMOW values of 30-min, time-integrated precipitation samples and (c) histogram of hourly rainfall at Cazadero, CA, collected between 18 UTC 17 January 2010 and 22 UTC 18 January 2010. Open magenta squares indicate echo-top height. HR, pink panel, higher rainout, decreasing or low δ 2HVSMOW values. LR, blue panel, lower rainout, increasing or high δ 2HVSMOW values. Open squares indicate objective categorization of the rainfall occurring during selected half-hour periods. Dashed horizontal lines are KMUX NEXRAD 0.5-degree beam. Time increases from right to left.
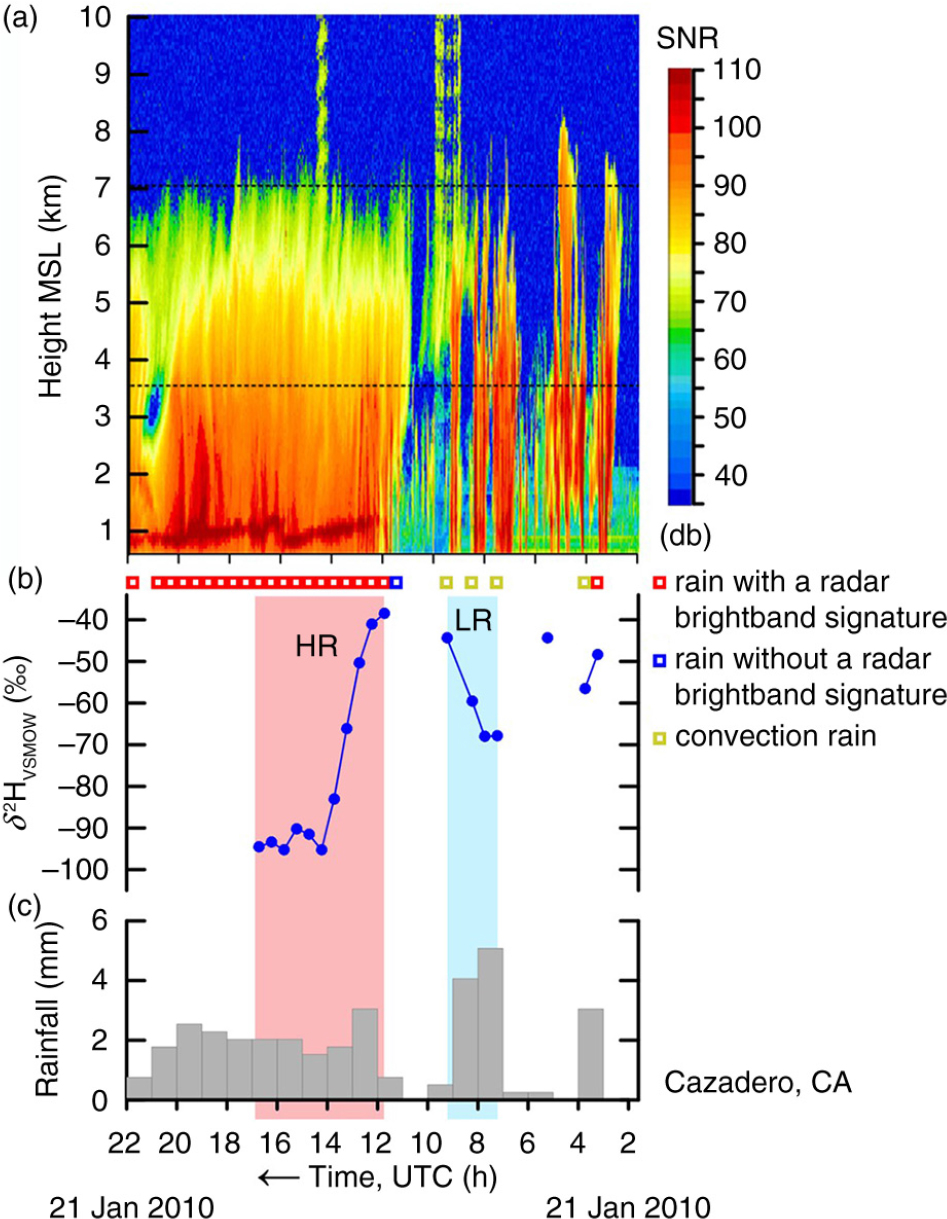
Fig. A16
(a) Time–height section of equivalent radar reflectivity factor with signal-to-noise ratio (SNR), (b) time series of δ 2HVSMOW values of 30-min, time-integrated precipitation samples and (c) histogram of hourly rainfall at Cazadero, CA, collected between 2 and 22 UTC 21 January 2010. HR, pink panel, higher rainout, decreasing or low δ 2HVSMOW values. LR, blue panel, lower rainout, increasing or high δ 2HVSMOW values. Open squares indicate objective categorization of the rainfall occurring during selected half-hour periods. Dashed horizontal lines are KMUX NEXRAD 0.5-degree beam. Time increases from right to left.
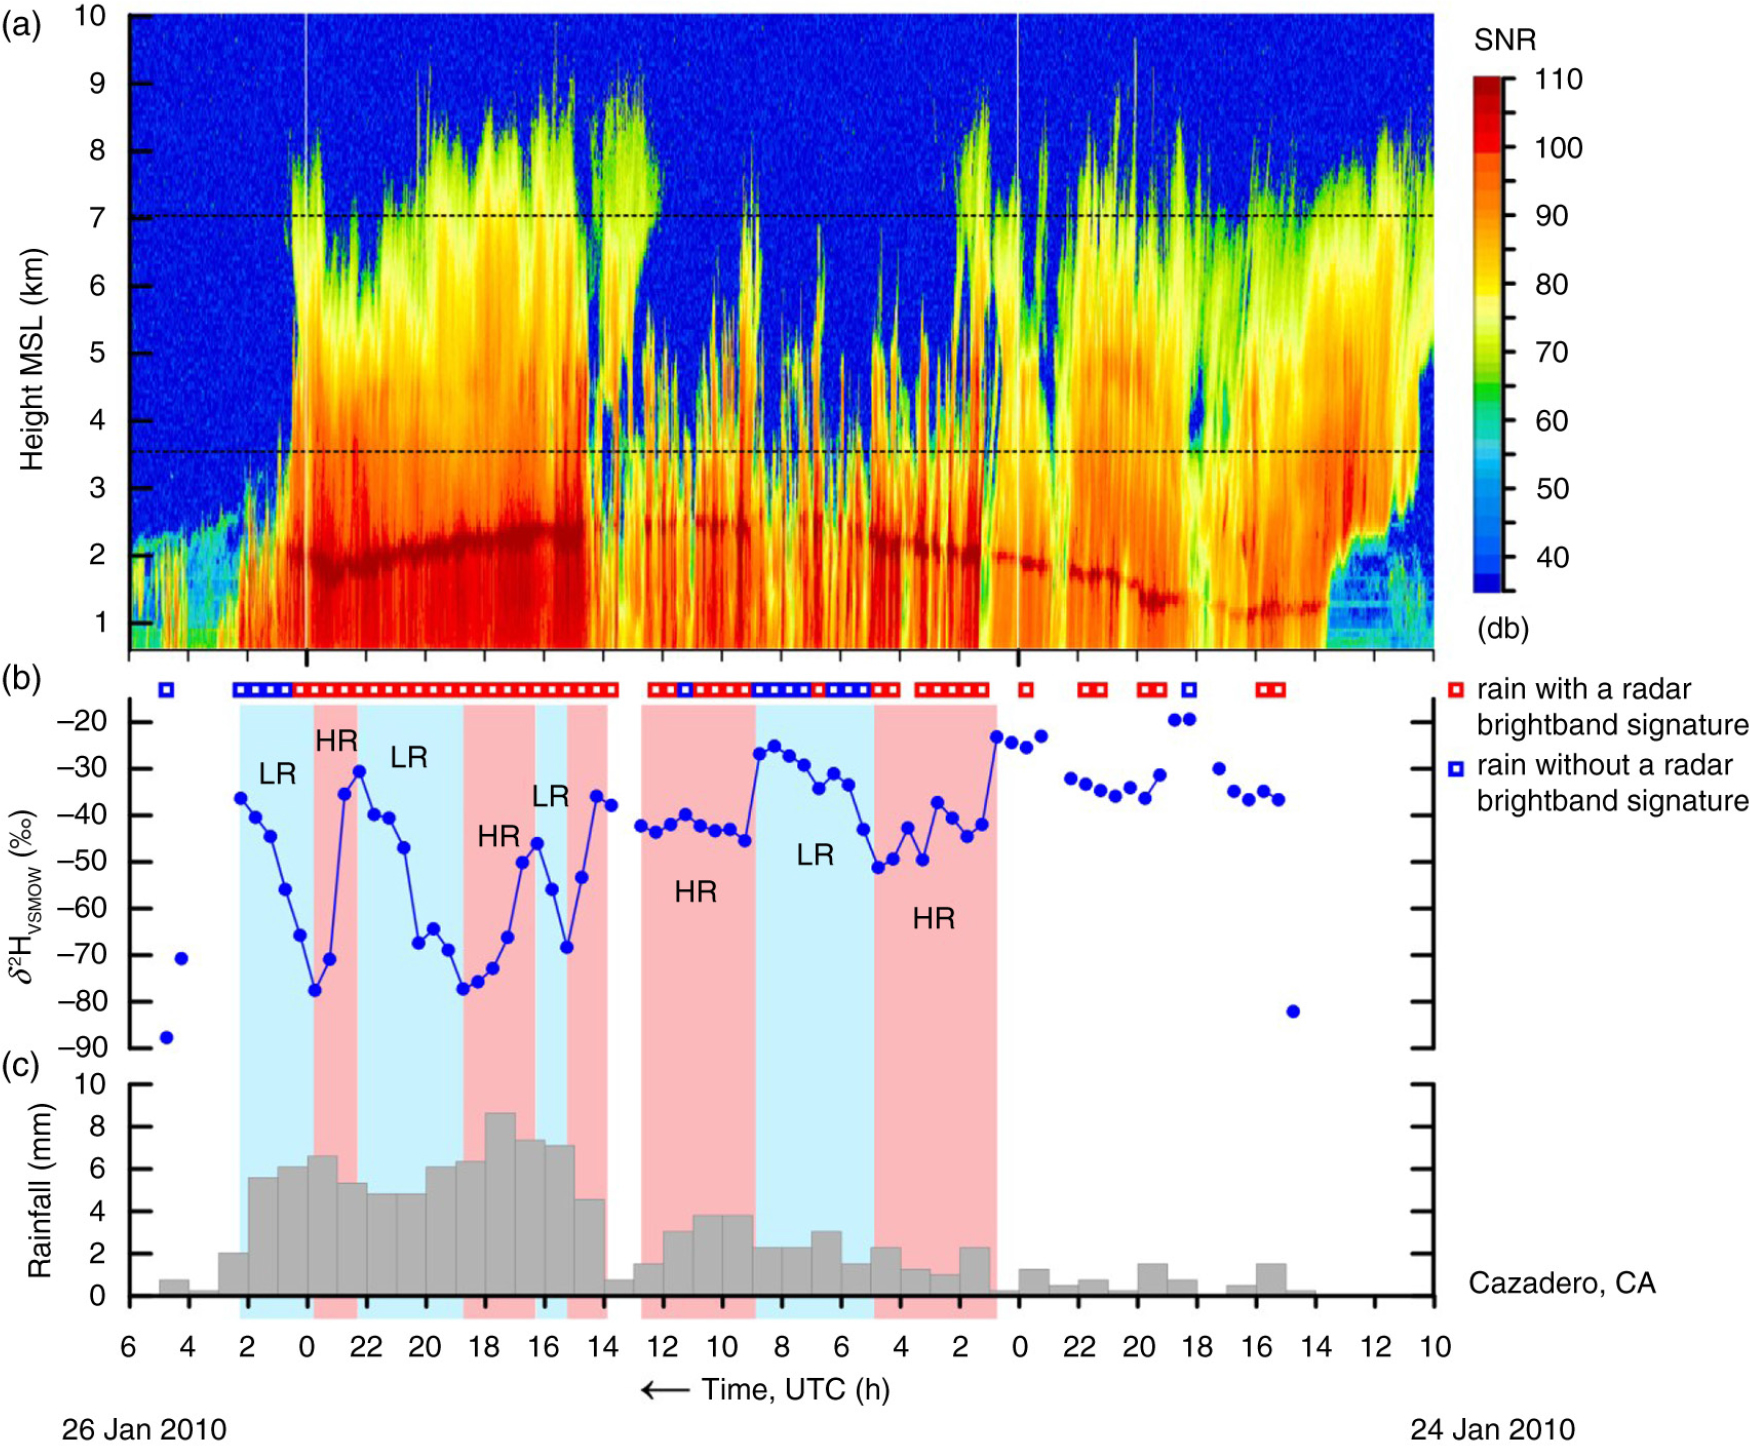
Fig. A17
(a) Time–height section of equivalent radar reflectivity factor with signal-to-noise ratio (SNR), (b) time series of δ 2HVSMOW values of 30-min, time-integrated precipitation samples and (c) histogram of hourly rainfall at Cazadero, CA, collected between 10 UTC 24 January 2010 and 6 UTC 26 January 2010. HR, pink panels, higher rainout, decreasing or low δ 2HVSMOW values. LR, blue panels, lower rainout, increasing or high δ 2HVSMOW values. Open squares indicate objective categorization of the rainfall occurring during selected half-hour periods. Dashed horizontal lines are KMUX NEXRAD 0.5-degree beam. Time increases from right to left.
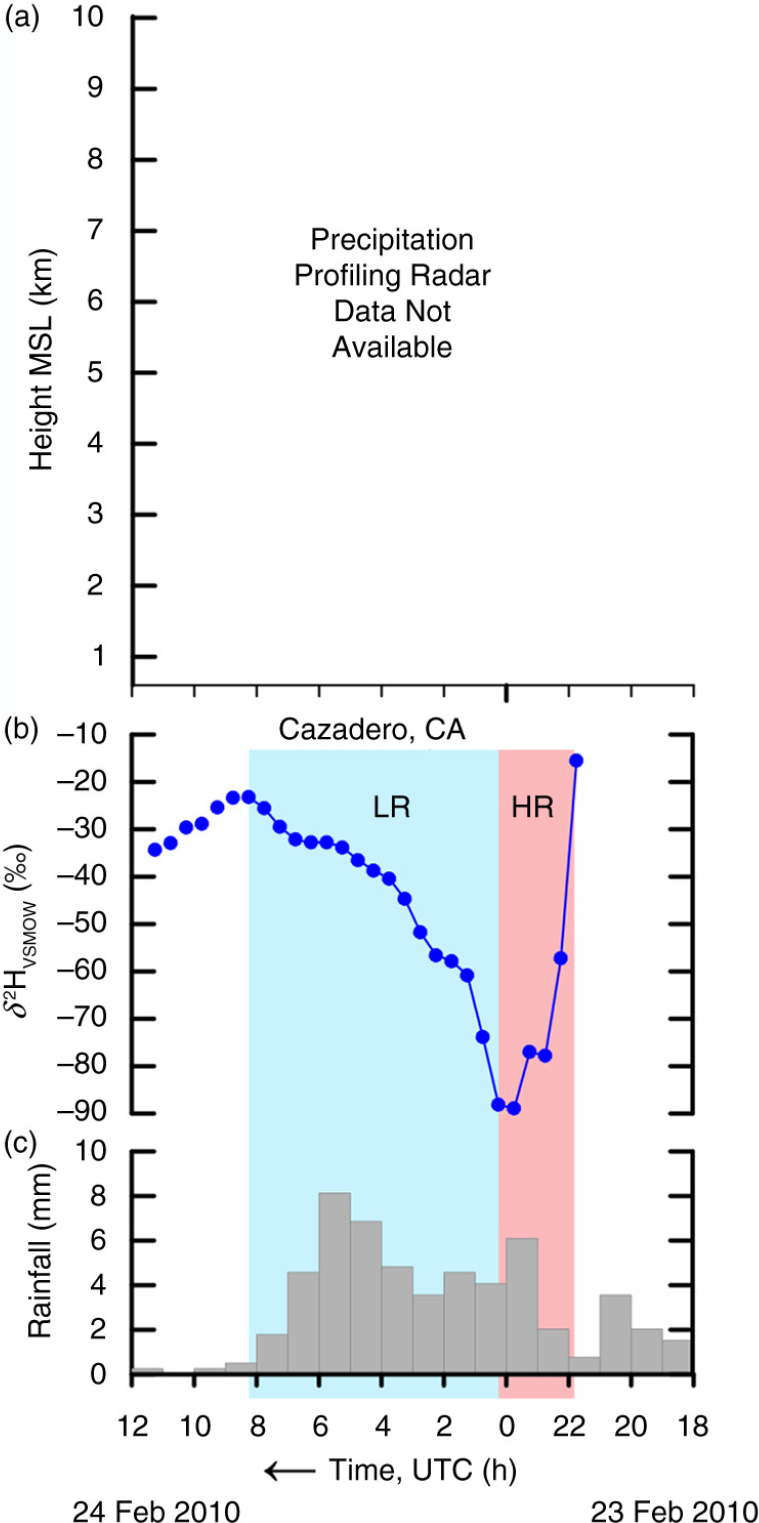
Fig. A18
(a) Time–height section of equivalent radar reflectivity factor with signal-to-noise ratio (SNR), (b) time series of δ 2HVSMOW values of 30-min, time-integrated precipitation samples and (c) histogram of hourly rainfall at Cazadero, CA, collected between 18 UTC 23 February 2010 and 12 UTC 24 February 2010. Period HR, pink panel, higher rainout, decreasing or low δ 2HVSMOW values. LR, blue panel, lower rainout, increasing or high δ 2HVSMOW values. Time increases from right to left.
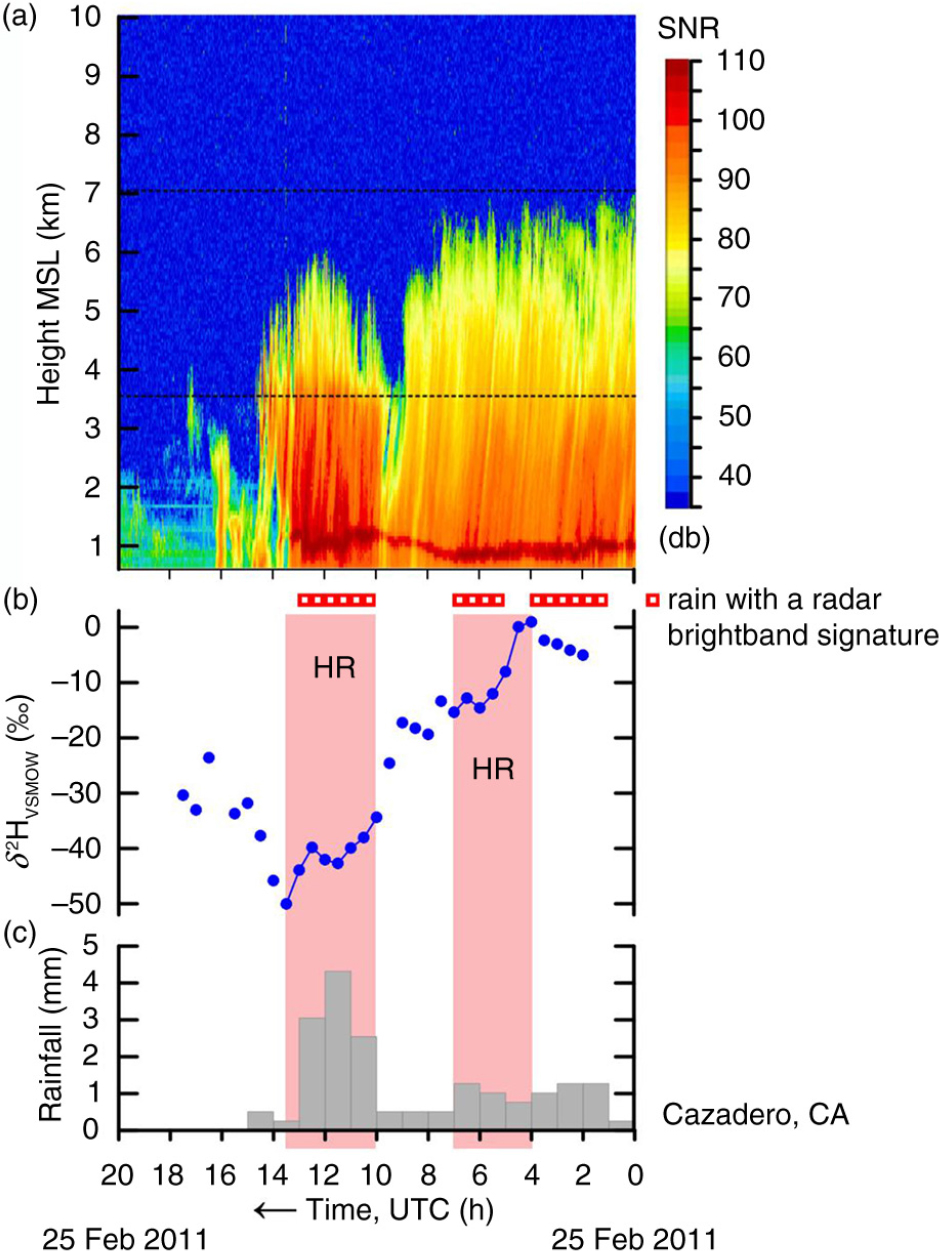
Fig. A19
(a) Time–height section of equivalent radar reflectivity factor with signal-to-noise ratio (SNR), (b) time series of δ 2HVSMOW values of 30-min, time-integrated precipitation samples and (c) histogram of hourly rainfall at Cazadero, CA, collected between 0 and 20 UTC 25 February 2011. HR, pink panels, higher rainout, decreasing or low δ 2HVSMOW values. Open squares indicate objective categorization of the rainfall occurring during selected half-hour periods. Dashed horizontal lines are KMUX NEXRAD 0.5-degree beam. Time increases from right to left.
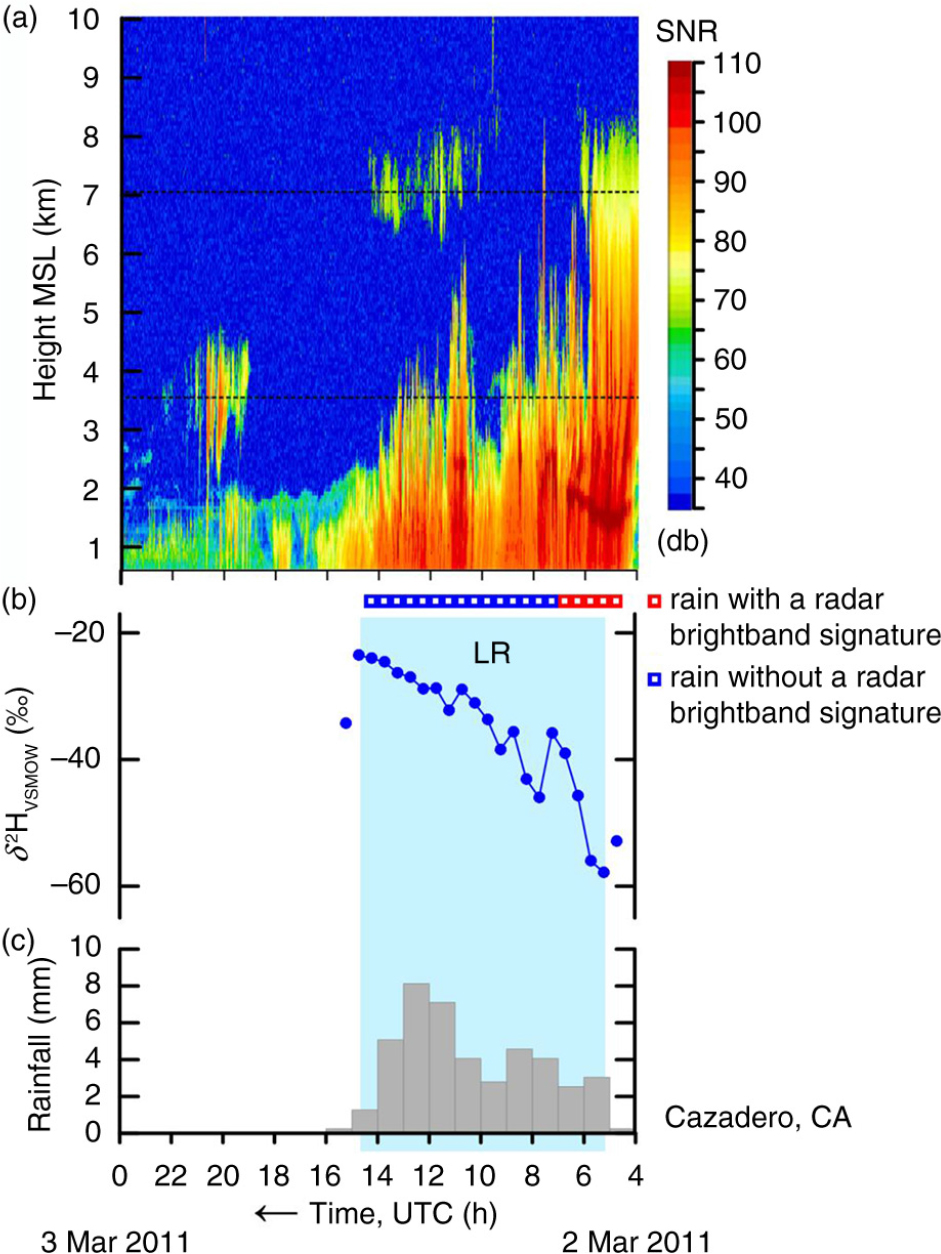
Fig. A20
(a) Time–height section of equivalent radar reflectivity factor with signal-to-noise ratio (SNR), (b) time series of δ 2HVSMOW values of 30-min, time-integrated precipitation samples and (c) histogram of hourly rainfall at Cazadero, CA, collected between 4 UTC 2 March 2011 and 0 UTC 3 March 2011. LR, blue panel, lower rainout, increasing or high δ 2HVSMOW values. Open squares indicate objective categorization of the rainfall occurring during selected half-hour periods. Dashed horizontal lines are KMUX NEXRAD 0.5-degree beam. Time increases from right to left. The date–time value of the first sample is estimated within ±2 h. The date–time values of the other samples are precise to within ±1 min relative to the first sample.
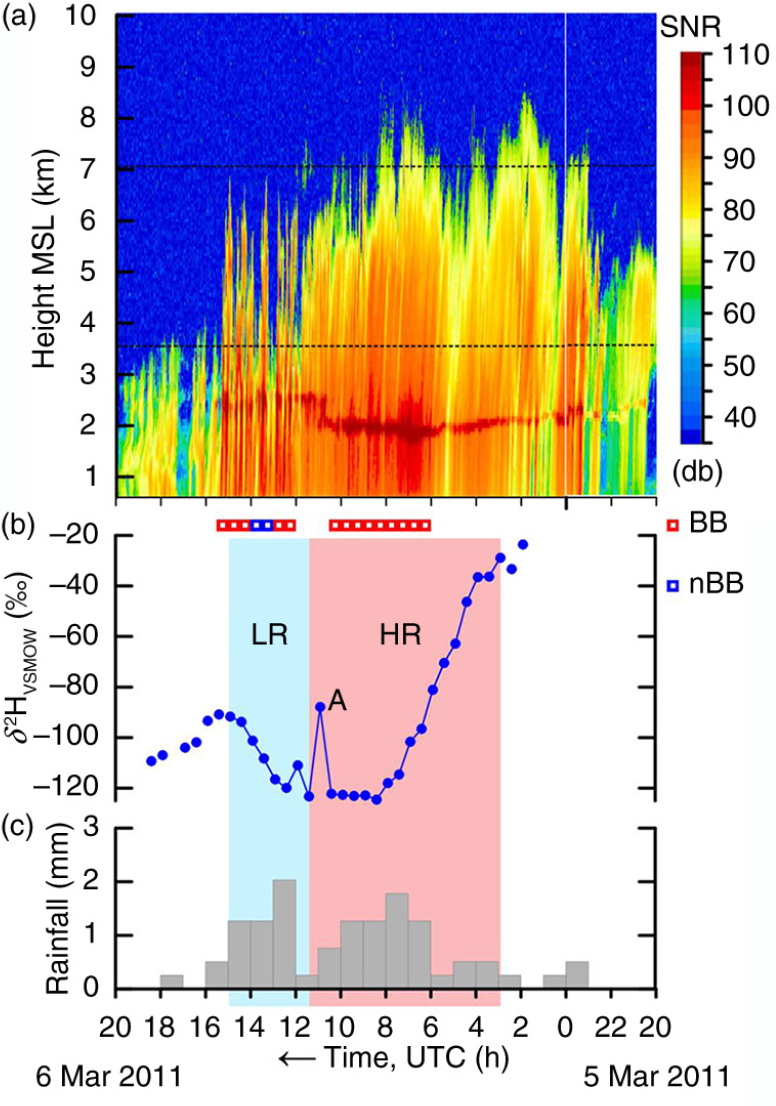
Fig. A21
(a) Time–height section of equivalent radar reflectivity factor with signal-to-noise ratio (SNR), (b) time series of δ 2HVSMOW values of 30-min, time-integrated precipitation samples and (c) histogram of hourly rainfall at Cazadero, CA, collected between 20 UTC 5 March 2011 and 20 UTC 6 March 2011. HR, pink panel, higher rainout, decreasing or low δ 2HVSMOW values. LR, blue panel, lower rainout, increasing or high δ 2HVSMOW values. Open squares indicate objective categorization of the rainfall occurring during selected half-hour periods. Dashed horizontal lines are KMUX NEXRAD 0.5-degree beam. Time increases from right to left. The date–time value of the first sample is estimated within ±2 h. The date–time values of the other samples are precise to within ±1 min relative to the first sample.
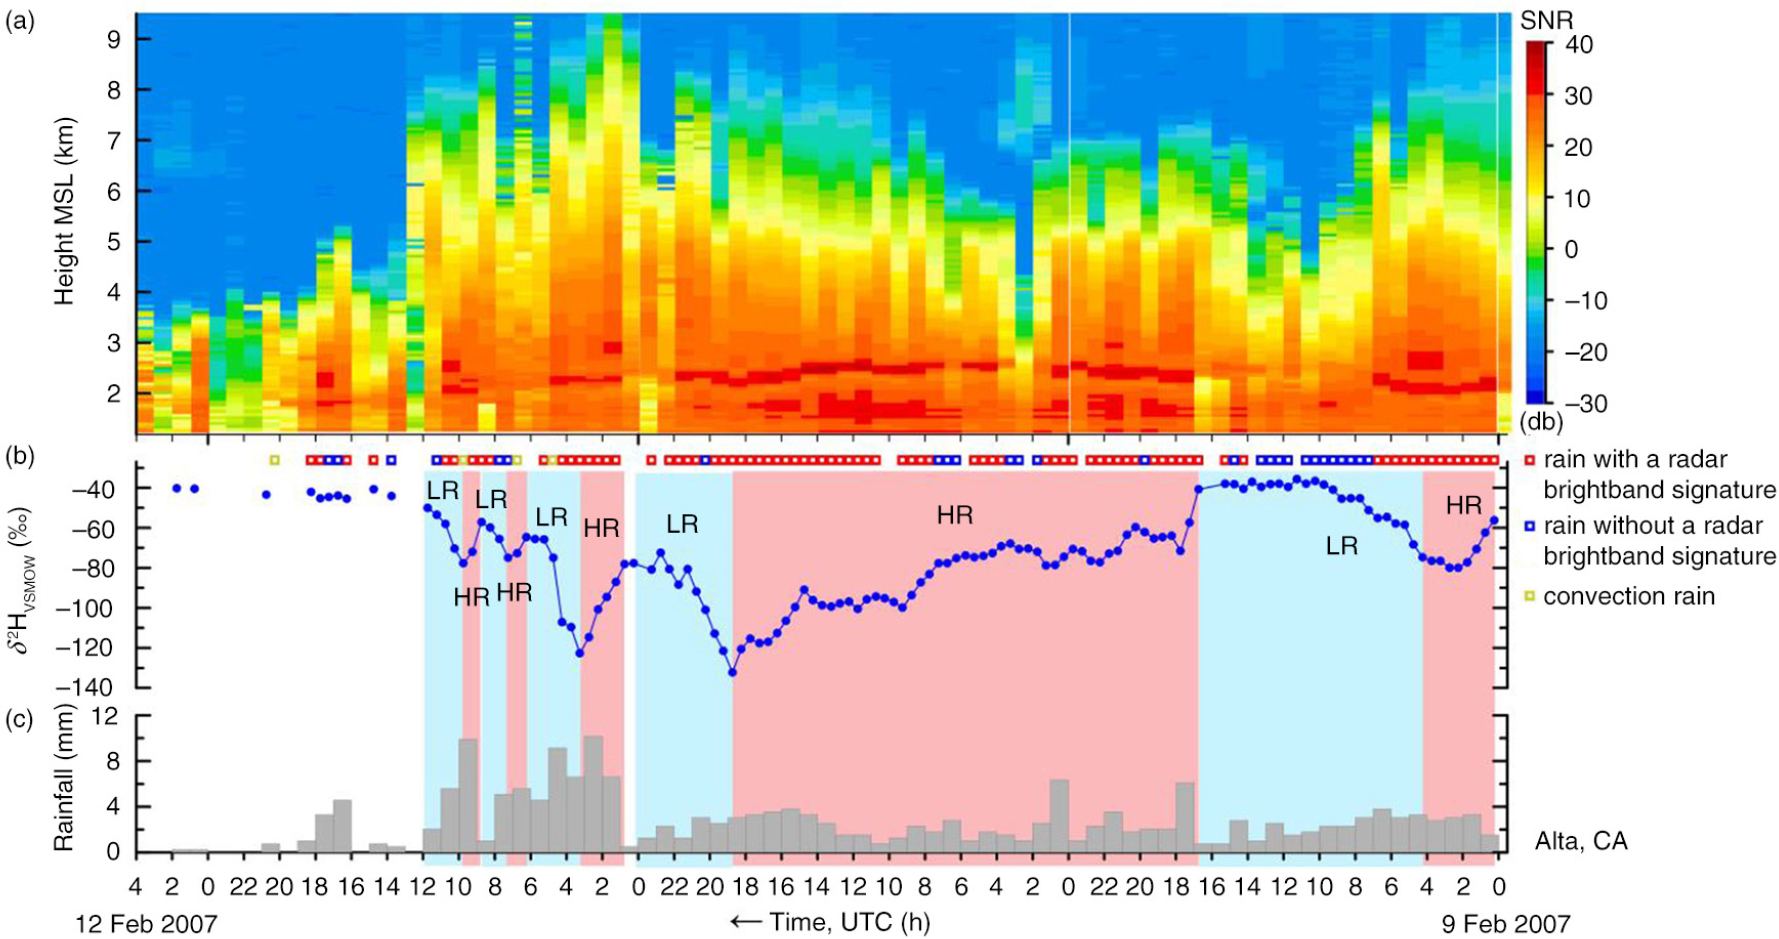
Fig. A22
(a) Time–height section of equivalent radar reflectivity factor with signal-to-noise ratio (SNR), (b) time series of δ 2HVSMOW values of 30-min, time-integrated precipitation samples and (c) histogram of hourly rainfall at Alta, CA, collected between 0 UTC 9 February 2007 and 4 UTC 12 February 2007. HR, pink panels, higher rainout, decreasing or low δ 2HVSMOW values. LR, blue panels, lower rainout, increasing or high δ 2HVSMOW values. Open squares indicate objective categorization of the rainfall occurring during selected half-hour periods. Time increases from right to left.
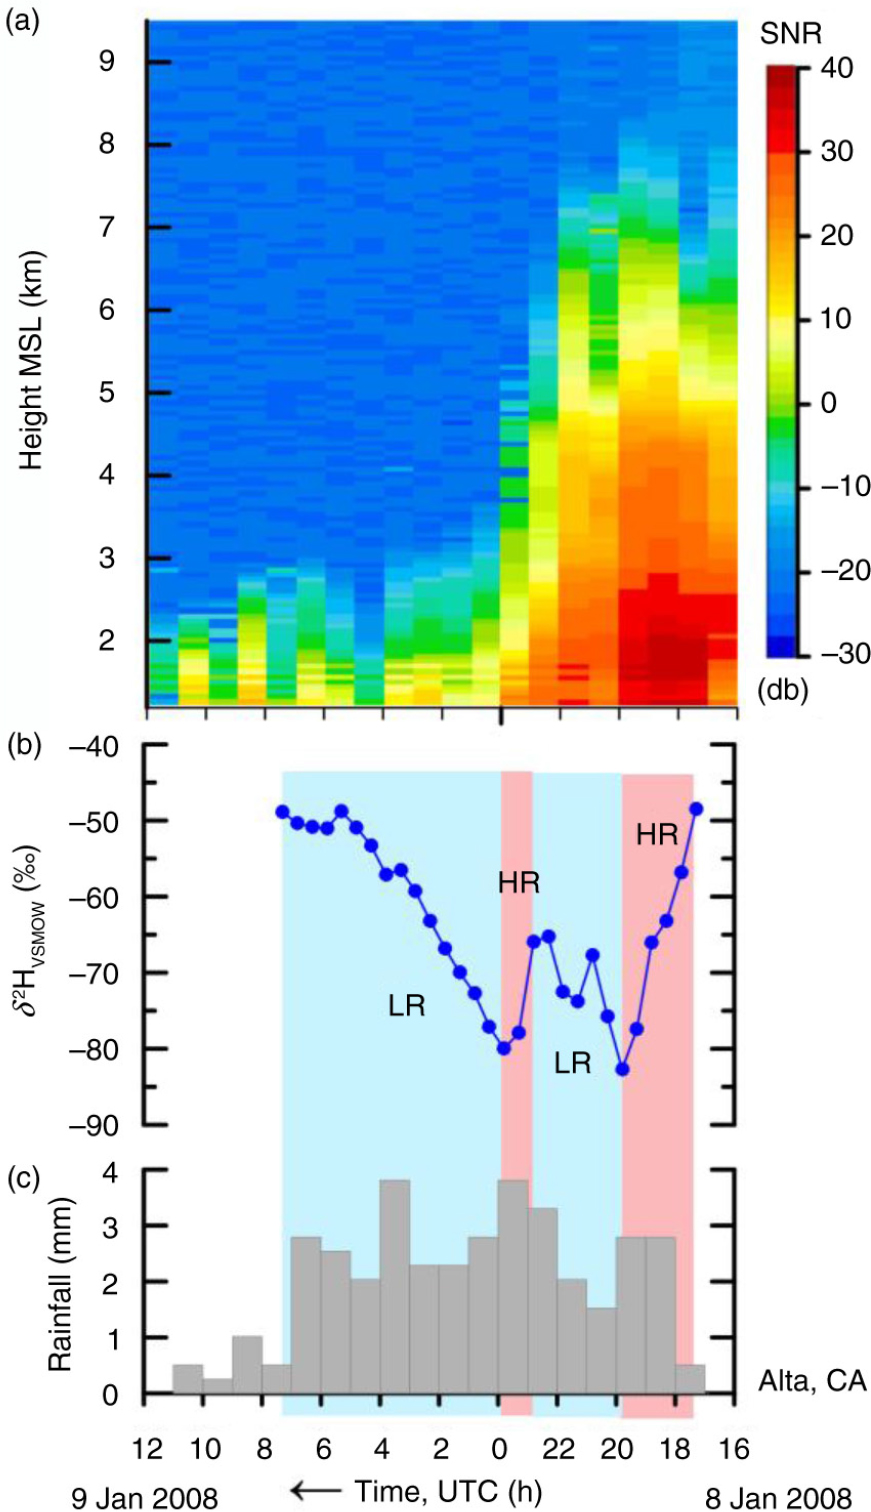
Fig. A23
(a) Time–height section of equivalent radar reflectivity factor with signal-to-noise ratio (SNR), (b) time series of δ 2HVSMOW values of 30-min, time-integrated precipitation samples and (c) histogram of hourly rainfall at Alta, CA, collected between 16 UTC 8 January 2008 and 12 UTC 9 January 2008. HR, pink panels, higher rainout, decreasing or low δ 2HVSMOW values. LR, blue panels, lower rainout, increasing or high δ 2HVSMOW values. Time increases from right to left.
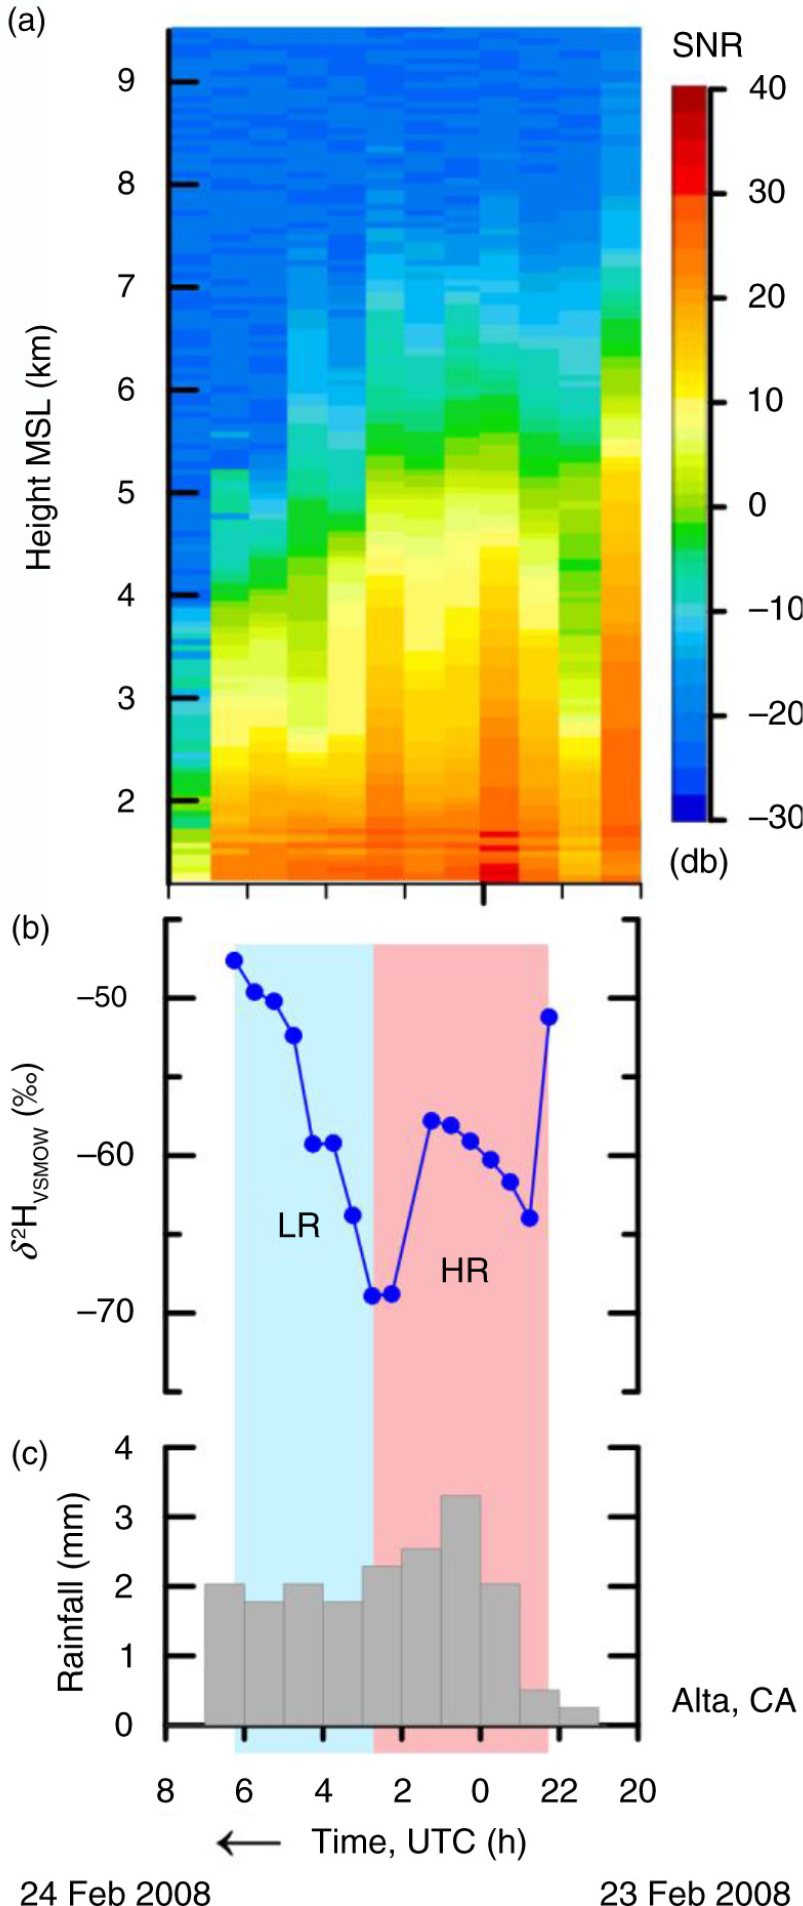
Fig. A24
(a) Time–height section of equivalent radar reflectivity factor with signal-to-noise ratio (SNR), (b) time series of δ 2HVSMOW values of 30-min, time-integrated precipitation samples and (c) histogram of hourly rainfall at Alta, CA, collected between 20 UTC 23 February 2008 and 8 UTC 24 February 2008. HR, pink panel, higher rainout, decreasing or low δ 2HVSMOW values. LR, blue panel, lower rainout, increasing or high δ 2HVSMOW values. Time increases from right to left.
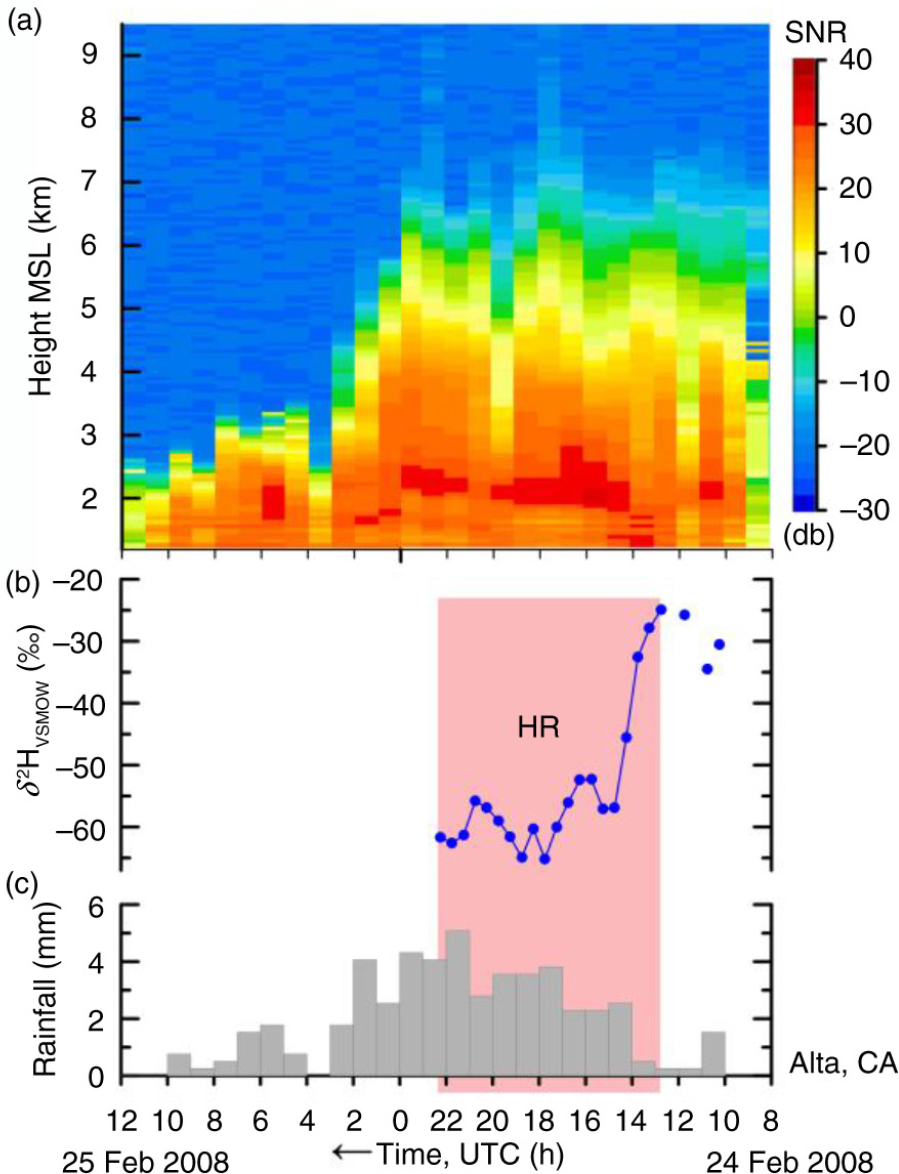
Fig. A25
(a) Time–height section of equivalent radar reflectivity factor with signal-to-noise ratio (SNR), (b) time series of δ 2HVSMOW values of 30-min, time-integrated precipitation samples and (c) histogram of hourly rainfall at Alta, CA, collected between 8 UTC 24 February 2008 and 12 UTC 25 February 2008. HR, pink panel, higher rainout, decreasing or low δ 2HVSMOW values. Time increases from right to left. No samples were collected after 23 UTC 24 February 2008 owing to collector-power problems.
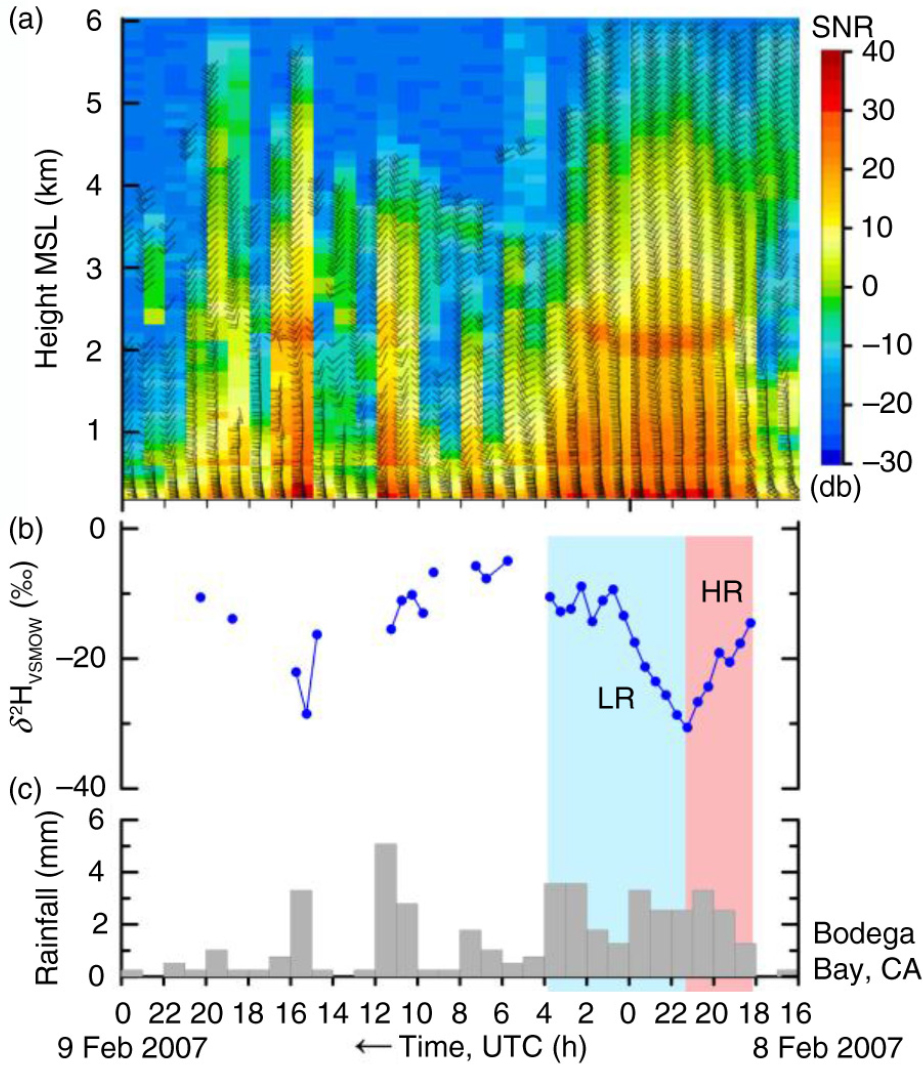
Fig. A26
(a) Time–height series of hourly wind profiles (flags: 25 m s−1; barbs: 5 m s−1; half-barbs: 2.5 m s−1) with signal-to-noise ratio (SNR), (b) time series of δ 2HVSMOW values of 30-min, time-integrated precipitation samples and (c) histogram of hourly rainfall at Bodega Bay, CA, collected between 16 UTC 8 February 2007 and 0 UTC 9 February 2007. HR, pink panel, higher rainout, decreasing or low δ 2HVSMOW values. LR, blue panel, lower rainout, increasing or high δ 2HVSMOW values. Time increases from right to left.
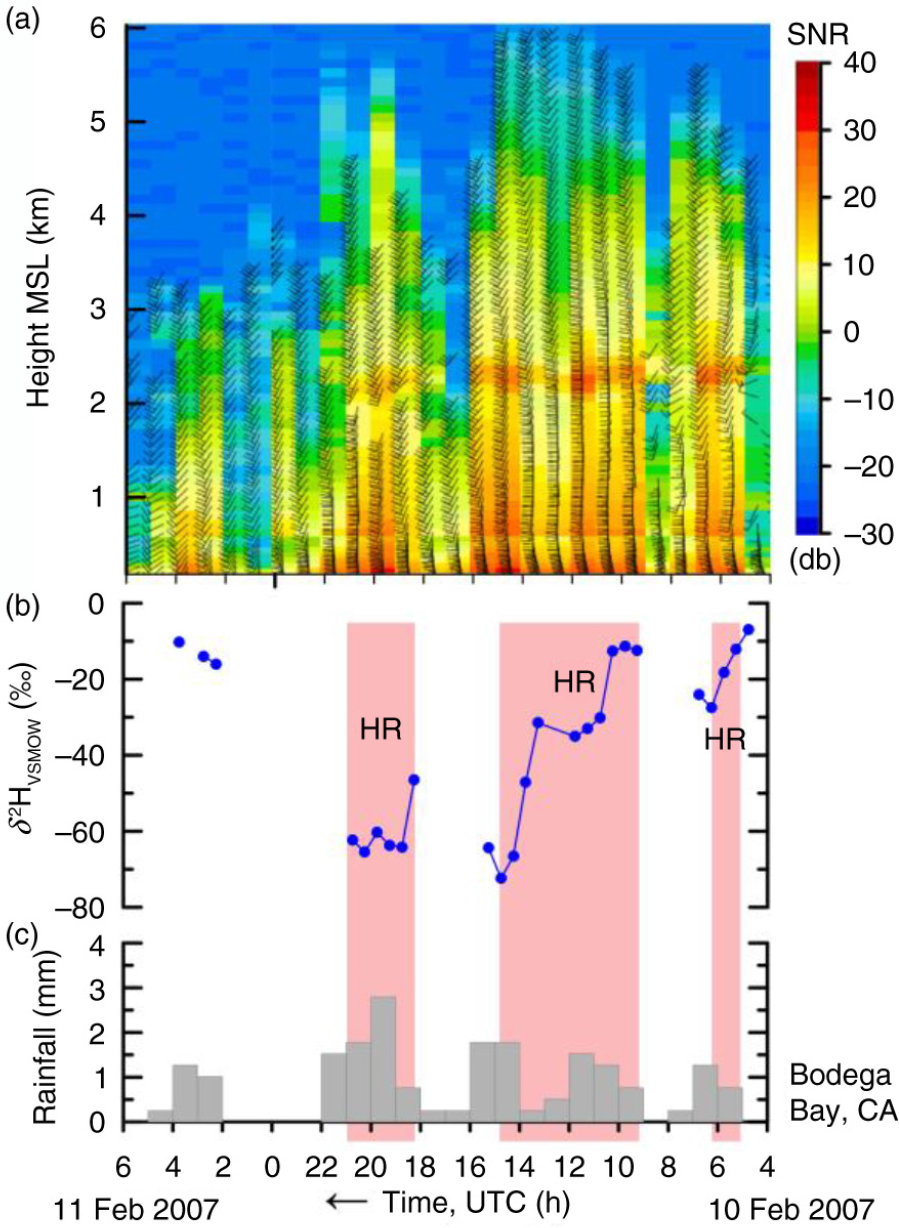
Fig. A27
(a) Time–height series of hourly wind profiles (flags: 25 m s−1; barbs: 5 m s−1; half-barbs: 2.5 m s−1) with signal-to-noise ratio (SNR), (b) time series of δ 2HVSMOW values of 30-min, time-integrated precipitation samples and (c) histogram of hourly rainfall at Bodega Bay, CA, collected between 4 UTC 10 February 2007 and 6 UTC 11 February 2007. HR, pink panels, higher rainout, decreasing or low δ 2HVSMOW values. Time increases from right to left.
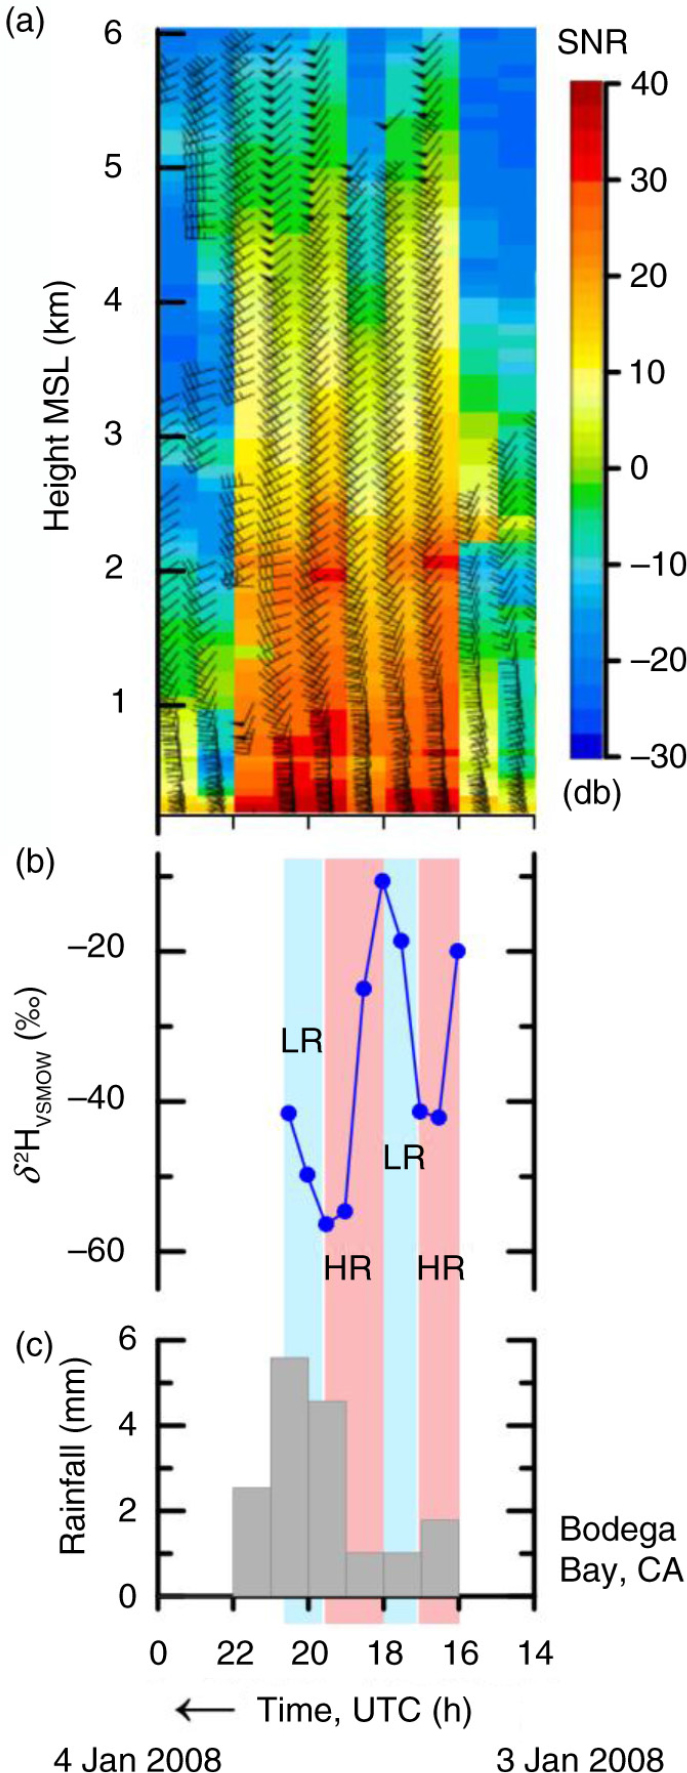
Fig. A28
(a) Time–height series of hourly wind profiles (flags: 25 m s−1; barbs: 5 m s−1; half-barbs: 2.5 m s−1) with signal-to-noise ratio (SNR), (b) time series of δ 2HVSMOW values of 30-min, time-integrated precipitation samples and (c) histogram of hourly rainfall at Bodega Bay, CA, collected between 14 UTC 3 January 2008 and 0 UTC 4 January 2008. HR, pink panels, higher rainout, decreasing or low δ 2HVSMOW values. LR, blue panels, lower rainout, increasing or high δ 2HVSMOW values. Time increases from right to left.
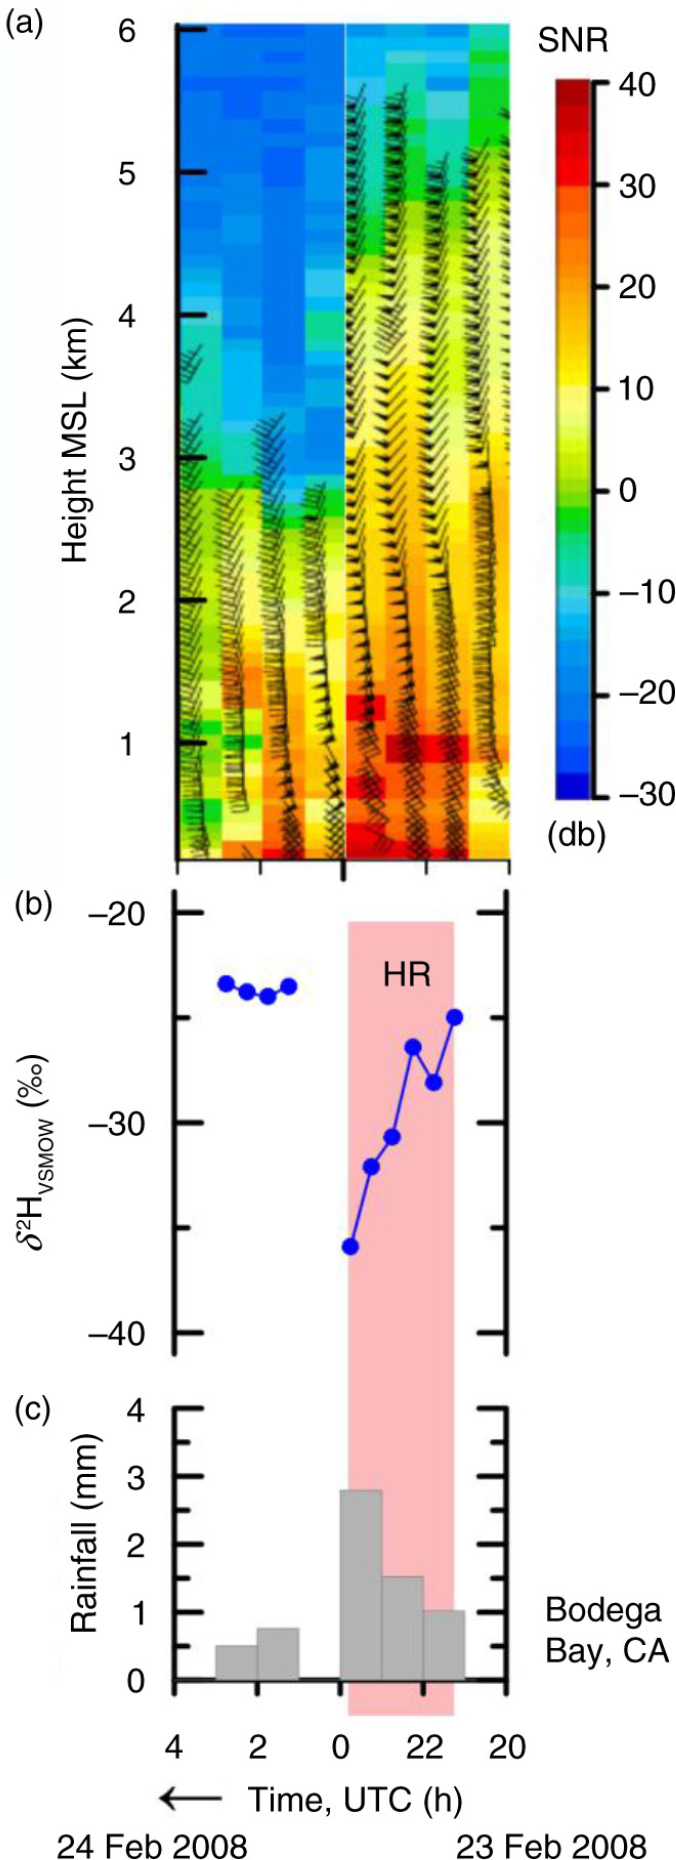
Fig. A29
(a) Time–height series of hourly wind profiles (flags: 25 m s−1; barbs: 5 m s−1; half-barbs: 2.5 m s−1) with signal-to-noise ratio (SNR), (b) time series of δ 2HVSMOW values of 30-min, time-integrated precipitation samples and (c) histogram of hourly rainfall at Bodega Bay, CA, collected between 20 UTC 23 February 2008 and 4 UTC 24 February 2008. HR, pink panel, higher rainout, decreasing or low δ 2HVSMOW values. Time increases from right to left.
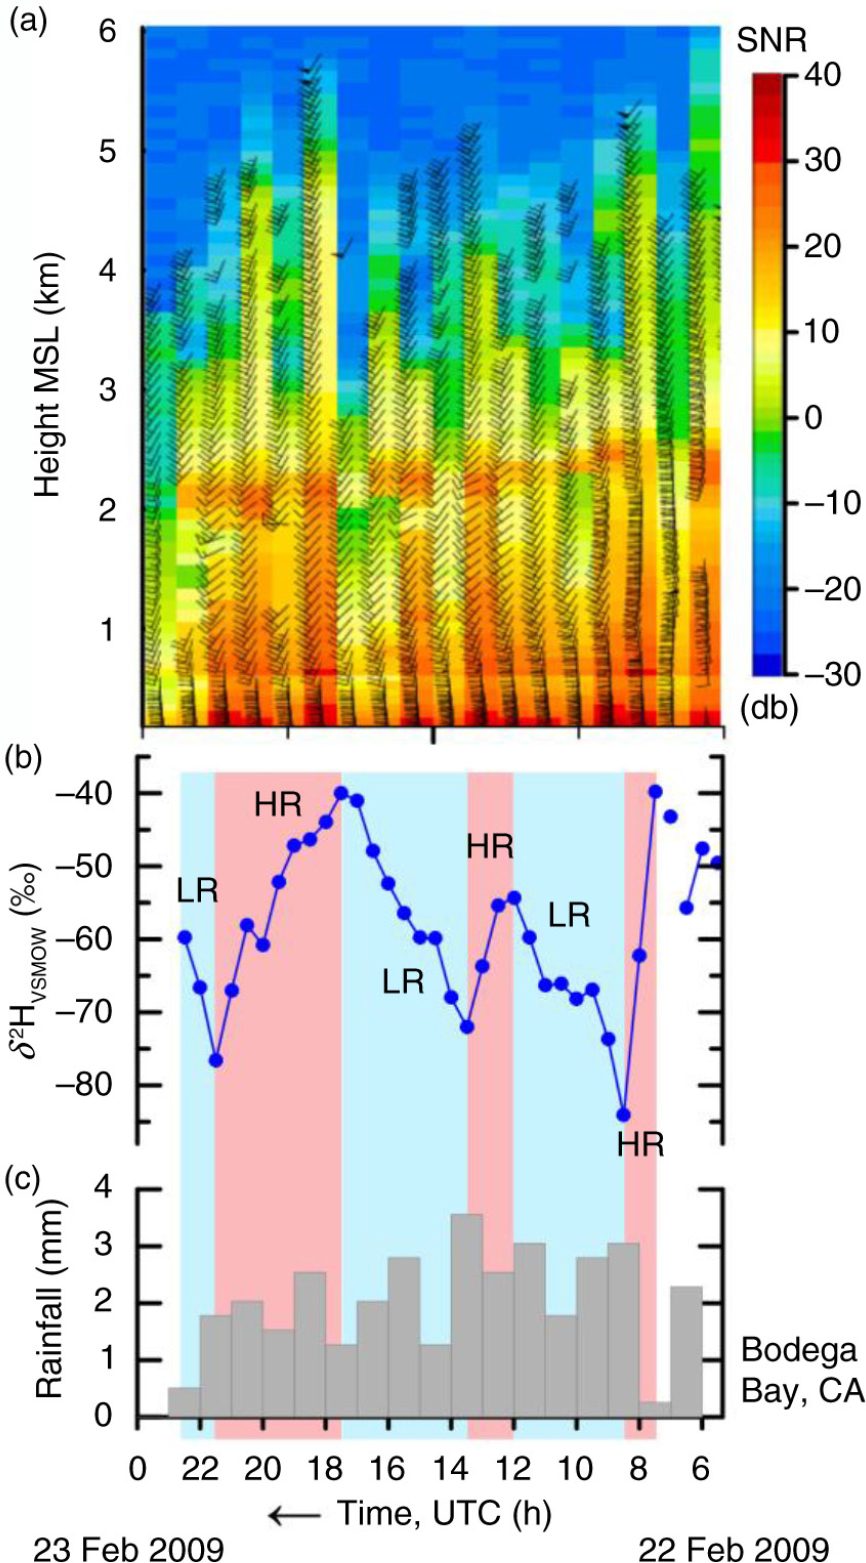
Fig. A30
(a) Time–height series of hourly wind profiles (flags: 25 m s−1; barbs: 5 m s−1; half-barbs: 2.5 m s−1) with signal-to-noise ratio (SNR), (b) time series of δ 2HVSMOW values of 30-min, time-integrated precipitation samples and (c) histogram of hourly rainfall at Bodega Bay, CA, collected between 6 UTC 22 February 2009 and 0 UTC 23 February 2009. HR, pink panels, higher rainout, decreasing or low δ 2HVSMOW values. LR, blue panels, lower rainout, increasing or high δ 2HVSMOW values. Time increases from right to left.
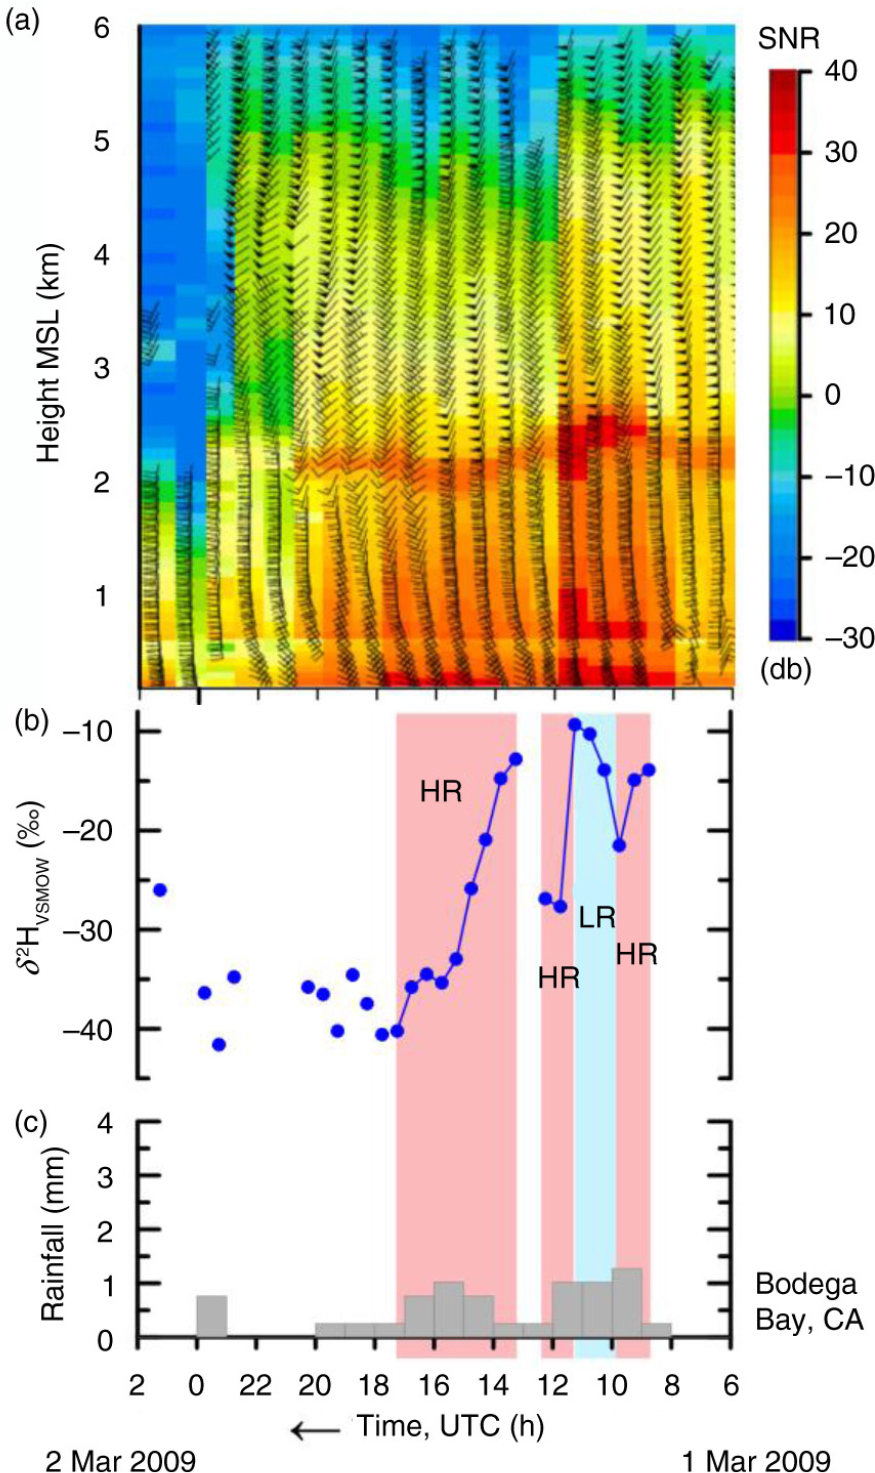
Fig. A31
(a) Time–height series of hourly wind profiles (flags: 25 m s−1; barbs: 5 m s−1; half-barbs: 2.5 m s−1) with signal-to-noise ratio (SNR), (b) time series of δ 2HVSMOW values of 30-min, time-integrated precipitation samples and (c) histogram of hourly rainfall at Bodega Bay, CA, collected between 6 UTC 1 March 2009 and 2 UTC 2 March 2009. HR, pink panels, higher rainout, decreasing or low δ 2HVSMOW values. LR, blue panel, lower rainout, increasing or high δ 2HVSMOW values. Time increases from right to left.
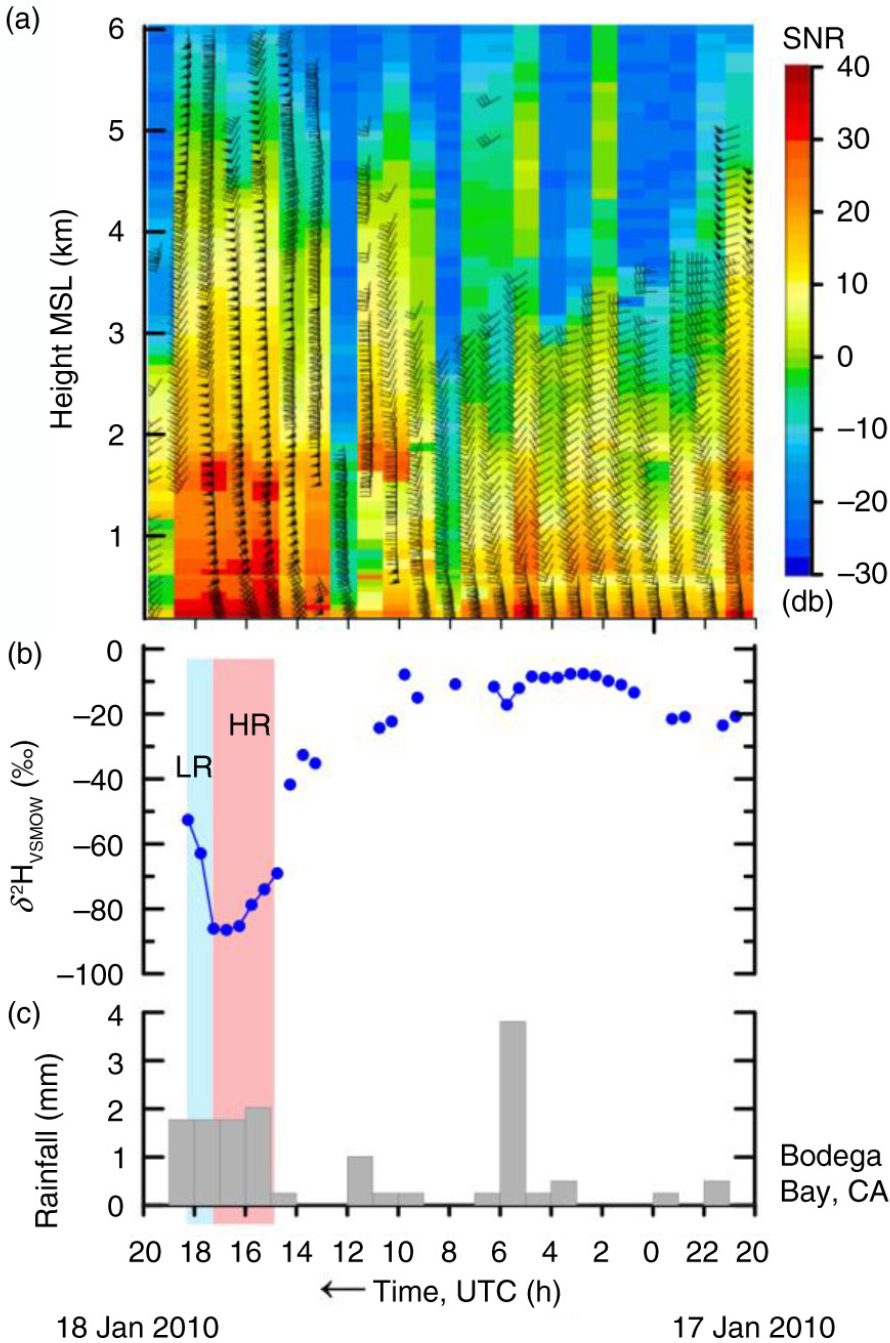
Fig. A32
(a) Time–height series of hourly wind profiles (flags: 25 m s−1; barbs: 5 m s−1; half-barbs: 2.5 m s−1) with signal-to-noise ratio, NR, (b) time series of δ 2HVSMOW values of 30-min, time-integrated precipitation samples and (c) histogram of hourly rainfall at Bodega Bay, CA, collected between 20 UTC 17 January 2010 and 20 UTC 18 January 2010. HR, pink panel, higher rainout, decreasing or low δ 2HVSMOW values. LR, blue panel, lower rainout, increasing or high δ 2HVSMOW values. Time increases from right to left.
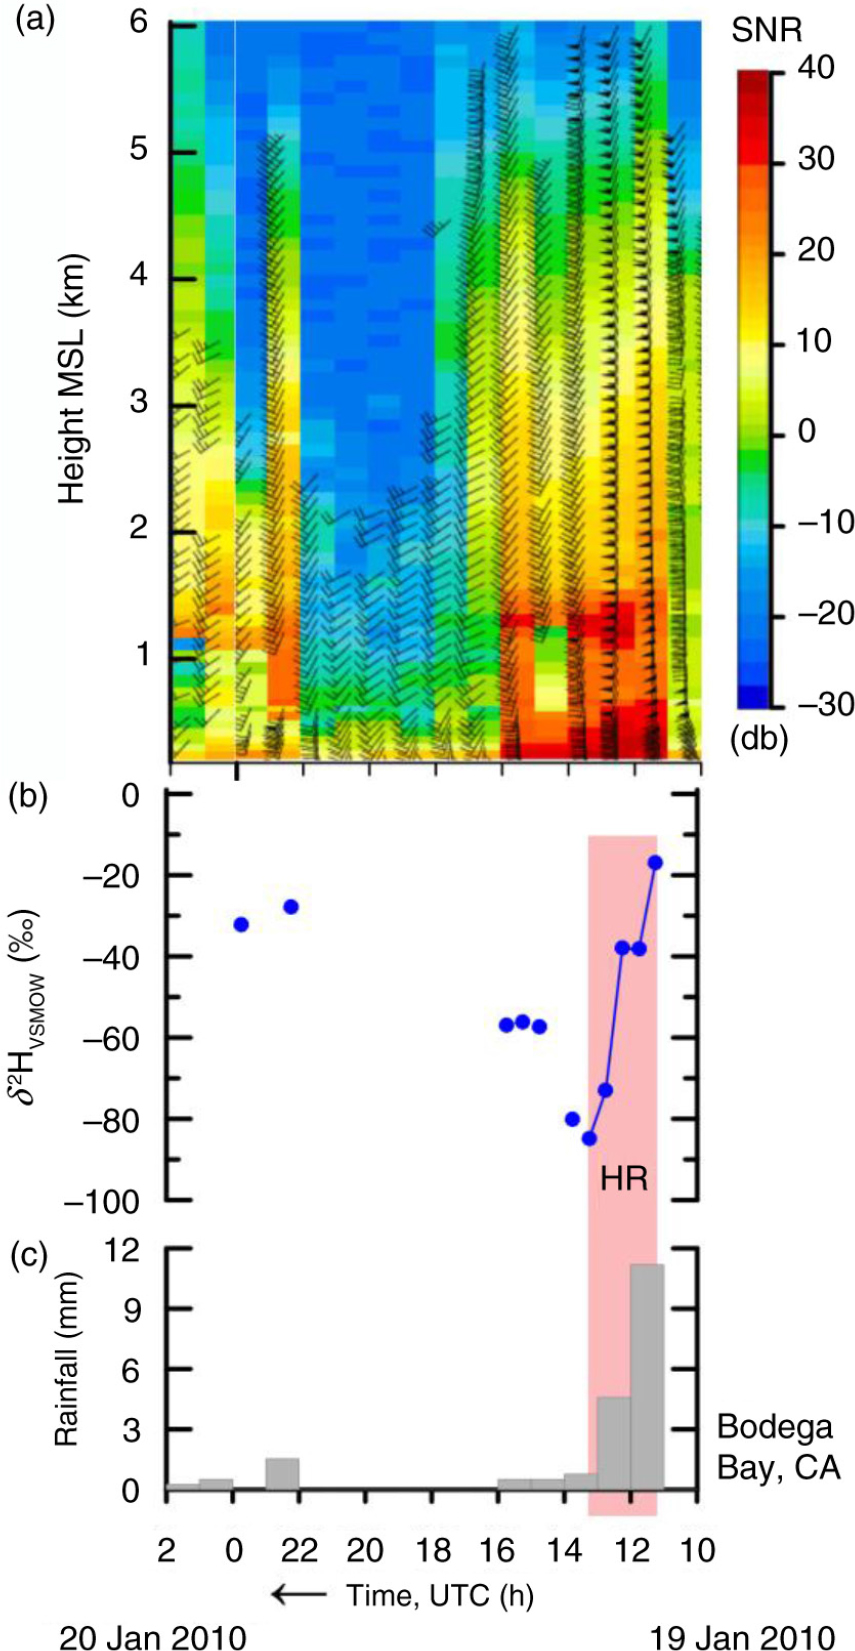
Fig. A33
(a) Time–height series of hourly wind profiles (flags: 25 m s−1; barbs: 5 m s−1; half-barbs: 2.5 m s−1) with signal-to-noise ratio, (SNR), (b) time series of δ 2HVSMOW values of 30-min, time-integrated precipitation samples and (c) histogram of hourly rainfall at Bodega Bay, CA, collected between 10 UTC 19 January 2010 and 2 UTC 20 January 2010. HR, pink panel, higher rainout, decreasing or low δ 2HVSMOW values. Time increases from right to left.
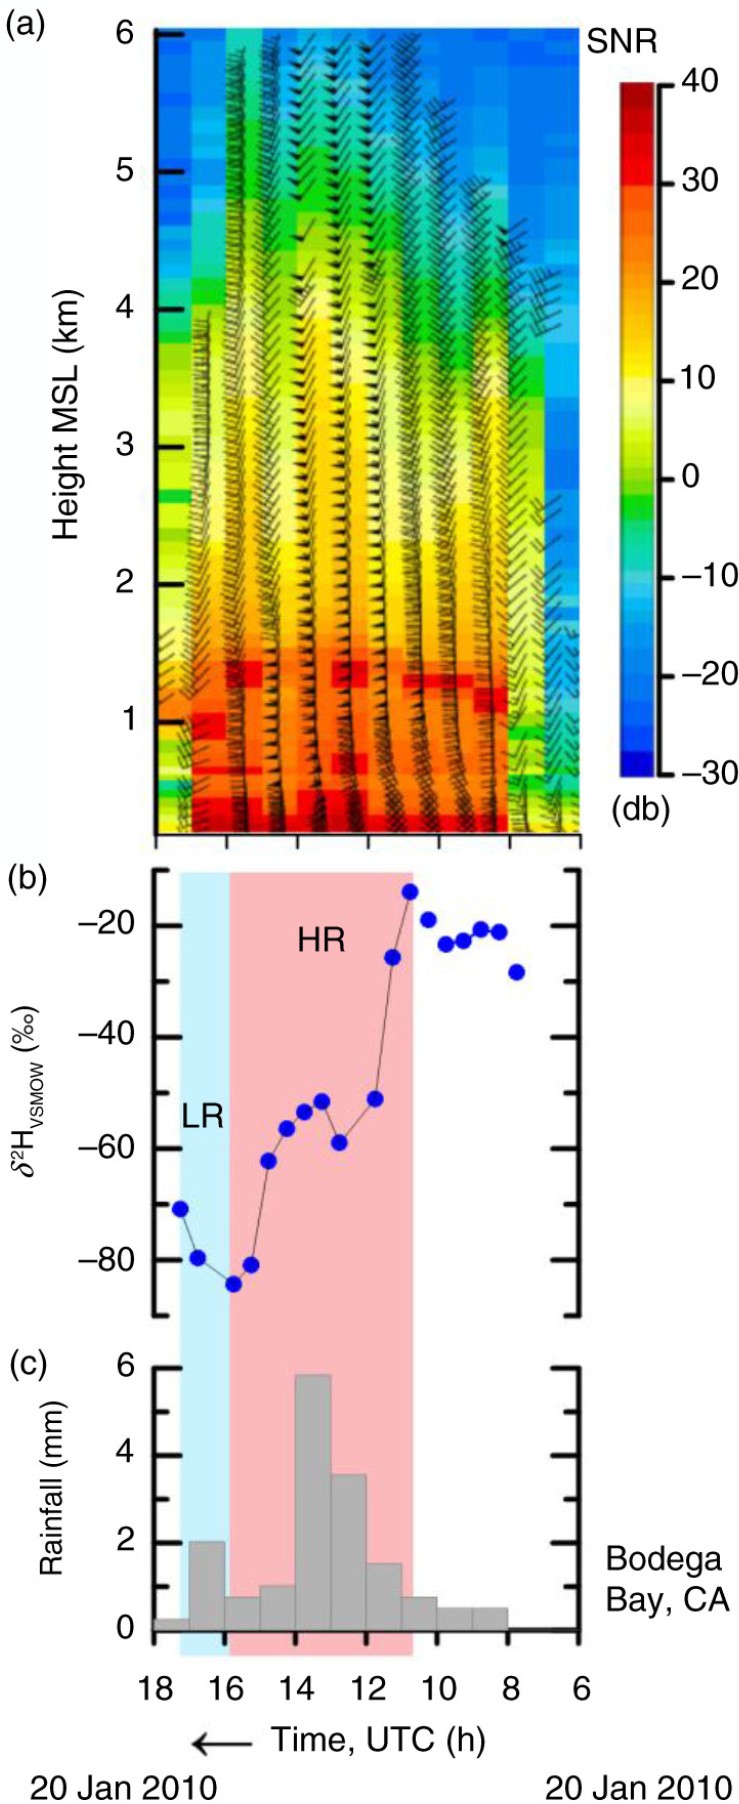
Fig. A34
(a) Time–height series of hourly wind profiles (flags: 25 m s−1; barbs: 5 m s−1; half-barbs: 2.5 m s−1) with signal-to-noise ratio (SNR), (b) time series of δ 2HVSMOW values of 30-min, time-integrated precipitation samples and (c) histogram of hourly rainfall at Bodega Bay, CA, collected between 6 and 18 UTC 20 January 2010. HR, pink panel, higher rainout, decreasing or low δ 2HVSMOW values. LR, blue panel, lower rainout, increasing or high δ 2HVSMOW values. Time increases from right to left.
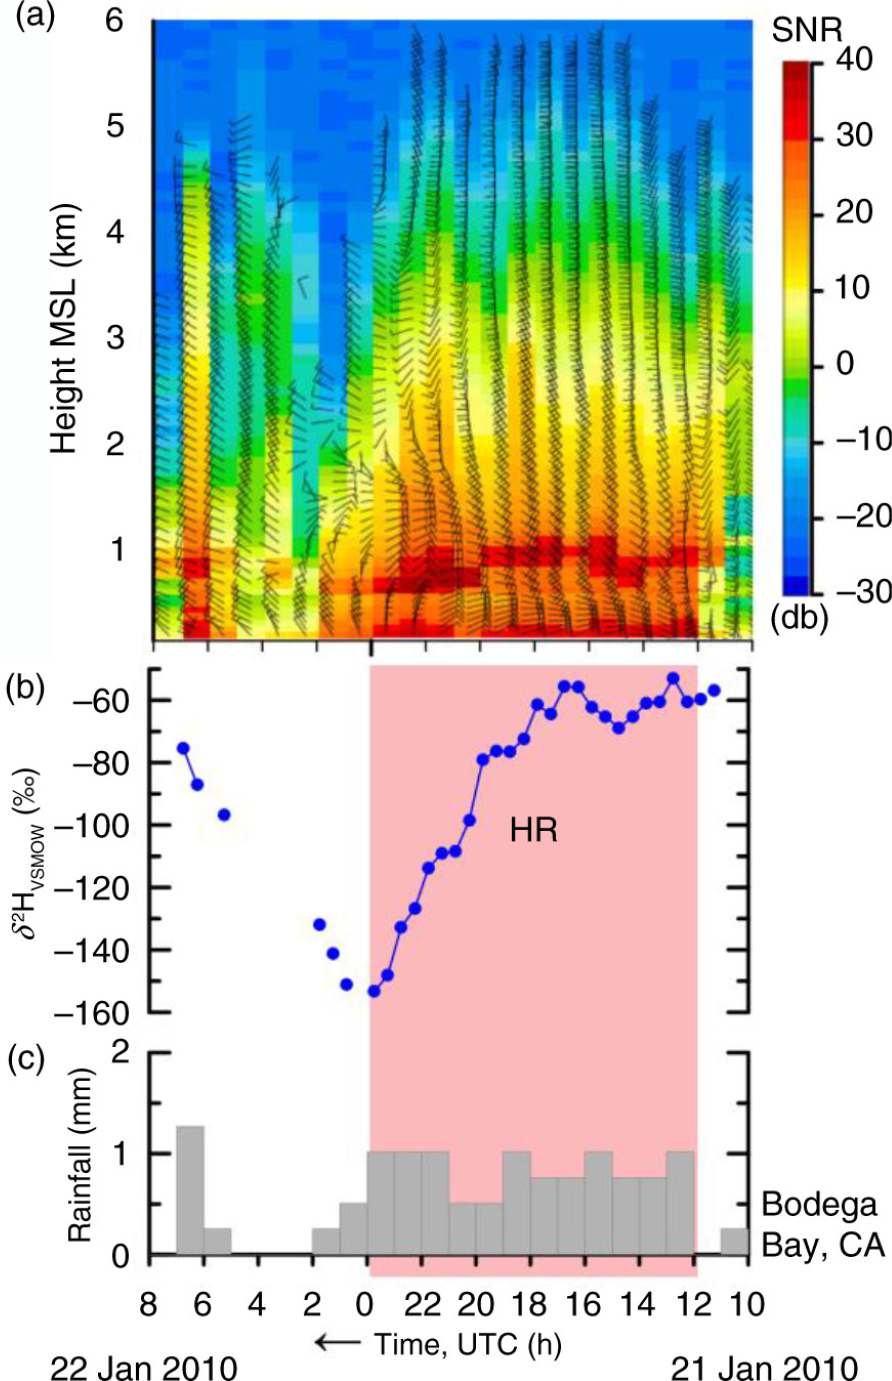
Fig. A35
(a) Time–height series of hourly wind profiles (flags: 25 m s−1; barbs: 5 m s−1; half-barbs: 2.5 m s−1) with signal-to-noise ratio (SNR), (b) time series of δ 2HVSMOW values of 30-min, time-integrated precipitation samples and (c) histogram of hourly rainfall at Bodega Bay, CA, collected between 10 UTC 21 January 2010 and 8 UTC 22 January 2010. HR, pink panel, higher rainout, decreasing or low δ 2HVSMOW values. Time increases from right to left.
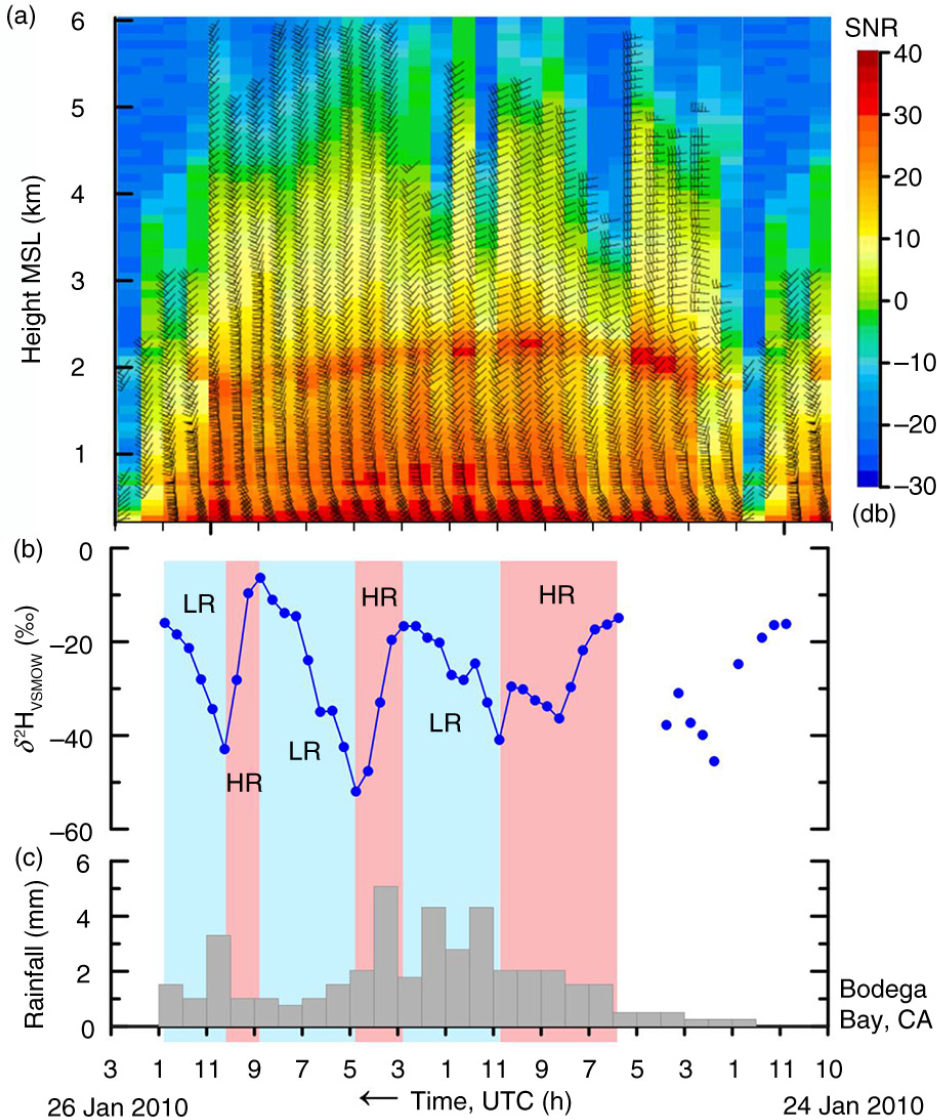
Fig. A36
(a) Time–height series of hourly wind profiles (flags: 25 m s−1; barbs: 5 m s−1; half-barbs: 2.5 m s−1) with signal-to-noise ratio (SNR), (b) time series of δ 2HVSMOW values of 30-min, time-integrated precipitation samples and (c) histogram of hourly rainfall at Bodega Bay, CA, collected between 22 UTC 24 January 2010 and 4 UTC 26 January 2010. HR, pink panels, higher rainout, decreasing or low δ 2HVSMOW values. LR, blue panels, lower rainout, increasing or high δ 2HVSMOW values. Time increases from right to left.
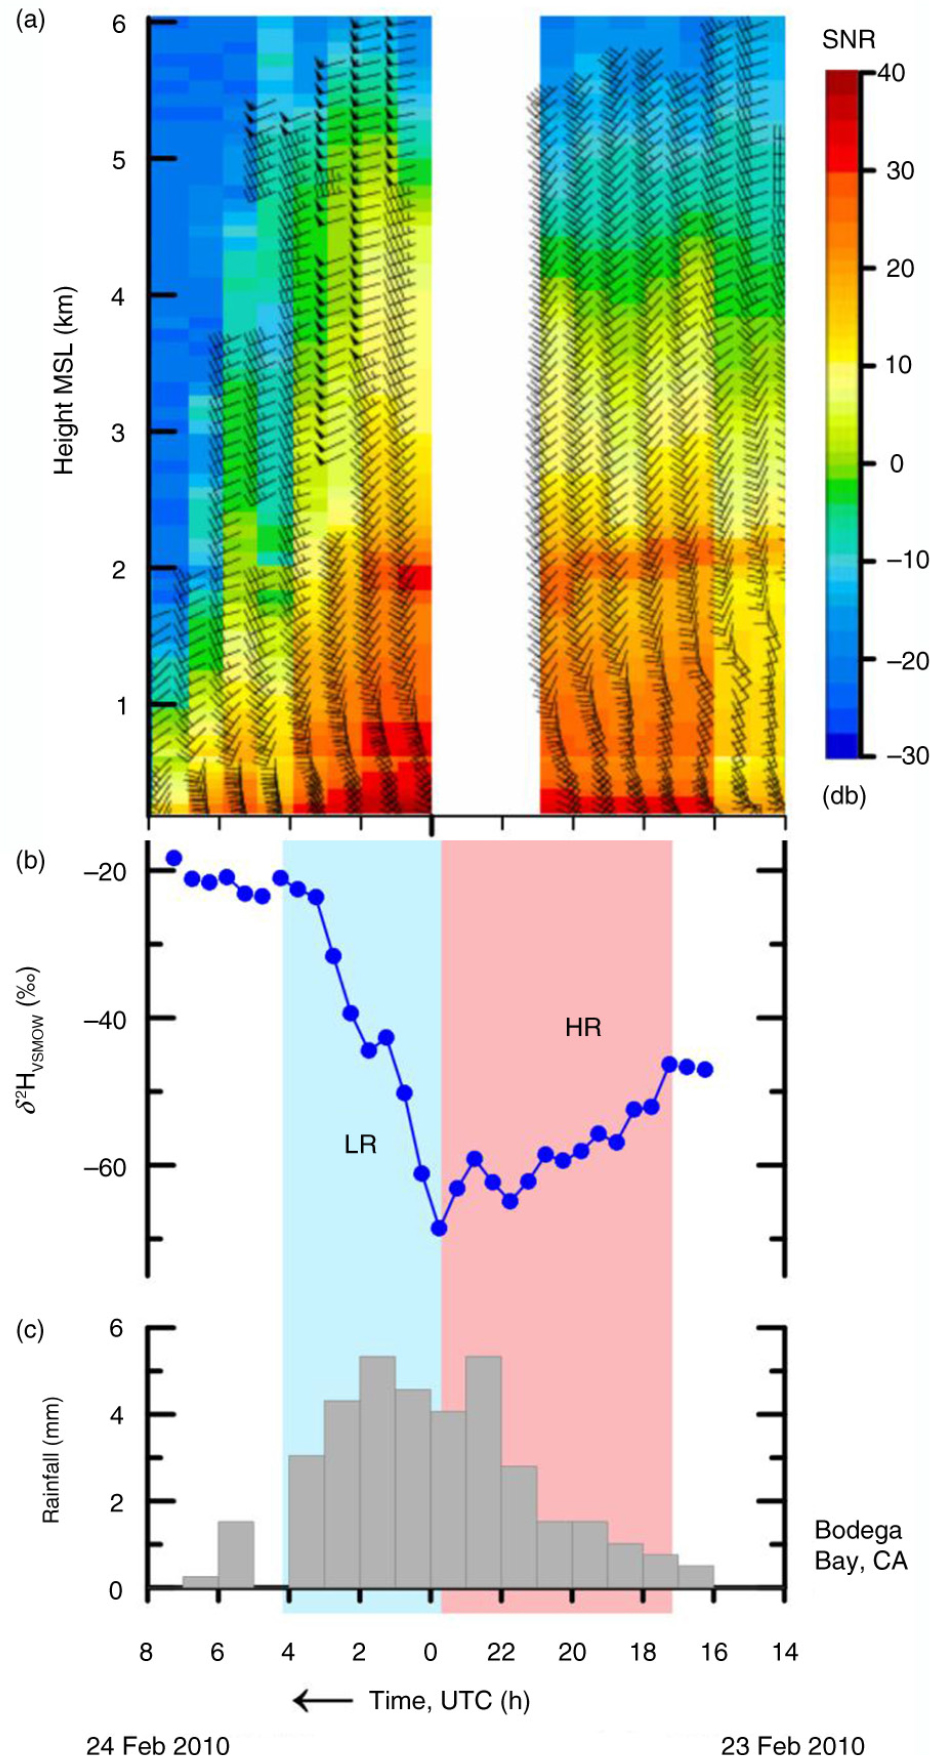
Fig. A37
(a) Time–height series of hourly wind profiles (flags: 25 m s−1; barbs: 5 m s−1; half-barbs: 2.5 m s−1) with signal-to-noise ratio (SNR), (b) time series of δ 2HVSMOW values of 30-min, time-integrated precipitation samples and (c) histogram of hourly rainfall at Bodega Bay, CA, collected between 14 UTC 23 February 2010 and 8 UTC 24 February 2010. HR, pink panel, higher rainout, decreasing or low δ 2HVSMOW values. LR, blue panel, lower rainout, increasing or high δ 2HVSMOW values. During a 3-hour period (21 UTC 23 February 2010 to 0 UTC 24 February 2010) wind-profiling data were not acquired. Time increases from right to left.
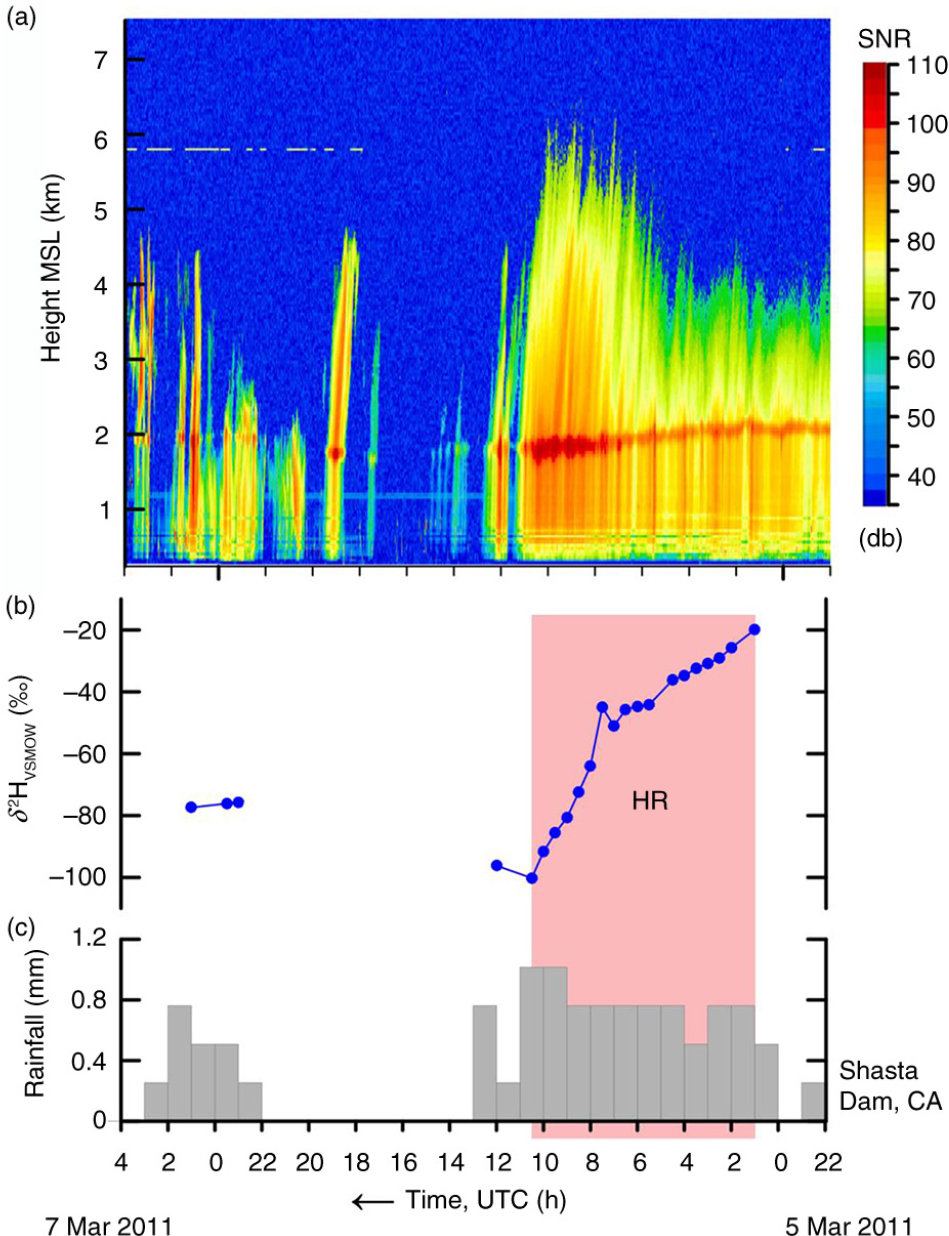
Fig. A38
(a) Time–height section of equivalent radar reflectivity factor with signal-to-noise ratio (SNR), (b) time series of δ 2HVSMOW values of 30-min, time-integrated precipitation samples and (c) histogram of hourly rainfall at Shasta Dam, CA, collected between 22 UTC 5 March 2011 and 4 UTC 7 March 2011. HR, pink panel, higher rainout, decreasing or low δ 2HVSMOW values. Time increases from right to left.