
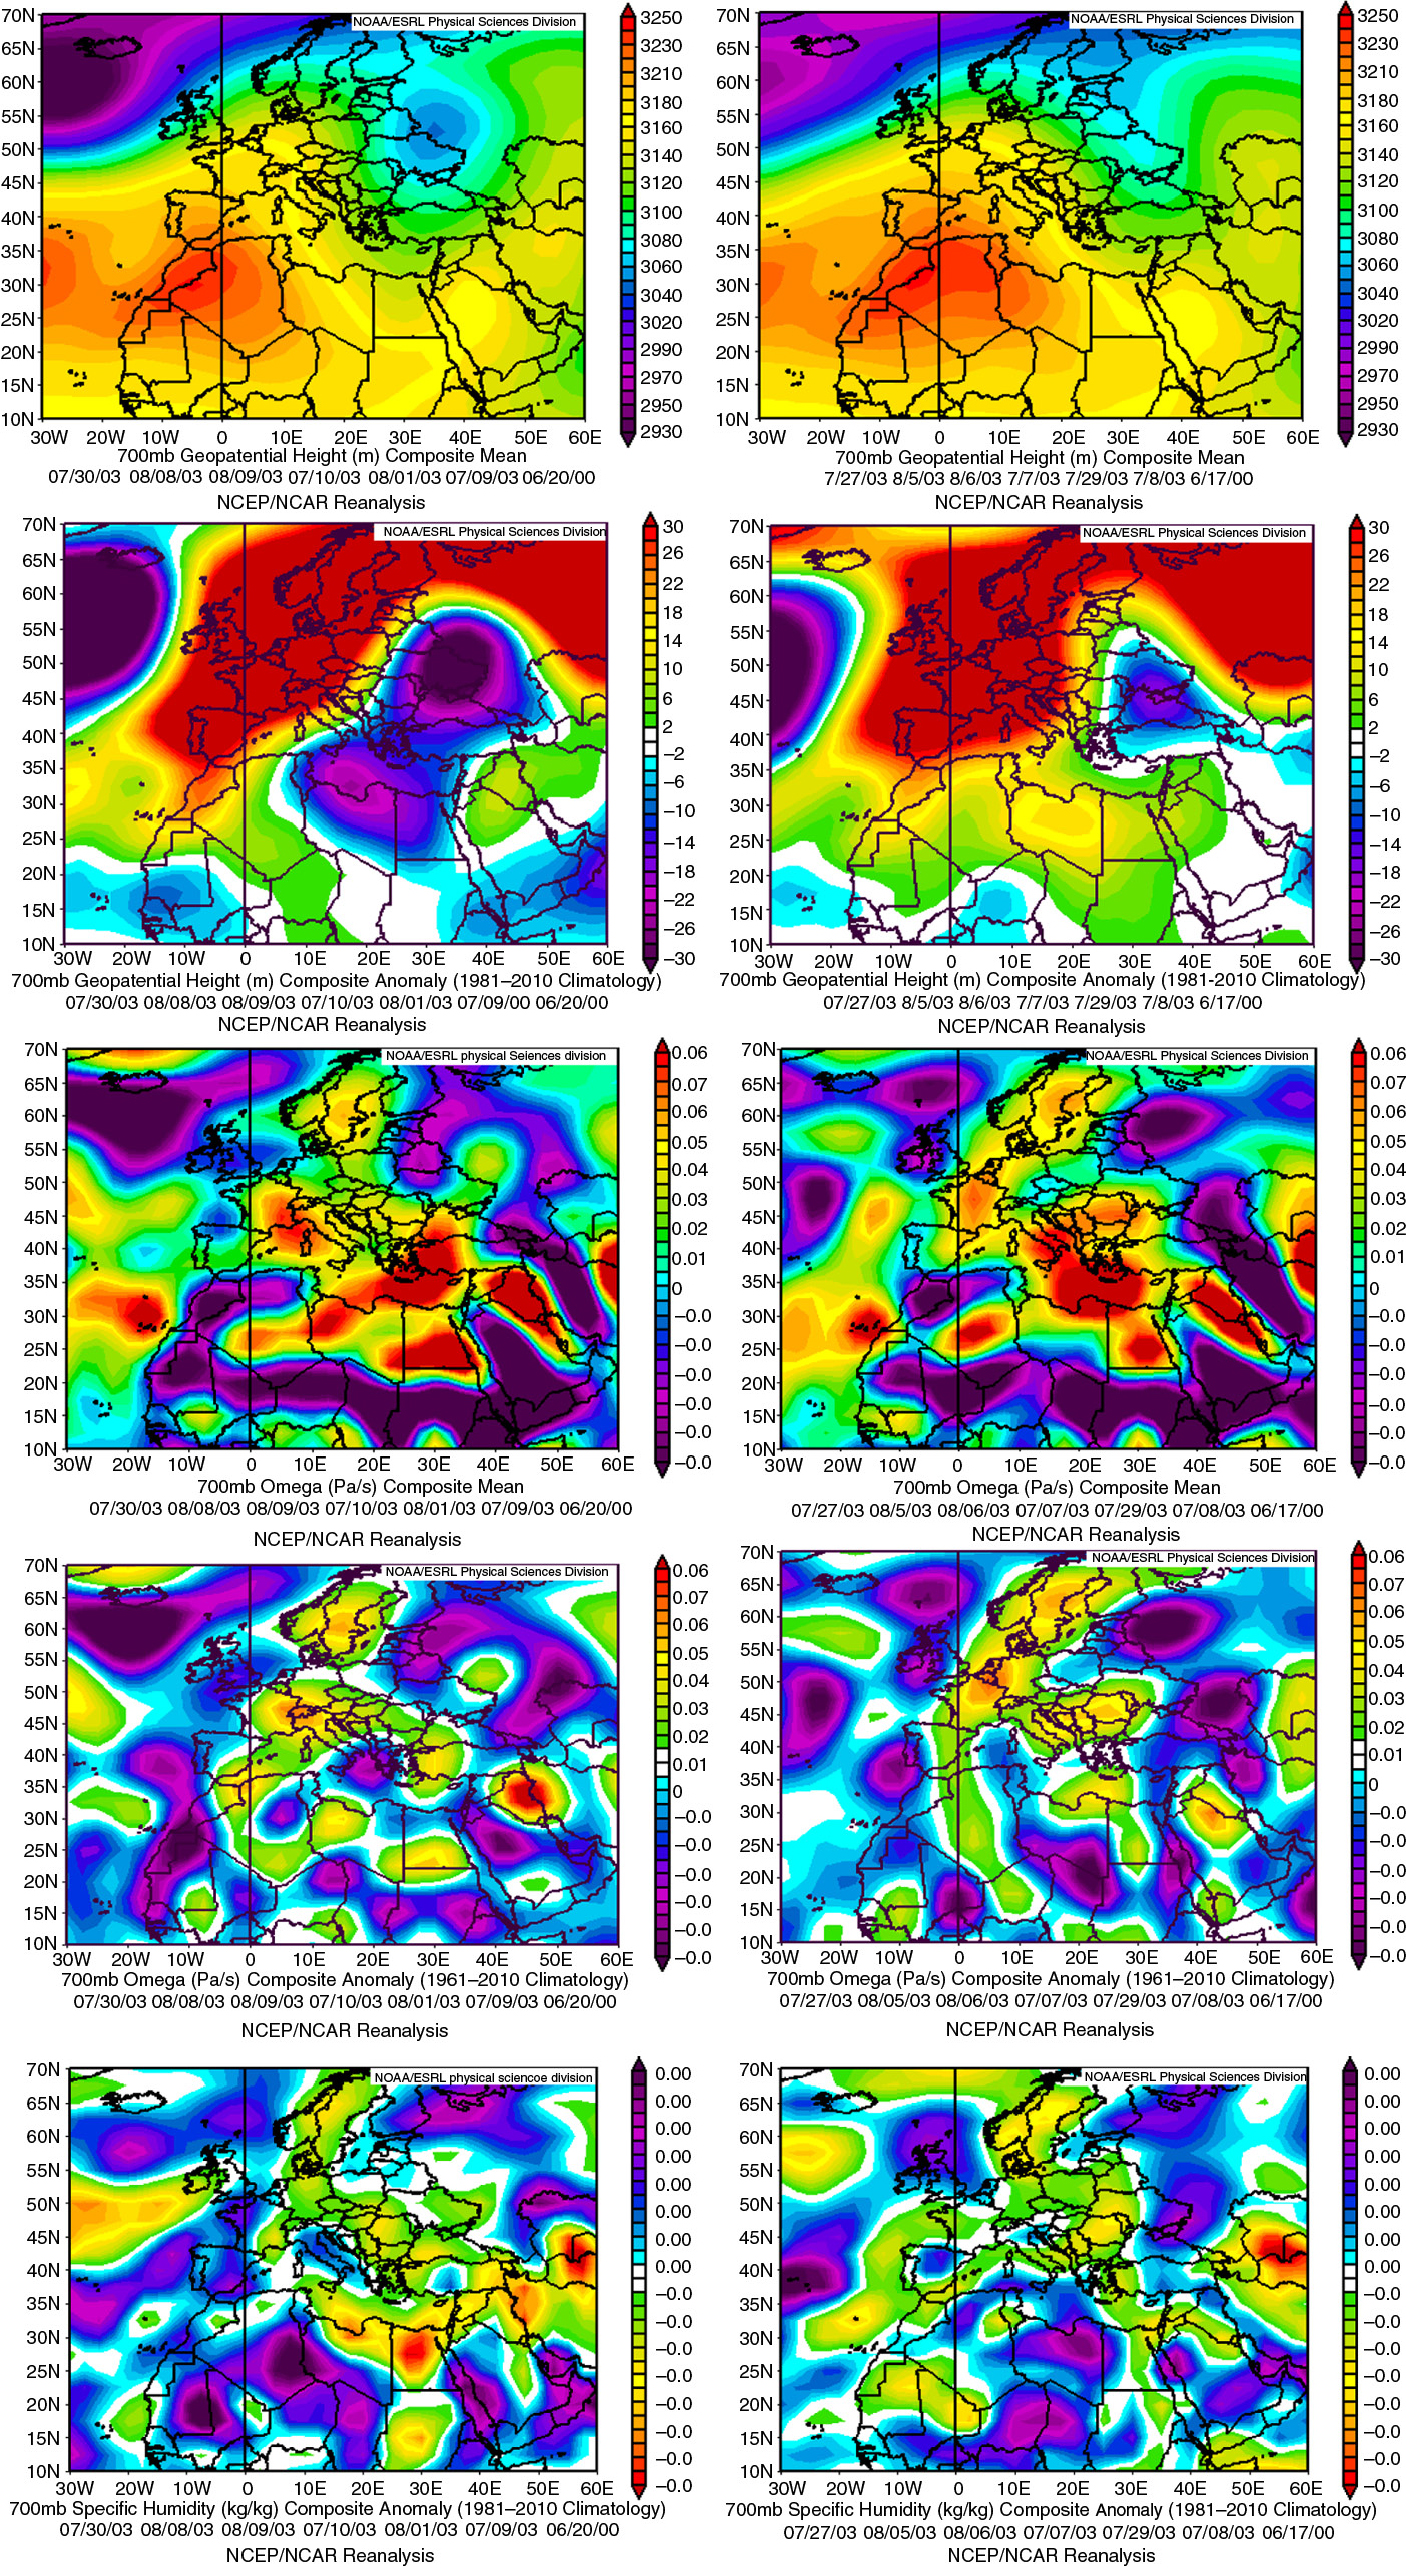
Fig. 1
Composite weather maps at 700 hPa of geopotential height, geopotential height anomaly, vertical velocity (omega), vertical velocity anomaly, specific humidity anomaly, precipitable water anomaly (columnar), air temperature anomaly and vector wind of the 7% of the days with the highest vertical summer ozone concentrations at the 1.5–5 km layer over Cairo during the day of the measurement (left column) and 3-d ago (right column).
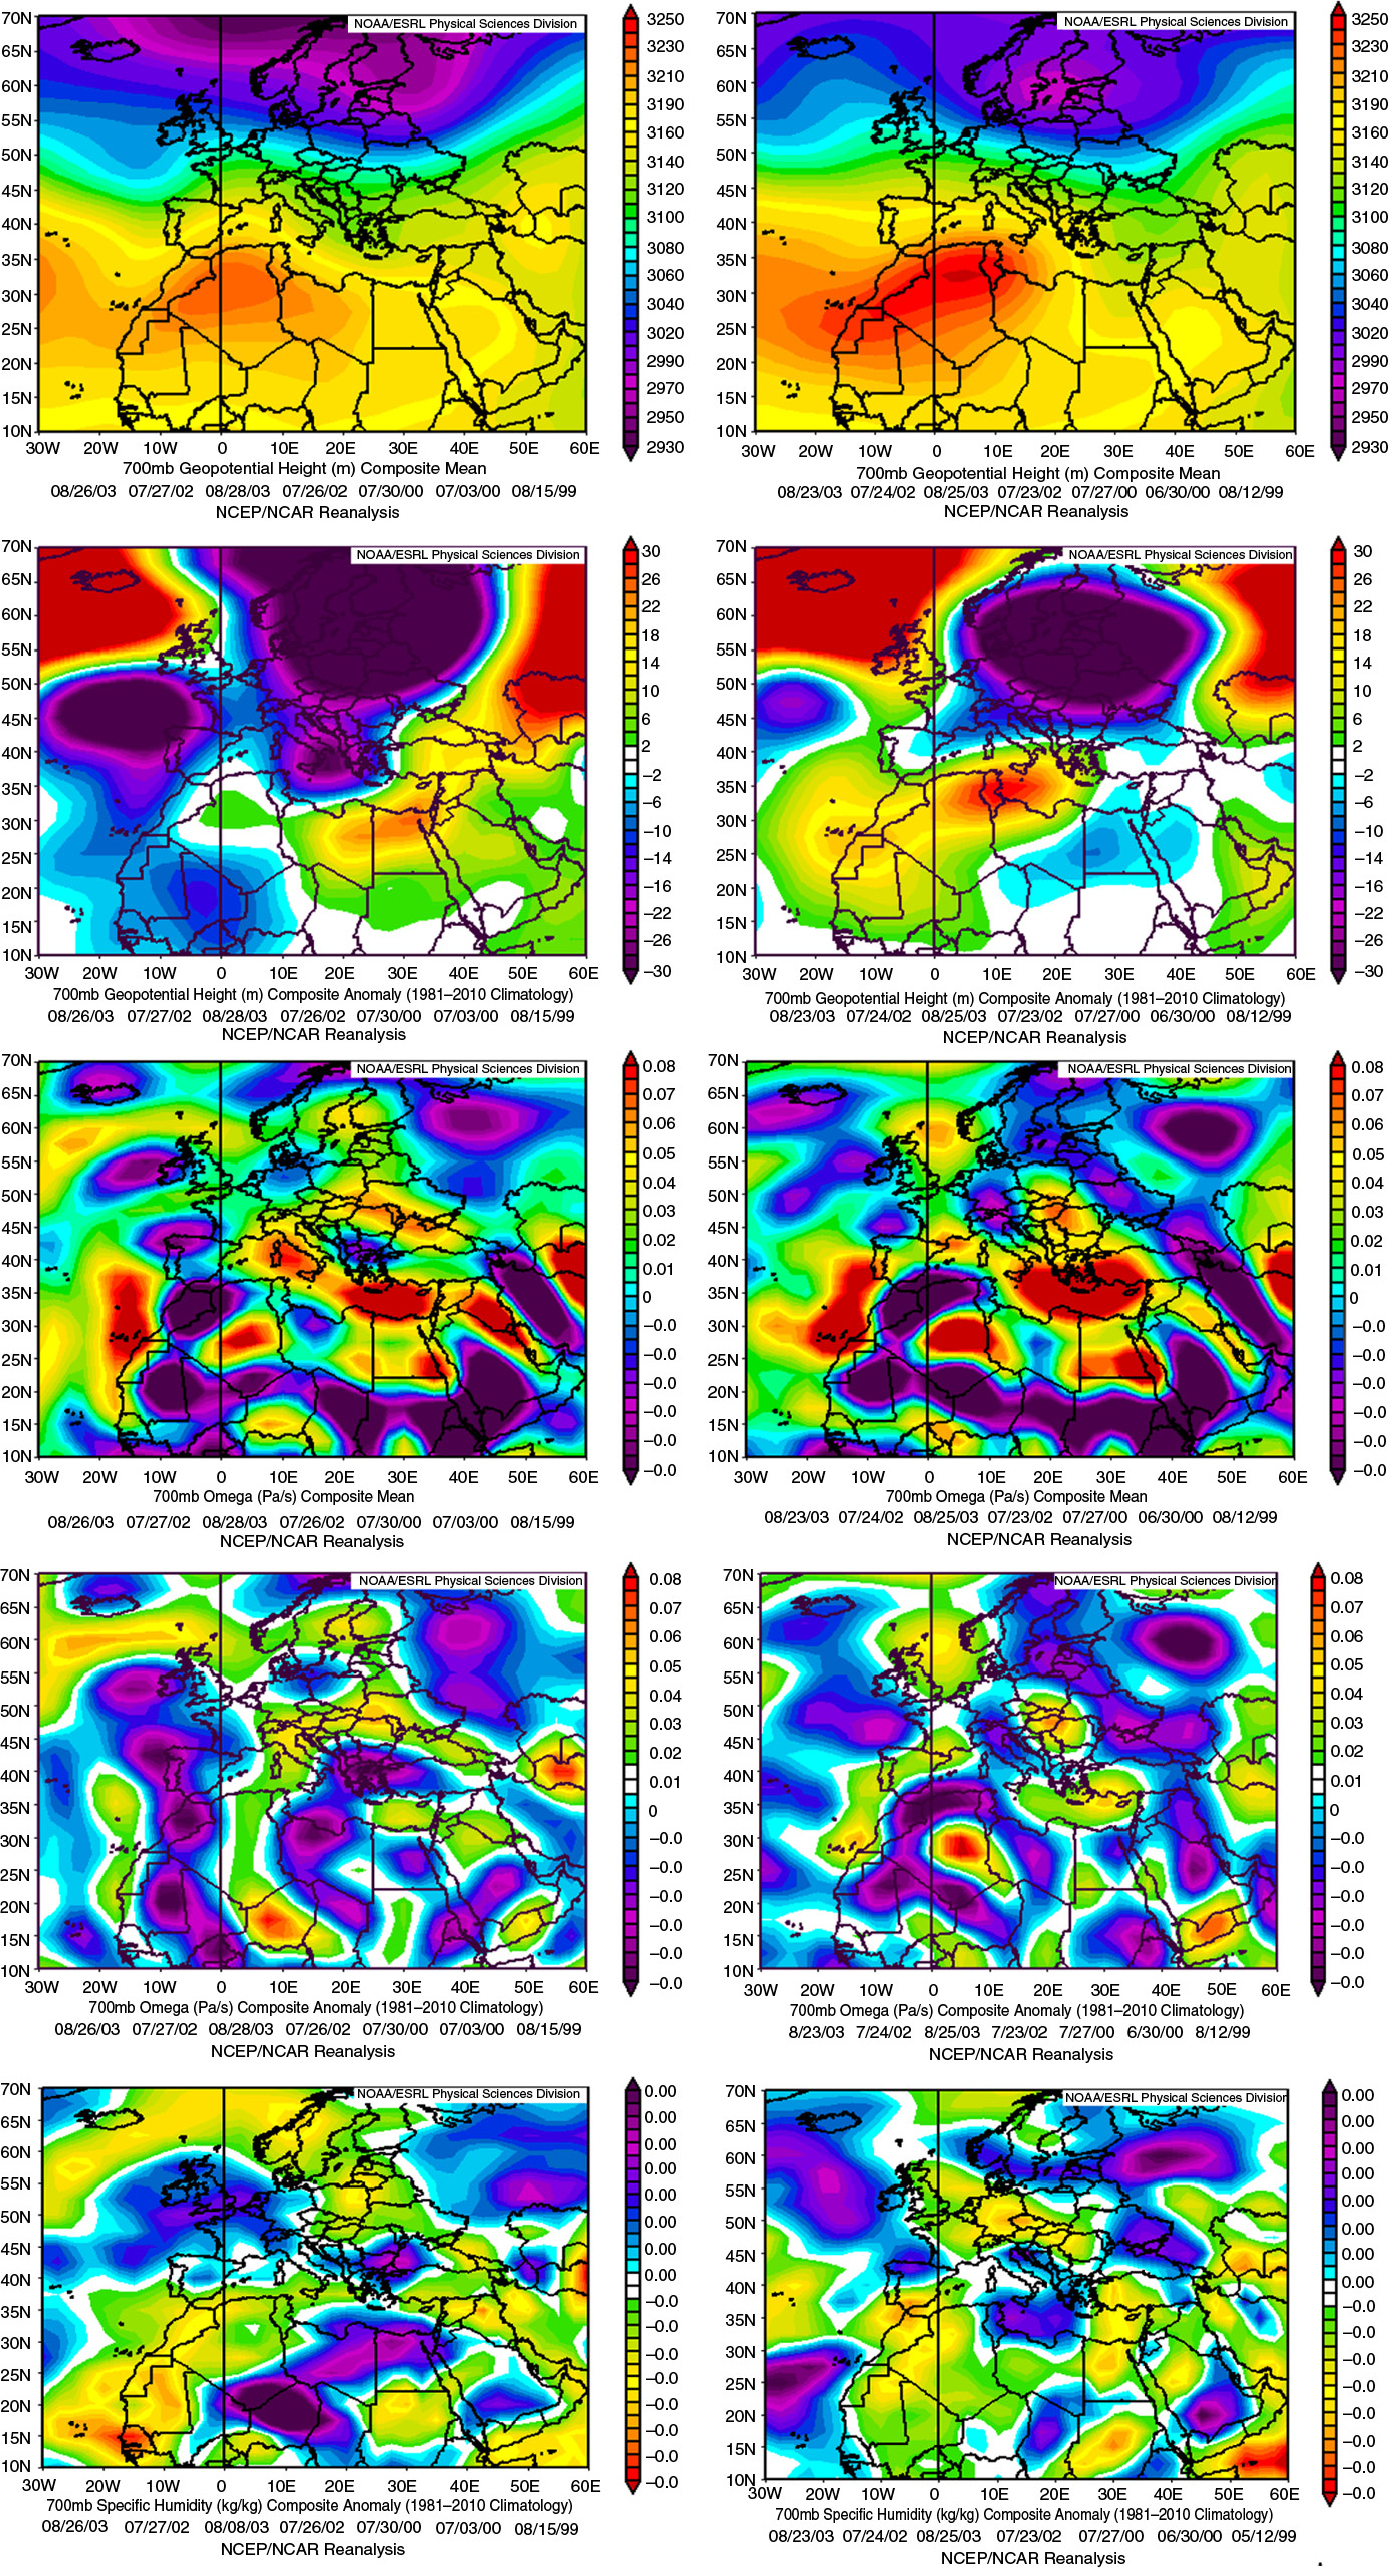
Fig. 2
Composite weather maps at 700 hPa of geopotential height, geopotential height anomaly, vertical velocity (omega), vertical velocity anomaly, specific humidity anomaly, precipitable water anomaly (columnar), air temperature anomaly and vector wind of the 7% of the days with the lowest vertical summer ozone concentrations at the 1.5–5 km layer over Cairo during the day of the measurement (left column) and 3-d ago (right column).
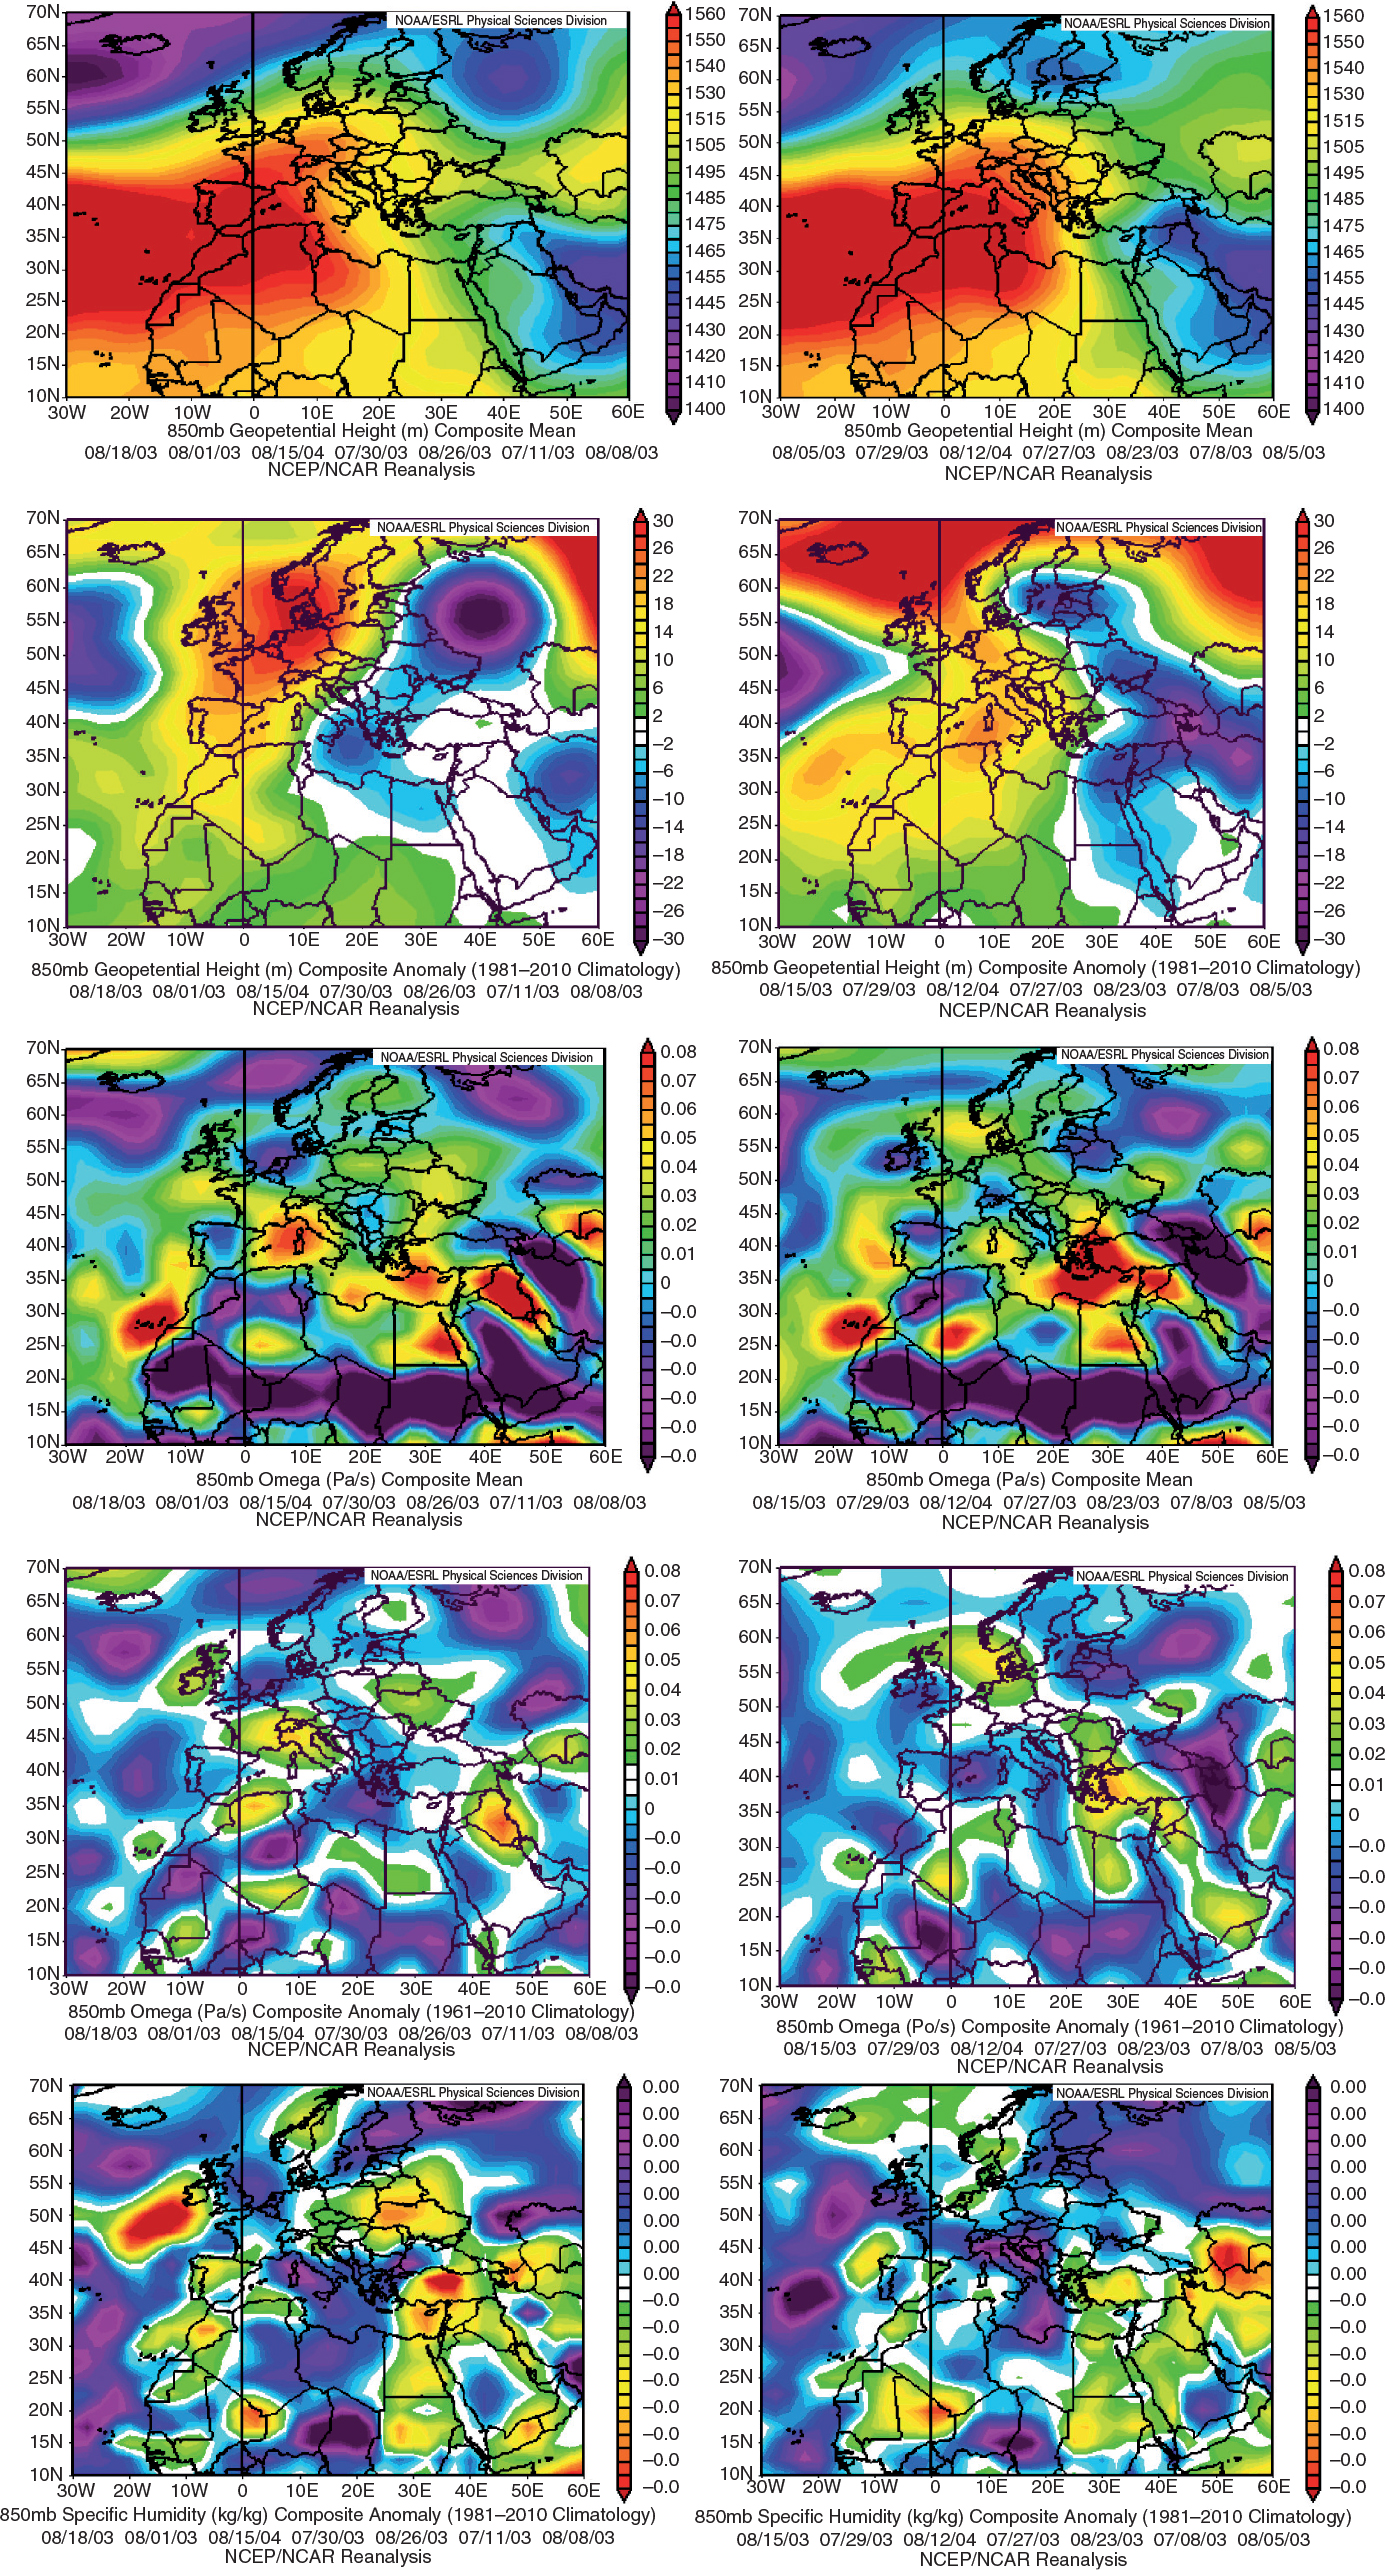
Fig. 3
(a) Vertical profiles of ozone over the eastern Mediterranean airport of Cairo for the 7% highest (red) and the 7% lowest (blue) ozone mixing ratios at 0–1.5 km during summer (JJA); (b) same as (a) but for relative humidity; (c) same as (a) but for carbon monoxide (CO); (d) same as (a) but for temperature (CO measurements corresponding to low ozone are missing). The black line in (a–c) shows the mean profile of the respective parameter calculated from all available data during summer.
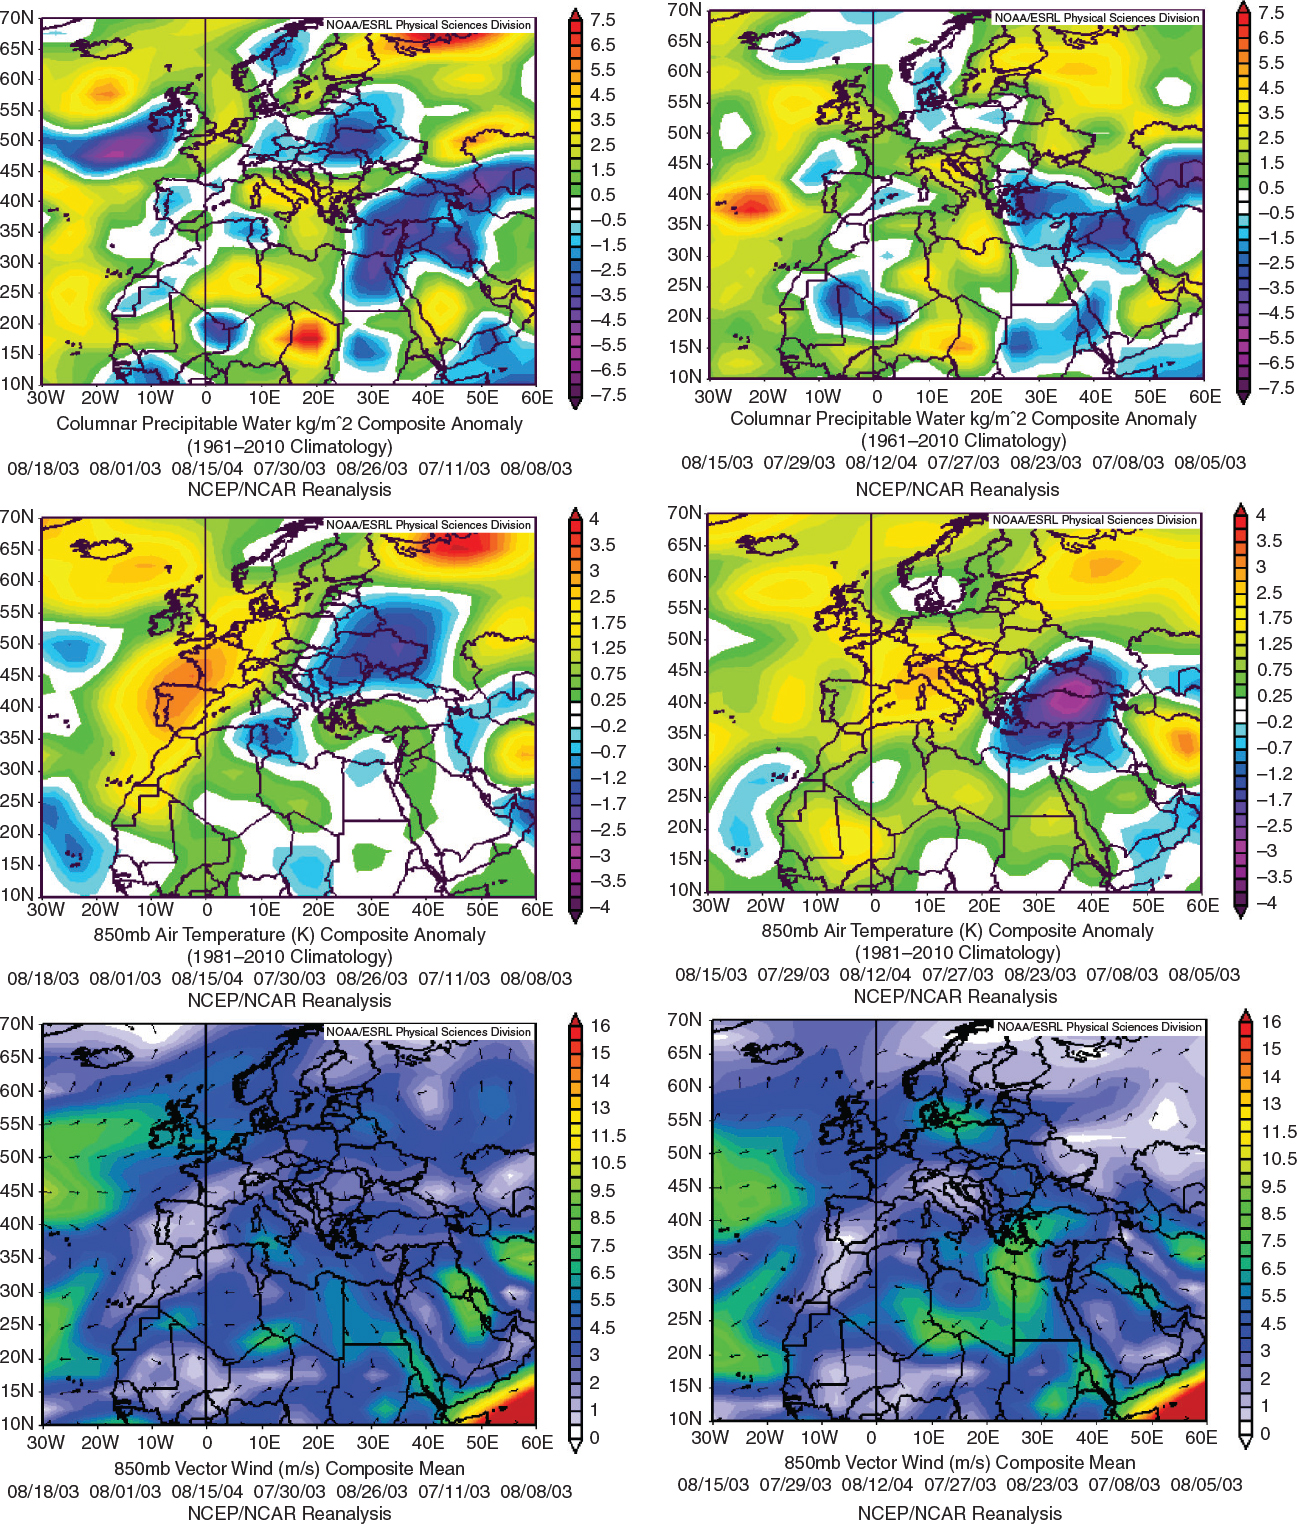
Fig. 4
Composite weather maps at 850 hPa of geopotential height, geopotential height anomaly, vertical velocity (omega), vertical velocity anomaly, specific humidity anomaly, precipitable water anomaly (columnar), air temperature anomaly and vector wind of the 7% of the days with the highest ozone concentrations at the 0–1.5 km layer over Cairo during the day of the measurement (left column) and 3-d ago (right column).
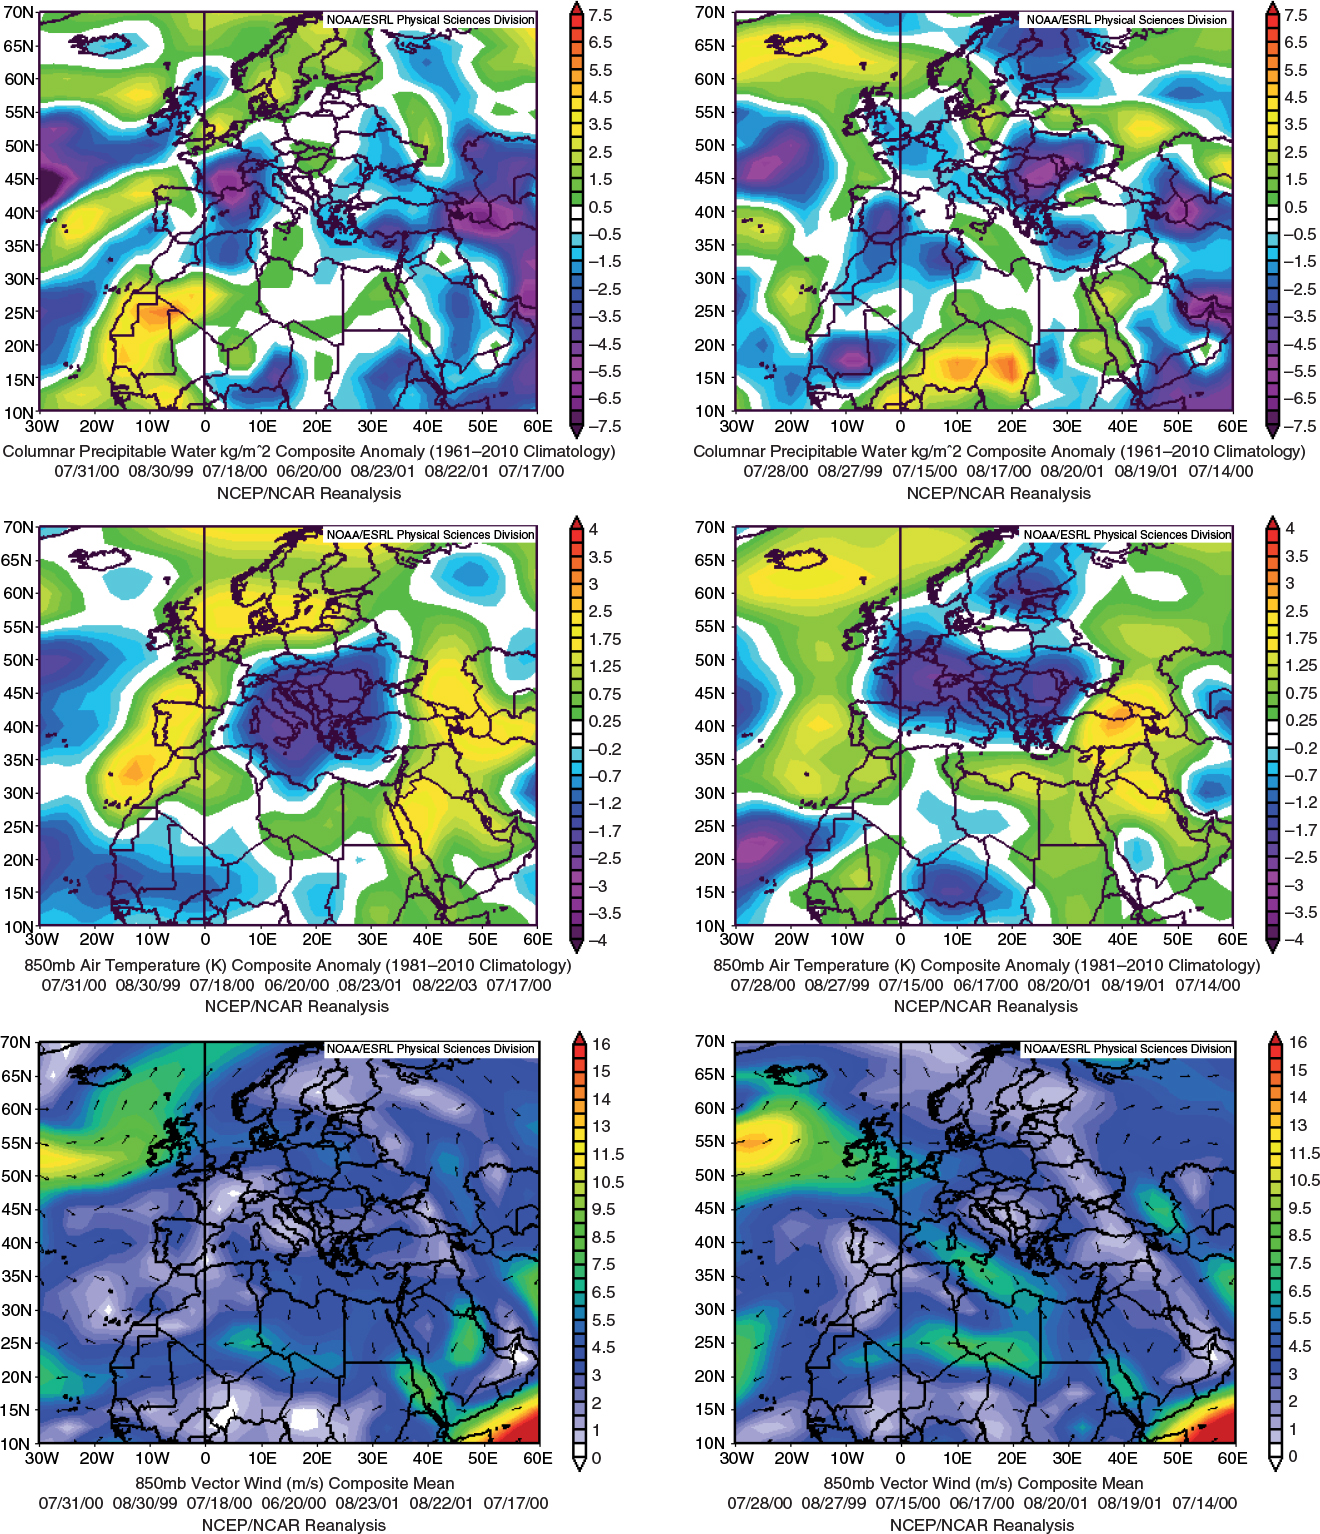
Fig. 5
Composite weather maps of geopotential height, geopotential height anomaly, vertical velocity (omega), vertical velocity anomaly, specific humidity anomaly, precipitable water anomaly, air temperature anomaly and vector wind at 850 hPa of the 7% of the days with the lowest ozone concentrations at the 0–1.5 m layer over Cairo during the day of the measurement (left column) and 3-d ago (right column).
Table 1. Average percentage contribution of each atmospheric layer to the air arriving over Cairo in the 0–1.5 km layer (1000–850 hPa) on the 7% highest ozone days (left column) and on the 7% lowest ozone days (right column), based on 3-d backward simulations with FLEXPART
Table 2. Average percentage contribution of each atmospheric layer to the air arriving over Cairo during three high ozone days at the 0–1.5 m layer over Cairo with strong subsidence (left column), weak subsidence (middle column) and the day of the highest observed ozone concentrations over Cairo (right column) for 3-day backward simulations with FLEXPART
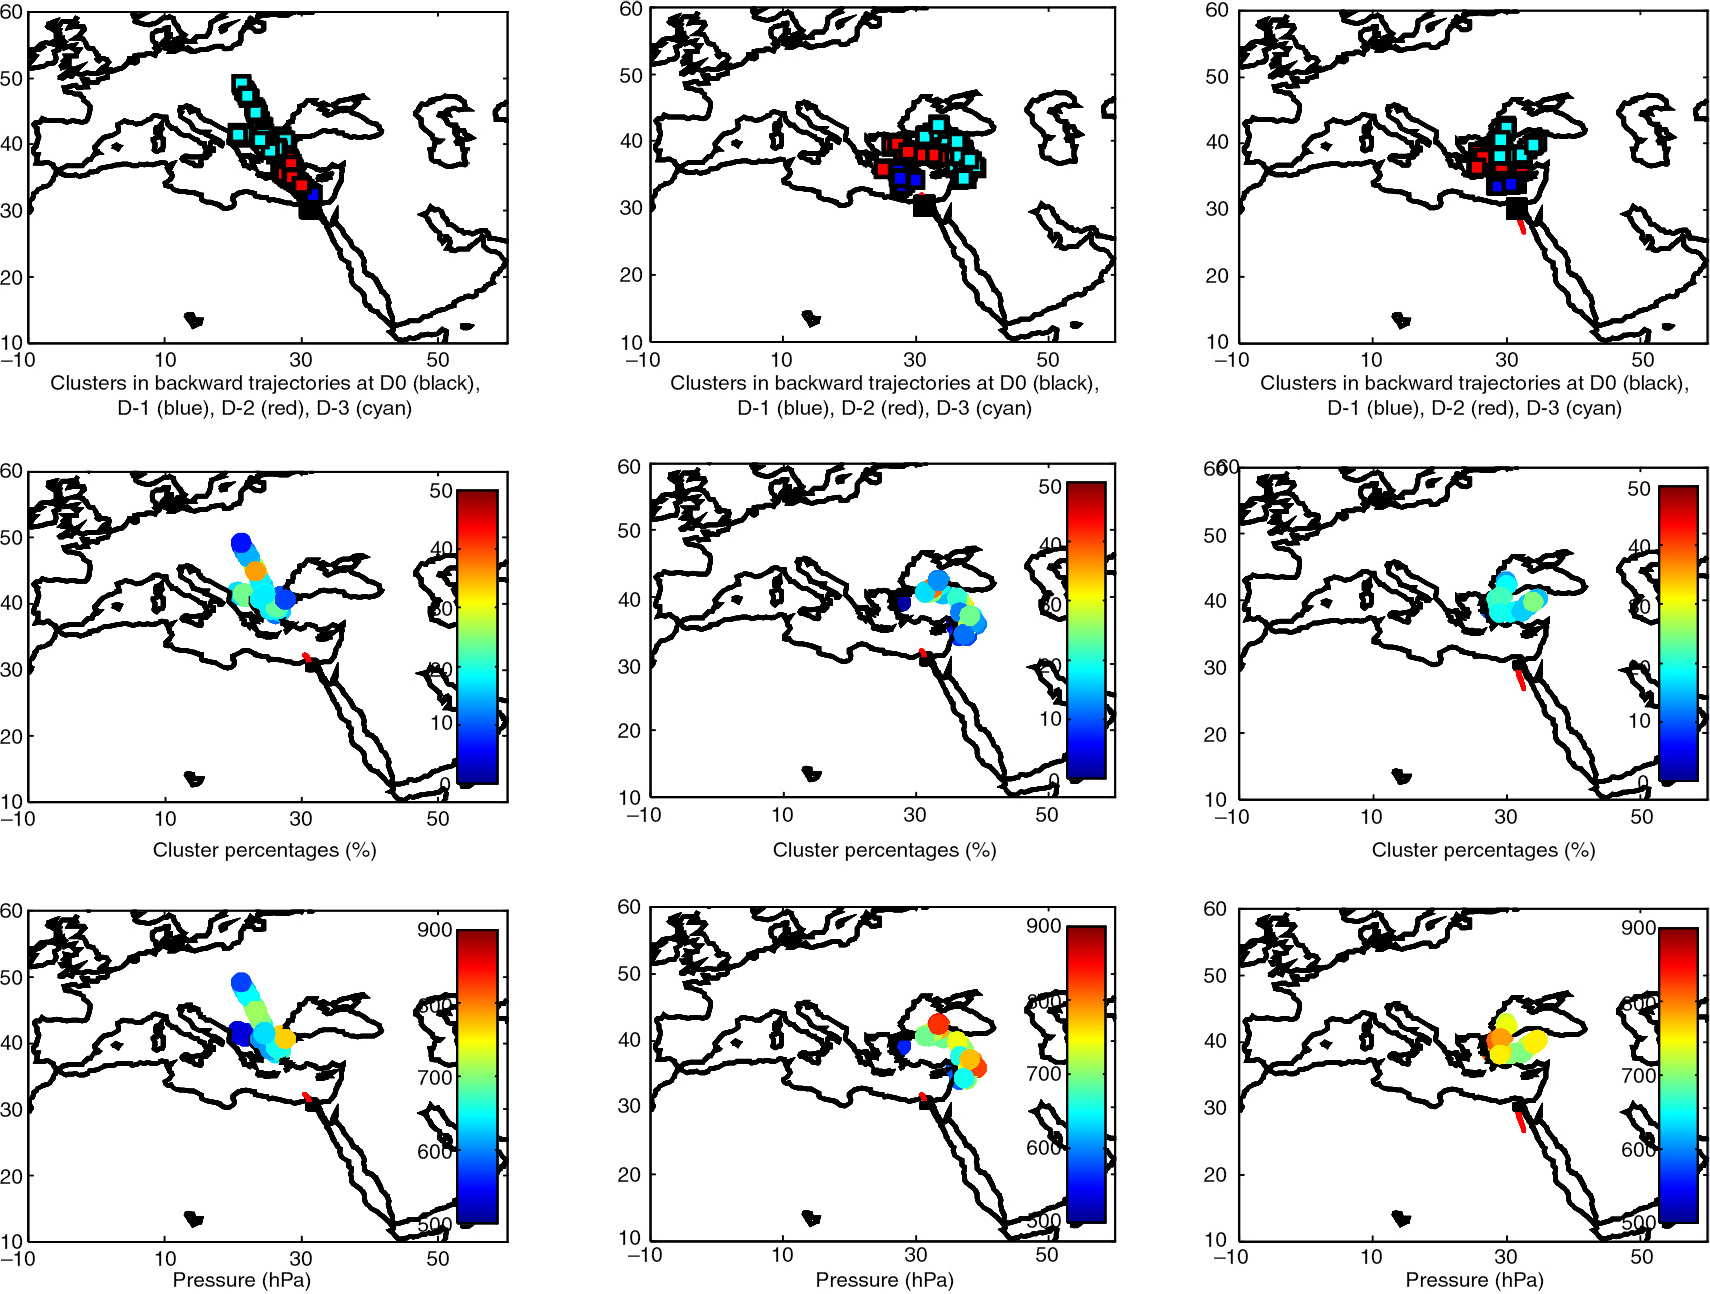
Fig. 6
(a) Vertical profiles of ozone over the eastern Mediterranean airport of Cairo during a high ozone day at the 0–1.5 km layer over Cairo with strong subsidence (blue line – 11 July 2003), a day with weak subsidence (red line – 11 June 2003) and the day of the highest observed ozone concentrations over Cairo (brown line – 18 August 2003). (b) Same as (a) but for relative humidity; (c) same as (a) but for carbon monoxide (CO); (d) same as (a) but for temperature. The black line in (a–c) shows the mean profile of the respective parameter.
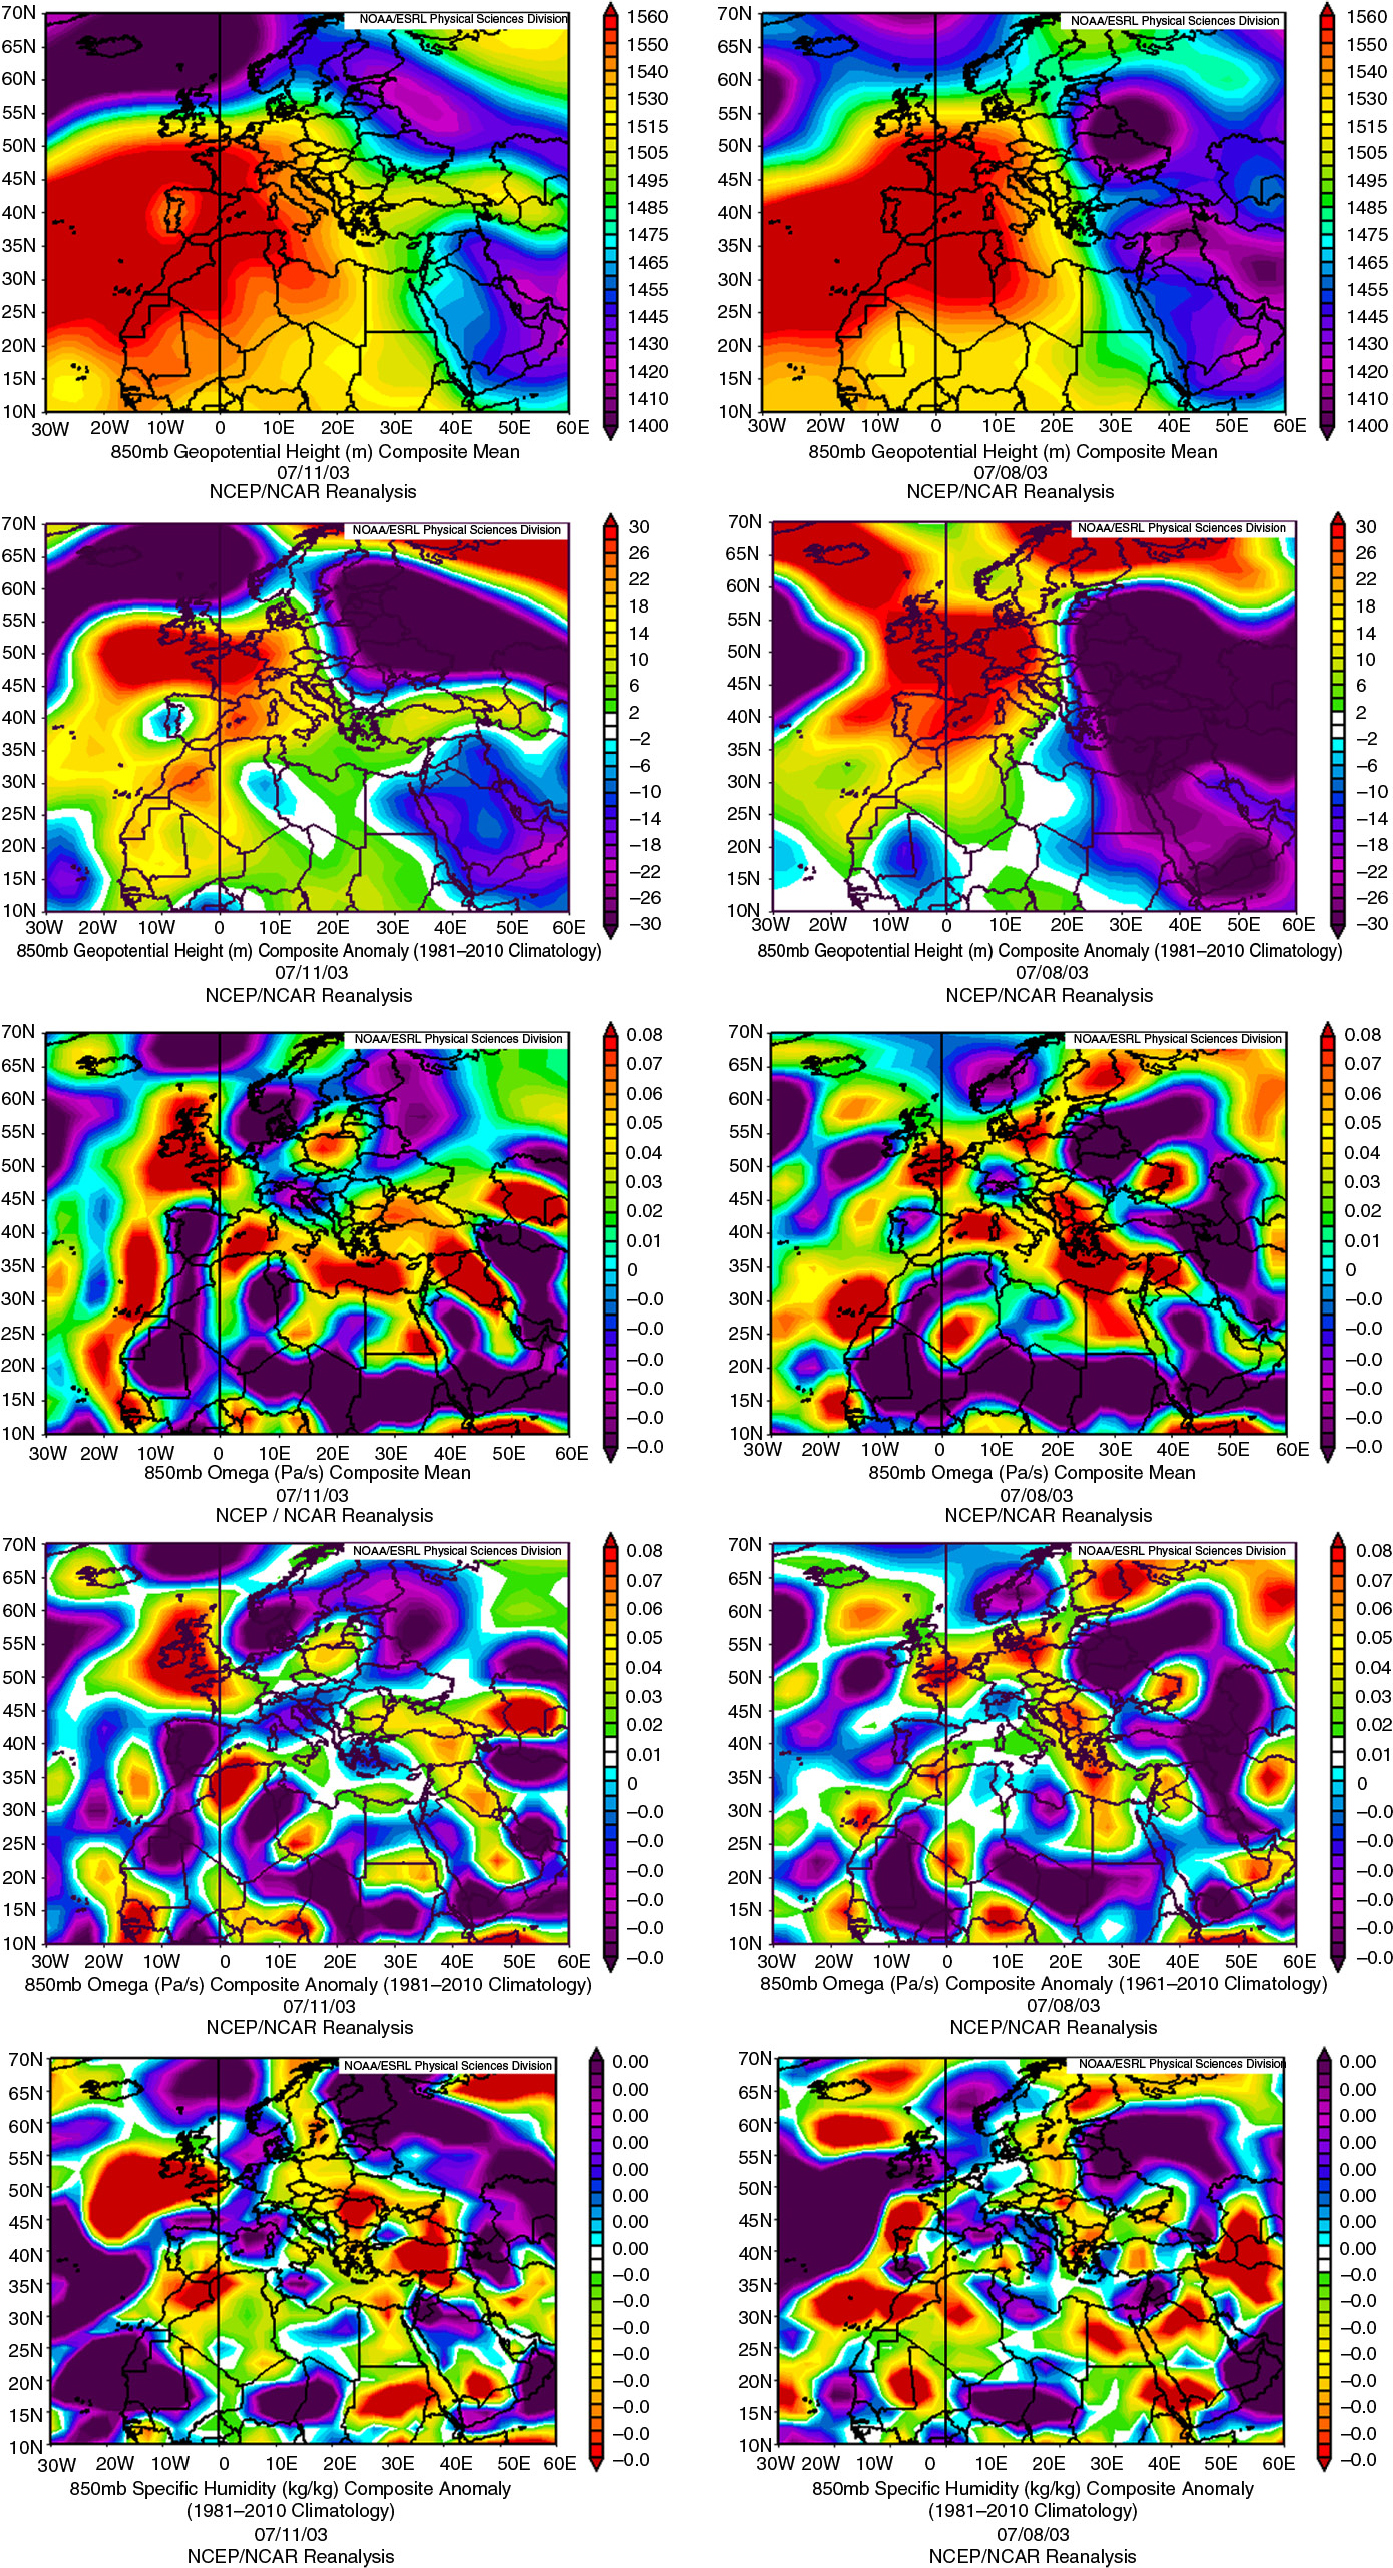
Fig. 7
(Left panel) Backward integration in time for 3 d for the MOZAIC vertical profile measurements and for air masses arriving at 0–1.5 km over Cairo during a high ozone day with strong subsidence (11 July 2003). (Middle panel) Backward integration in time for 3 d for the MOZAIC vertical profile measurements and for air masses arriving at 0–1500 m over Cairo during a high ozone day with weak subsidence (11 June 2003). (Right panel) Backward integration in time for 3 d for the MOZAIC vertical profile measurements and for air masses arriving at 0–1.5 km over Cairo during the day with the highest ozone concentrations (18 August 2003). The results shown are for the 0–1.5 km layer. The results are summarised on centroids of five clusters, and include every 12 h latitude, longitude, pressure and percentage of representation. Top plots show the clusters positions at day 0 (black), day-1 (blue), day-2 (red) and day-3 (cyan). The middle plots show the percentages of clusters at day-3. Finally, the bottom plots show the pressure of the clusters at day-3. The red line is the aircraft trajectory during ascent/descent.
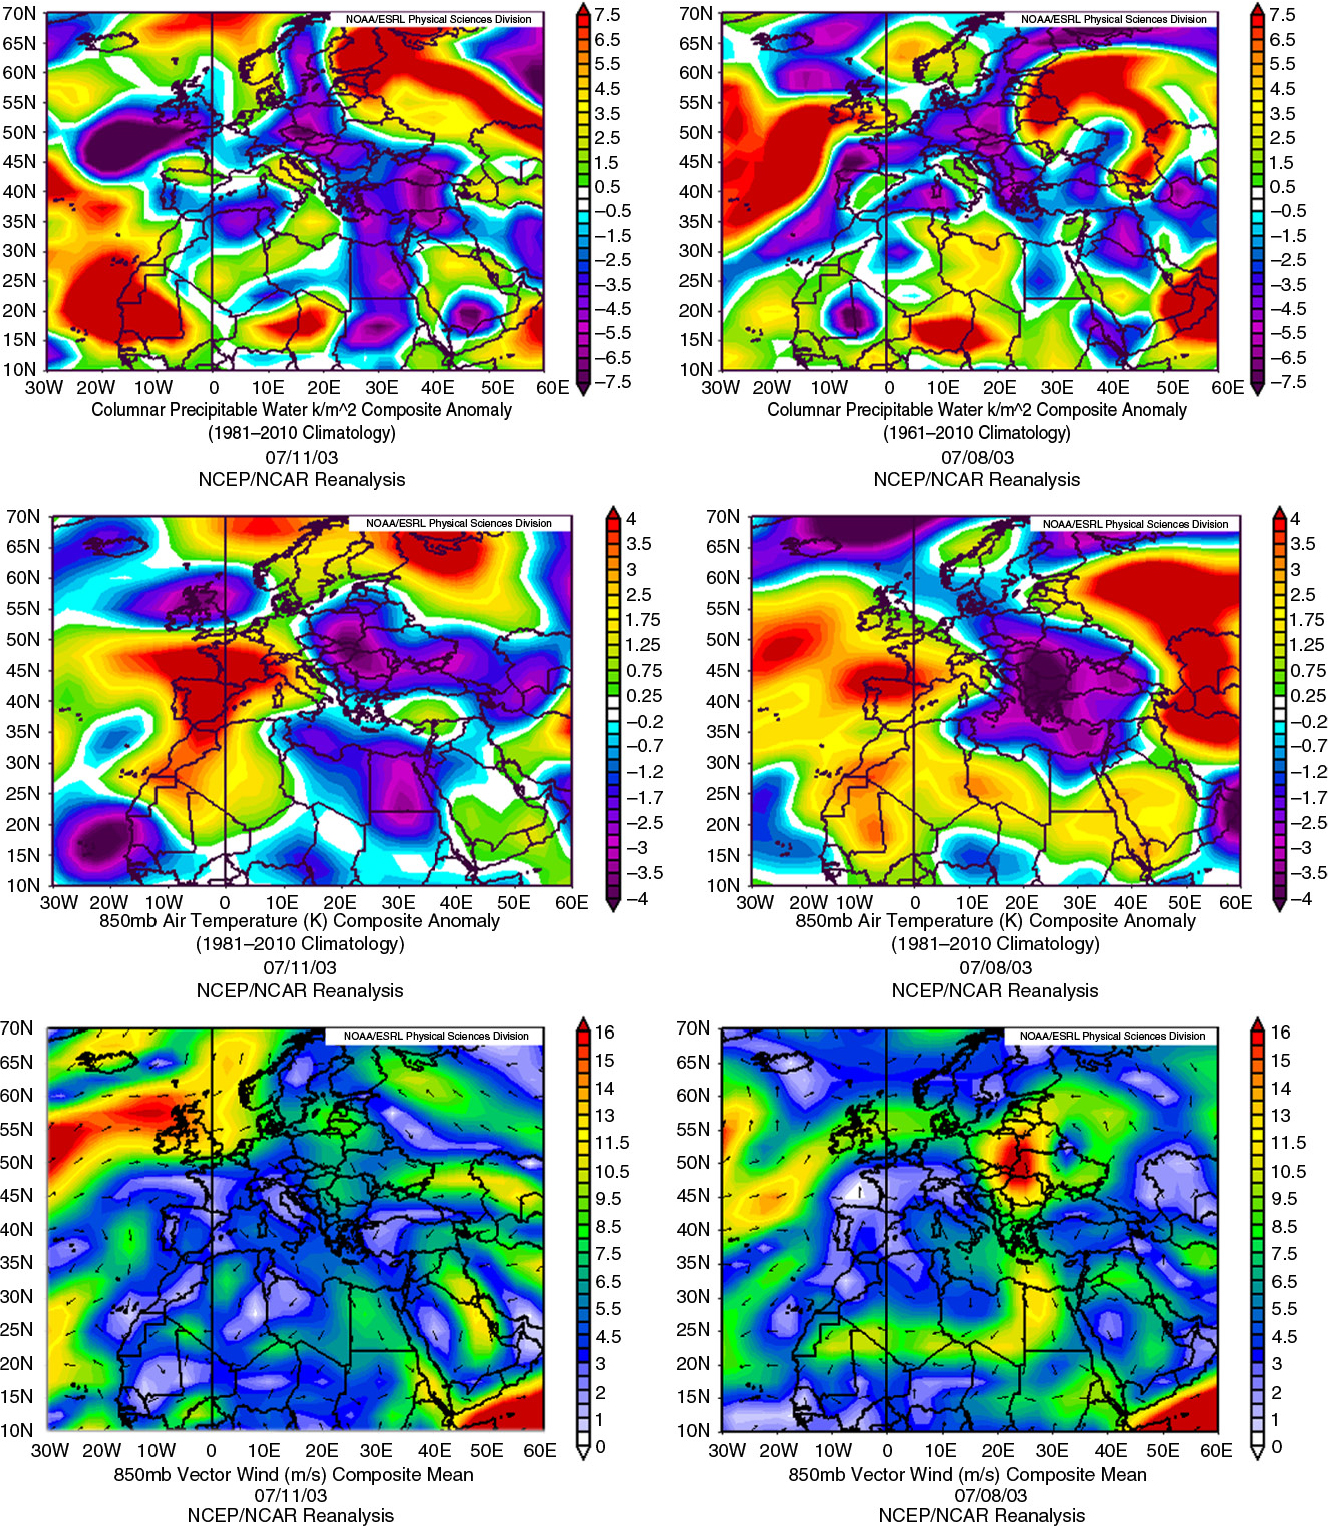
Fig. 8
Composite weather maps at 850 hPa of geopotential height, geopotential height anomaly, vertical velocity (omega), vertical velocity anomaly, specific humidity anomaly, precipitable water anomaly (columnar), air temperature anomaly and vector wind for a high ozone day at the 0–1.5 km layer over Cairo with strong subsidence (11 July 2003) during the day of the measurement (left column) and 3-d ago (right column).
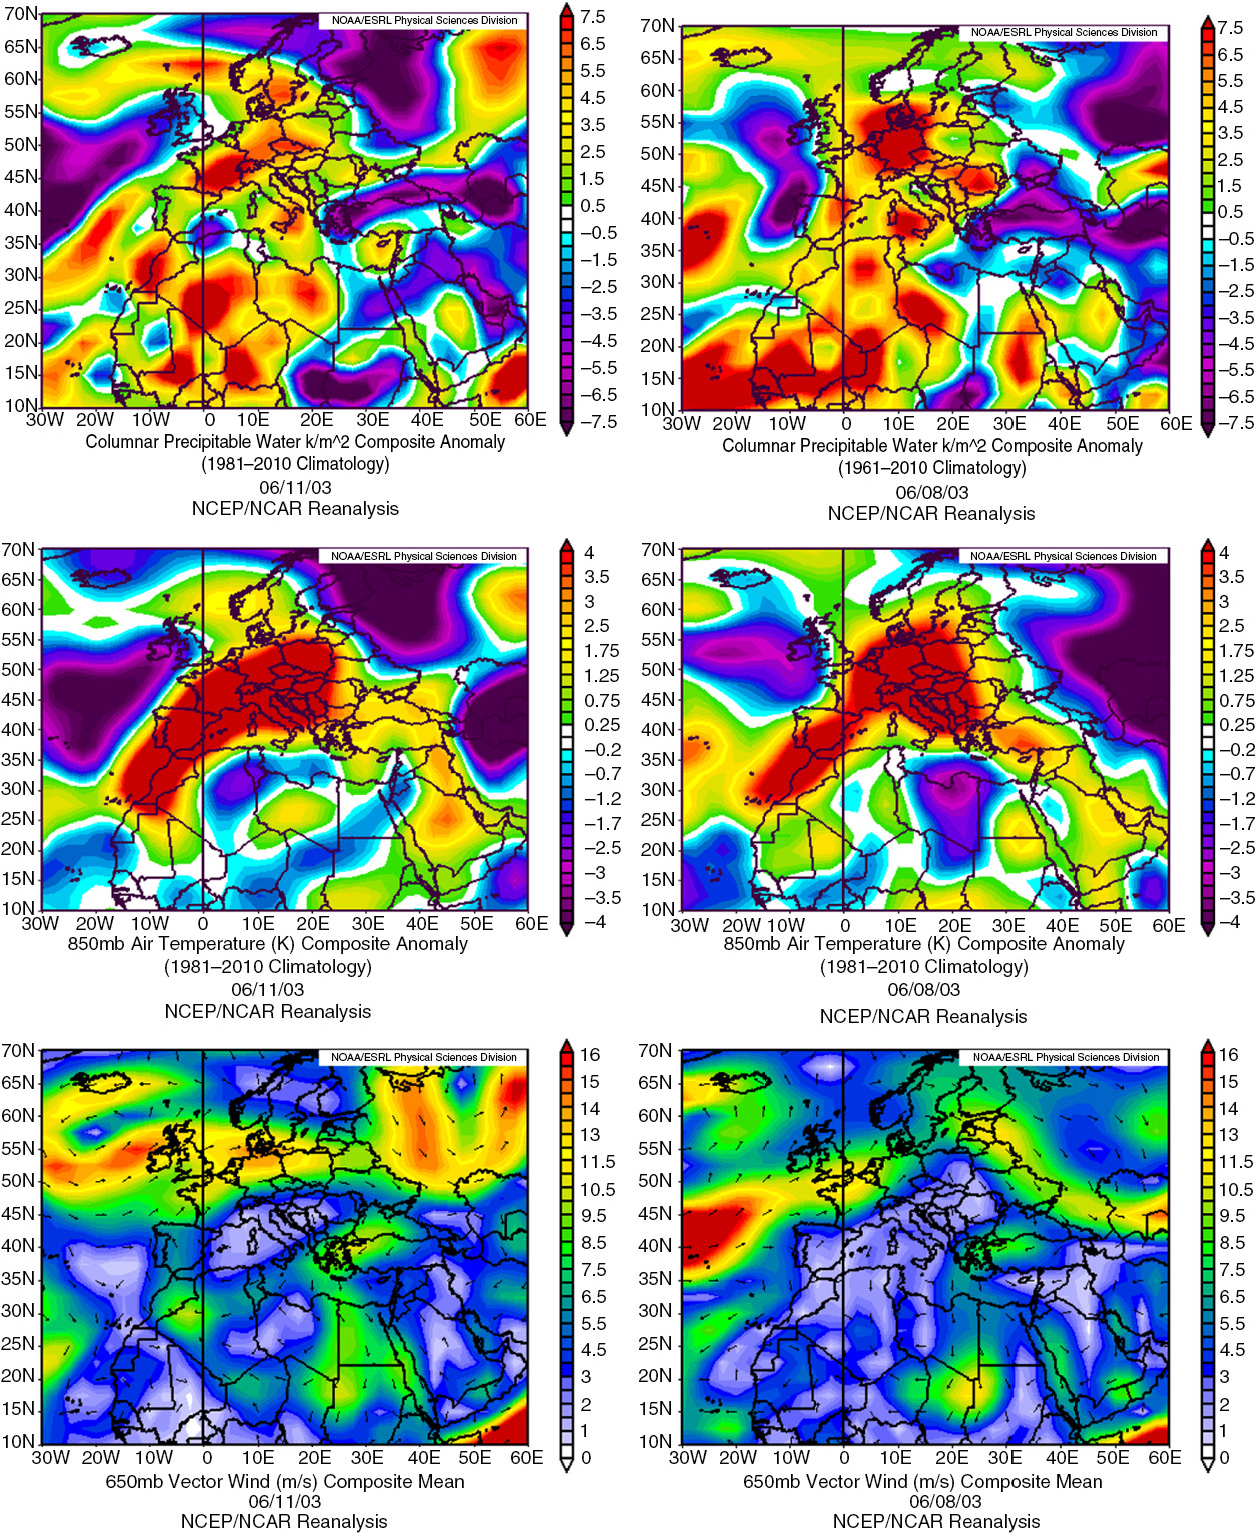
Fig. 9
Composite weather maps at 850 hPa of geopotential height, geopotential height anomaly, vertical velocity (omega), vertical velocity anomaly, specific humidity anomaly, precipitable water anomaly (columnar), air temperature anomaly and vector wind for a high ozone day at the 0–1.5 km layer over Cairo with weak subsidence (11 June 2003) during the day of the measurement (left column) and 3-d ago (right column).
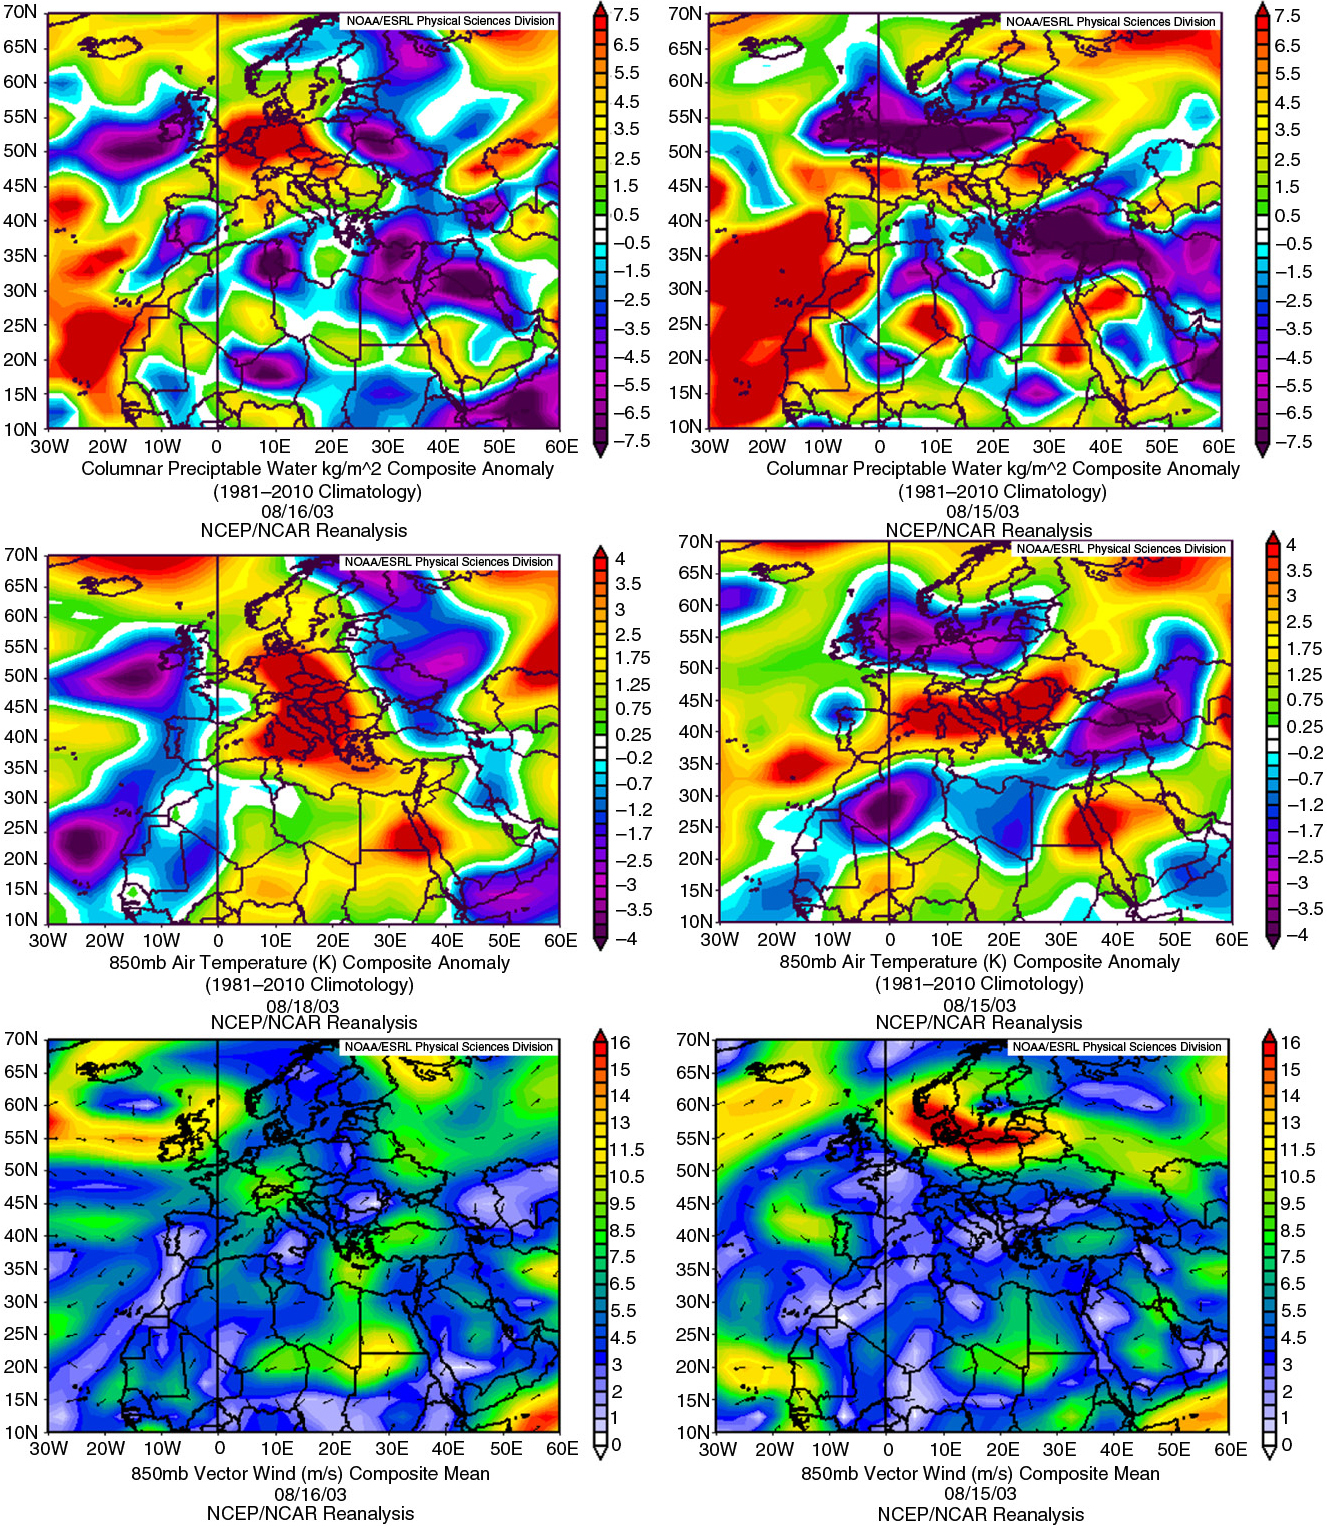
Fig. 10
Composite weather maps at 850 hPa of geopotential height, geopotential height anomaly, vertical velocity (omega), vertical velocity anomaly, specific humidity anomaly, precipitable water anomaly (columnar), air temperature anomaly and vector wind at the 0–1.5 km layer over Cairo for the day with the highest ozone concentrations (18 August 2003) during the day of the measurement (left column) and 3-d ago (right column).