Have a personal or library account? Click to login
Impacts of decadal variations in natural emissions due to land-cover changes on ozone production in southern China Cover

Impacts of decadal variations in natural emissions due to land-cover changes on ozone production in southern China

Open Access
|Jan 2015

Figures & Tables

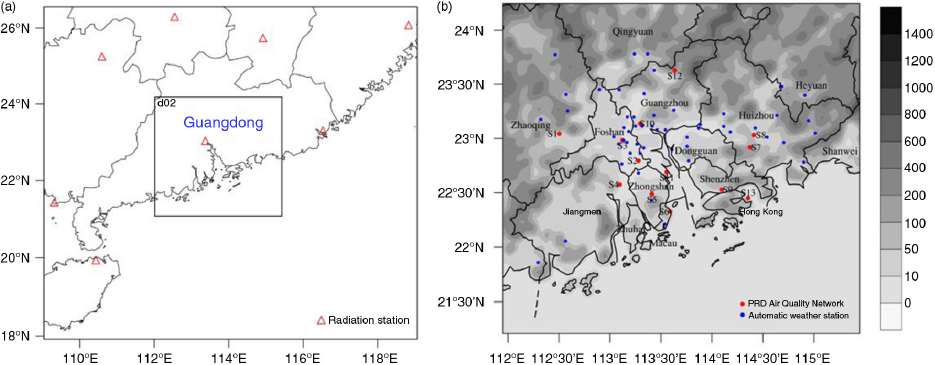
Fig. 1

(a) Two-nested WRF/Chem modelling domains and radiation observational stations (red triangle), (b) Locations of the automatic weather sites (blue dots) and air-quality monitoring sites (red dots) in the inner domain. The background shaded contour in (b) represents topography height (m); the labelled cities in (b) represent main administrative districts in the inner domain; the 13 air-quality monitoring sites are labelled as: S1 – Chengzhong, S2 – Shunde, S3 – Huijingcheng, S4 – Donghu, S5 – Zimaling, S6 – Tangjia, S7 – Jinguowan, S8 – Xiabu, S9 – Liyuan, S10 – Luhu, S11 – Wanqingsha, S12 – Tianhu and S13 – Tamen.

Table 1. Experimental designs and input data

Experiments MEGAN90 MEGAN01MEGAN06 (base case) MEGAN12 METE12 MELU90MEGAN natural emissions PFTsIGBP DISCover (1992)MCD12Q1 (2001)MCD12Q1 (2006)MCD12Q1 (2012)MCD12Q1 (2006)MCD12Q1 (2006) LAIAVHRR (1992)MCD15A2 (2003)MCD15A2 (2006)MCD15A2 (2012)MCD15A2 (2006)MCD15A2 (2006)Meteorology inputFNL (2006)FNL (2006)FNL (2006)FNL (2006)FNL (2012)FNL (2006)Anthropogenic emissionsPRD regional inventory in 2006 (Zheng et al., 2009b)Land surface parameters in WRFMODIS satellite retrievals in 2006 (Li et al., 2014)AVHRR satellite retrievals in 1980–90s

Table 2. Performance statistics of simulated meteorological variables in MEGAN06
Variable index Temperature (°C)Relative humidity (%)Wind speed (m s−1)Wind direction (°) Radiation (W m−2)MBa−0.315.180.9917.4582.83RMSEb2.0211.642.2274.55106.86FBc−0.010.070.30–0.42FEd0.050.130.60–0.45IOAe0.880.790.55–0.65

[i] a KOH×COH+KO×CO

[ii] b KOH×COH+KO×CO

[iii] c KOH×COH+KO×CO

[iv] d KOH×COH+KO×CO

[v] e KOH×COH+KO×CO

[vi] where sim and obs refer to the simulated and observed meteorological values, respectively; N represents the number of data pairs.

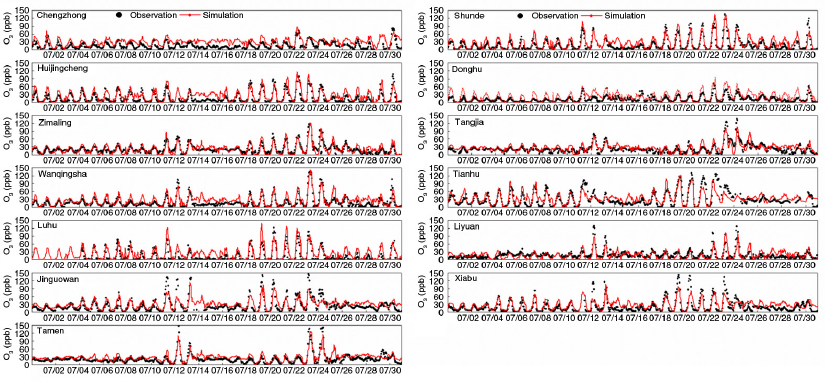
Fig. 2

Time series comparisons of the simulated O3 concentration (ppb) (red line) in MEGAN06 against observations (black dot) at 13 monitoring sites.
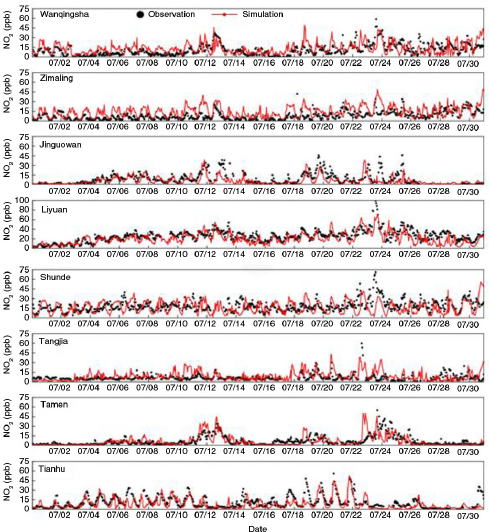
Fig. 3

Time series comparisons of the simulated NO2 concentration (ppb) (red line) in MEGAN06 against observations (black dot) at eight representative sites.
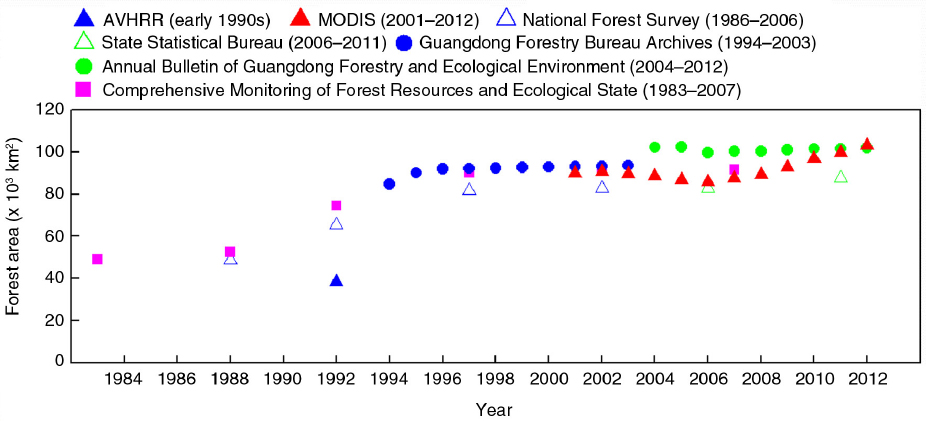
Fig. 4

Inter-annual variations of forest area (×103 km2) in Guangdong based on remote sensing and statistical surveys.

Table 3. Comparisons of isoprene emissions in MEGAN06 with previous studies

RegionArea (×104 km2)PeriodIsoprene (Gg C)Emission algorithmsReferenceGuangdong17.81998a103.001995Klinger et al., 2002Guangdongb17.8July 200658.37MEGAN ver. 2.04This studyPRD4.97Jun–Aug, 2006c45.70MEGAN ver. 2.1Wang et al., 2011PRD4.702006a64.00GloBEISdZheng et al., 2010PRDe5.26July 200618.48MEGAN ver. 2.04This studyHong Kong0.11July 20040.39GloBEISdTsui et al., 2009Hong Kong0.11Jun–Aug 2006c3.00MEGAN ver. 2.04Leung et al., 2010Hong Kong0.11July 20060.35MEGAN ver. 2.04This study

[i] aIt refers to the sum of 12-month emissions from January to December;

[ii] bThe emission in Guangdong is estimated with model outputs from the outer domain;

[iii] cIt refers to the sum of 3-month emissions in June, July and August;

[iv] dGloBEIS refers to the Biogenic Emissions Inventory System developed by Guenther et al. (2000);
[v] eThe emission in PRD is calculated as the sum of that emitted from Zhaoqing, Huizhou, Foshan, Jiangmen, Zhongshan, Zhuhai, Guangzhou, Dongguan, Shenzhen and Hong Kong.

Fig. 5

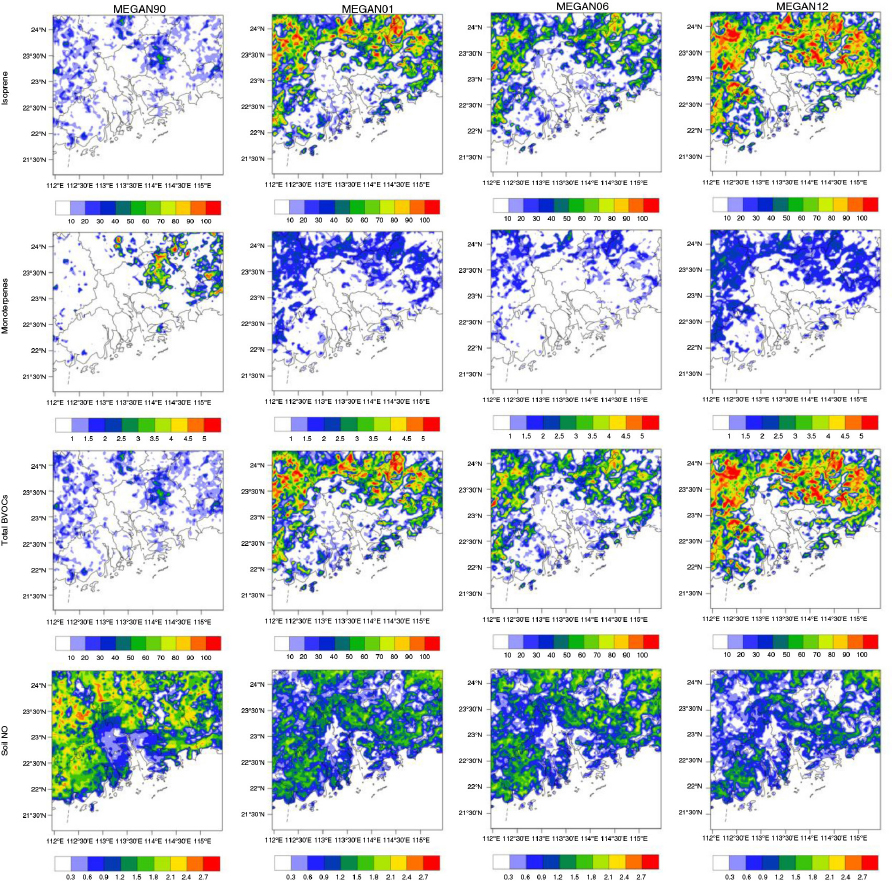
Average estimated emission fluxes (mol km−2 h−1) for isoprene, monoterpenes, total BVOCs and soil NO at 11:00–16:00 LST in these four simulations. The total BVOC emission flux is expressed as a sum of isoprene, α-pinene and β-pinene.
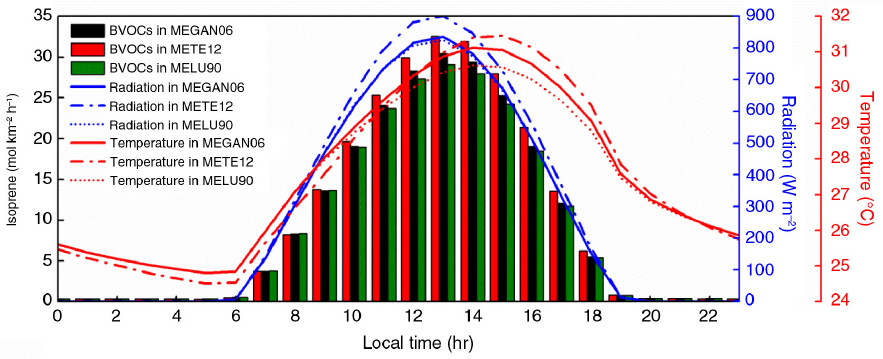
Fig. 6

Diurnal variations of solar radiation (W m−2), air temperature (°C) and BVOC emission fluxes (mol km−2 h−1) averaged over the inner domain in MEGAN06, METE12 and MELU90.
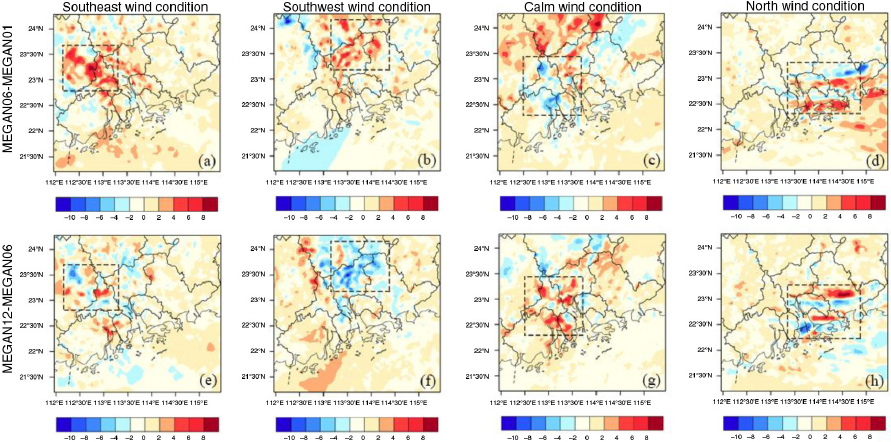
Fig. 7

Changes in O3 peak concentrations (ppb) relative to the year 2006 under different wind conditions. The dashed boxes mark the sub-domains with large ΔO3peak.
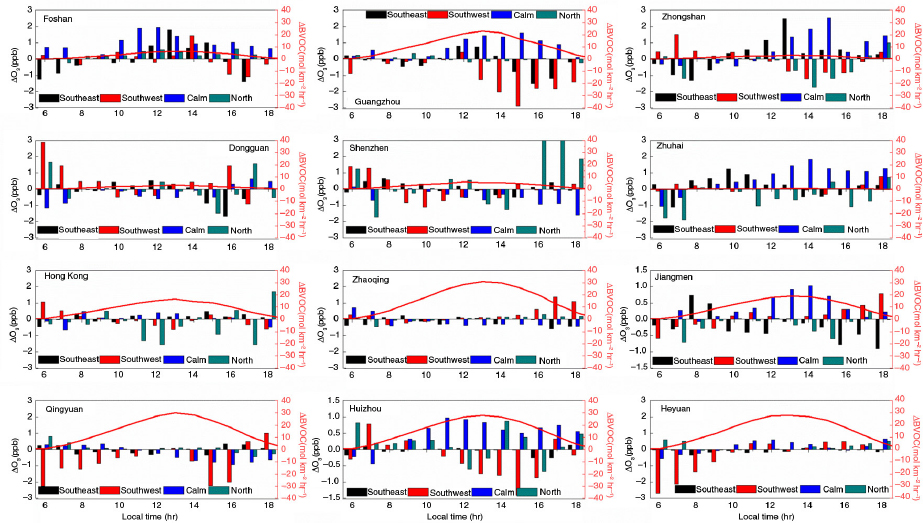
Fig. 8

Changes of the daytime BVOC emission fluxes (mol km−2 h−1) (red line) and surface O3 concentrations (ppb) (histogram) in the main cities between 2006 and 2012.
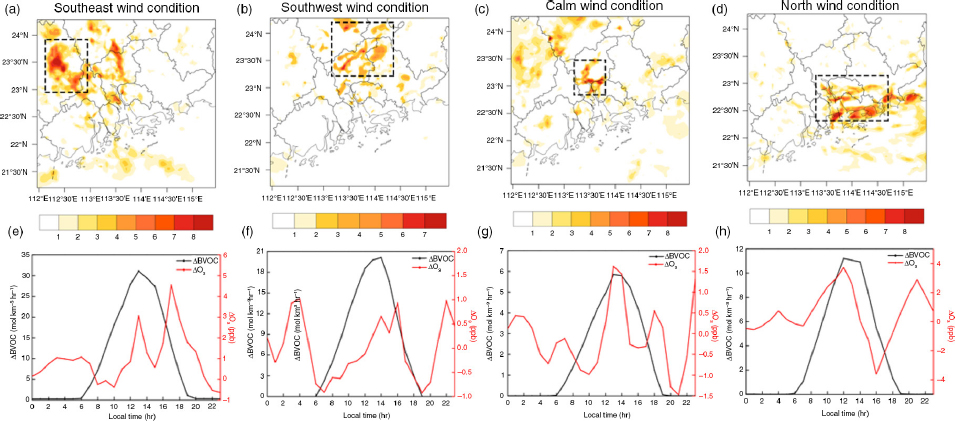
Fig. 9

(a–d) Changes of O3 peak concentrations (ppb) during the early 1990s to 2006 under different wind conditions. The dashed boxes mark the sub-domains with large ΔO3peak. (e–h) Diurnal variations of ΔO3 (ppb) (red line) and ΔBVOC (mol km−2 h−1) (black line) at the sub-domains marked in (a–d).

Language: English
Page range: 27676 - 27676
Submitted on: Feb 21, 2015
Accepted on: Aug 14, 2015
Published on: Jan 1, 2015
Published by: Stockholm University Press
In partnership with: Paradigm Publishing Services

© 2015 Mengmeng Li, Yu Song, Mingxu Liu, Huan Yao, Xin Huang, Xuesong Wang, Yuanhang Zhang, published by Stockholm University Press
This work is licensed under the Creative Commons Attribution 4.0 License.