
Fig. 1
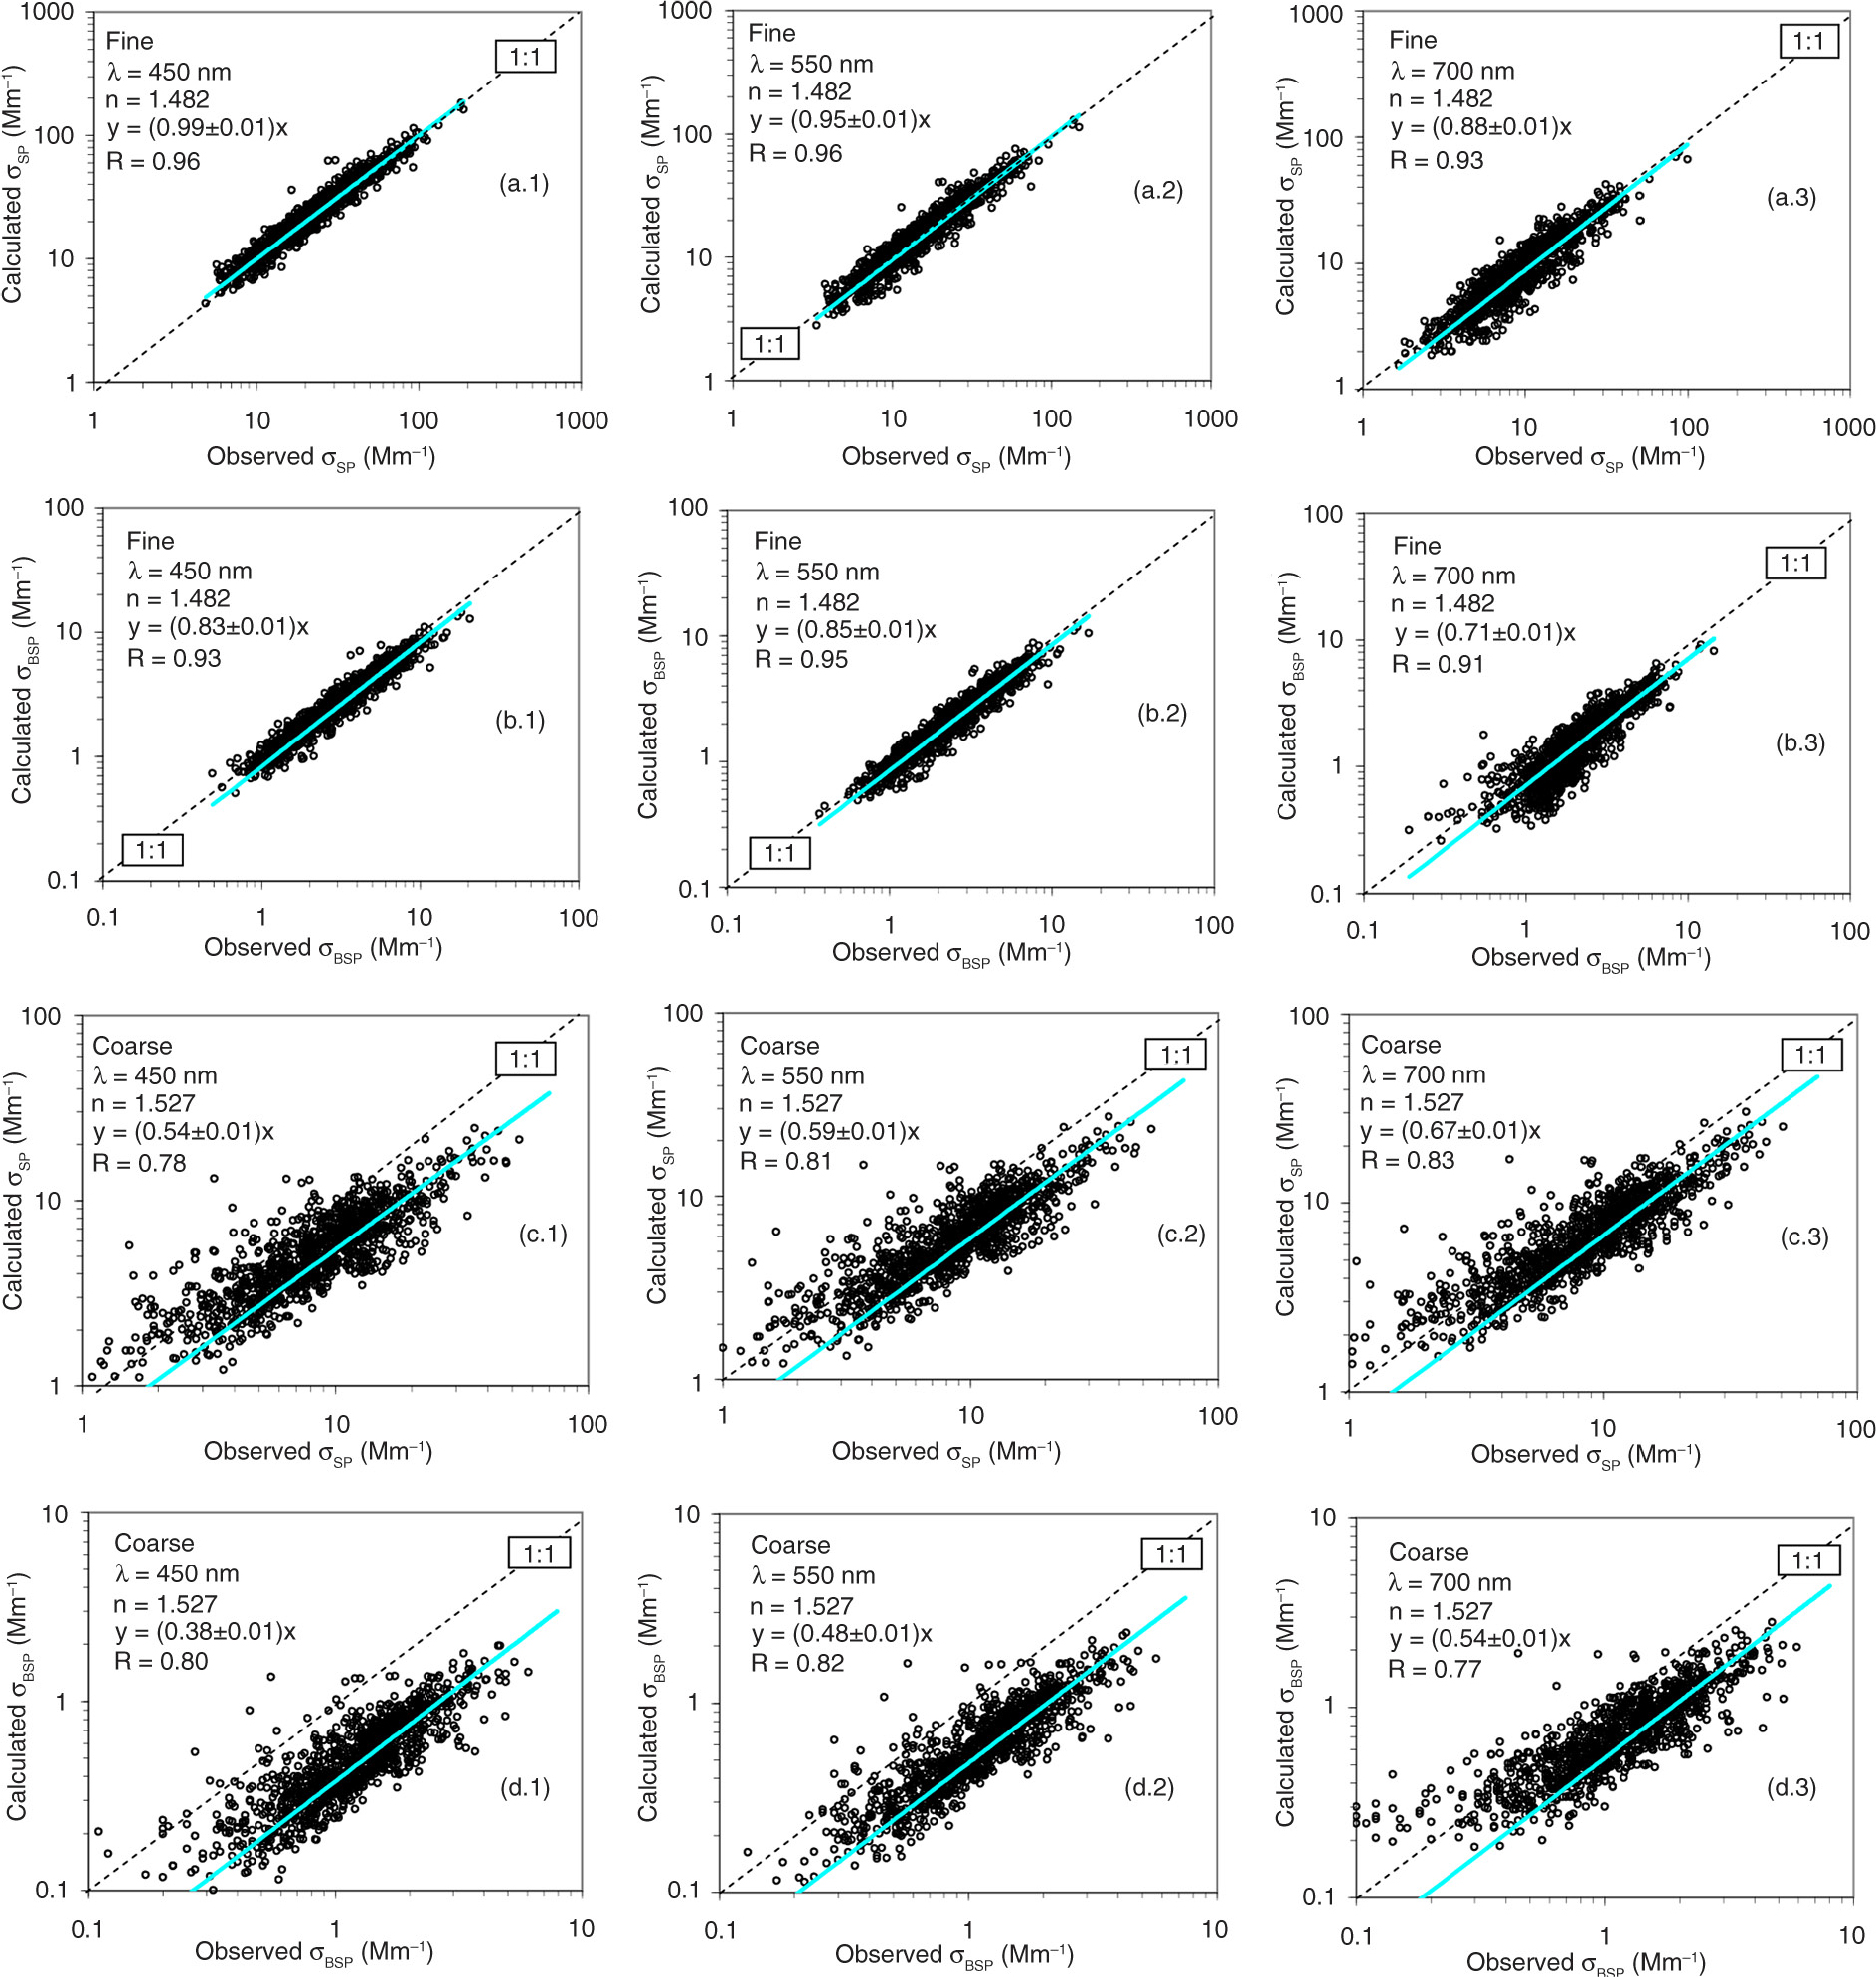
A close assessment of the scattering distributions: observed versus computed by the Mie Theory. The computations are based on the (Da<1 µm) particle size distributions measured by a SMPS particle spectrometer: (a.1) at 450 nm, (a.2) at 550 nm and (a.3) at 700 nm and the (1 µm<Da<10 µm) particle size distributions measured by an APS particle spectrometer: (c.1) at 450 nm, (c.2) at 550 nm and (c.3) at 700 nm. A close assessment of the backscattering distributions is also shown in b and d. The 1:1 line is the dashed line. On each panel, the nephelometer wavelength, the refractive index, the slope±SE of the fit (blue line) and the R correlation coefficient are shown.
Table 1. Statistics for the main microphysical and optical aerosol parameters (for dry conditions) from 1 May to 30 September 2009, at El Arenosillo Station
[i] Ñ is the arithmetic mean concentration, ñ is the geometric mean concentration, σ is the SD, σg is the geometric SD and µx values are the xth percentiles. The V10–1, V10 and Rv values are calculated with the Q-assumption. aThe fraction of data used for calculating RV is smaller than that of V1 and V10–1 because only simultaneous data of SMPS and APS particle spectrometers were used; bthe fraction of data used for calculating the optical parameters are smaller than that of microphysical parameters because only data with RH<60% were used; cthe fraction of data used for calculating RSP is smaller than that of σsp because only simultaneous data of σsp within (Da<10 µm) and (Da<1 µm) were used.
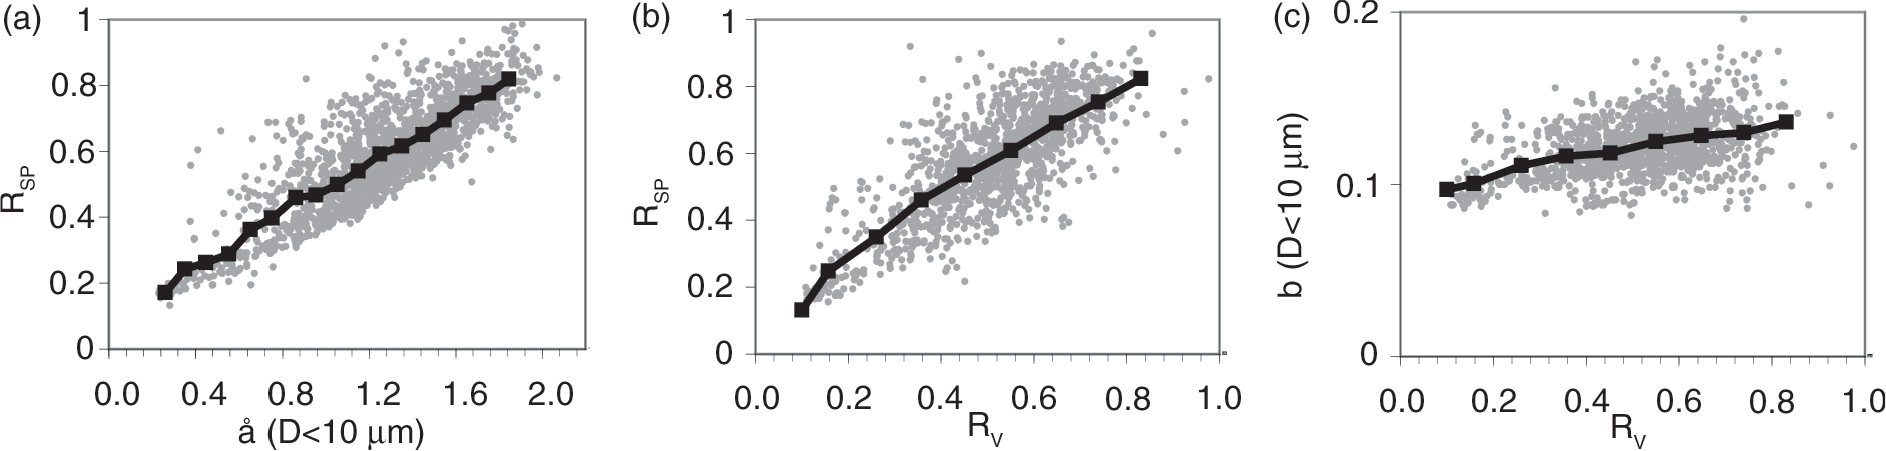
Fig. 2
Mean hourly sub-micron scattering ratio (RSP) versus Ångström exponent (å) and RSP ratio and fraction of backscattered light (b) versus sub-micron volume ratio (RV) during the analysed period. The mean values (black lines) were calculated over 0.1 Mm−1 σSP and 0.1 RV bins.
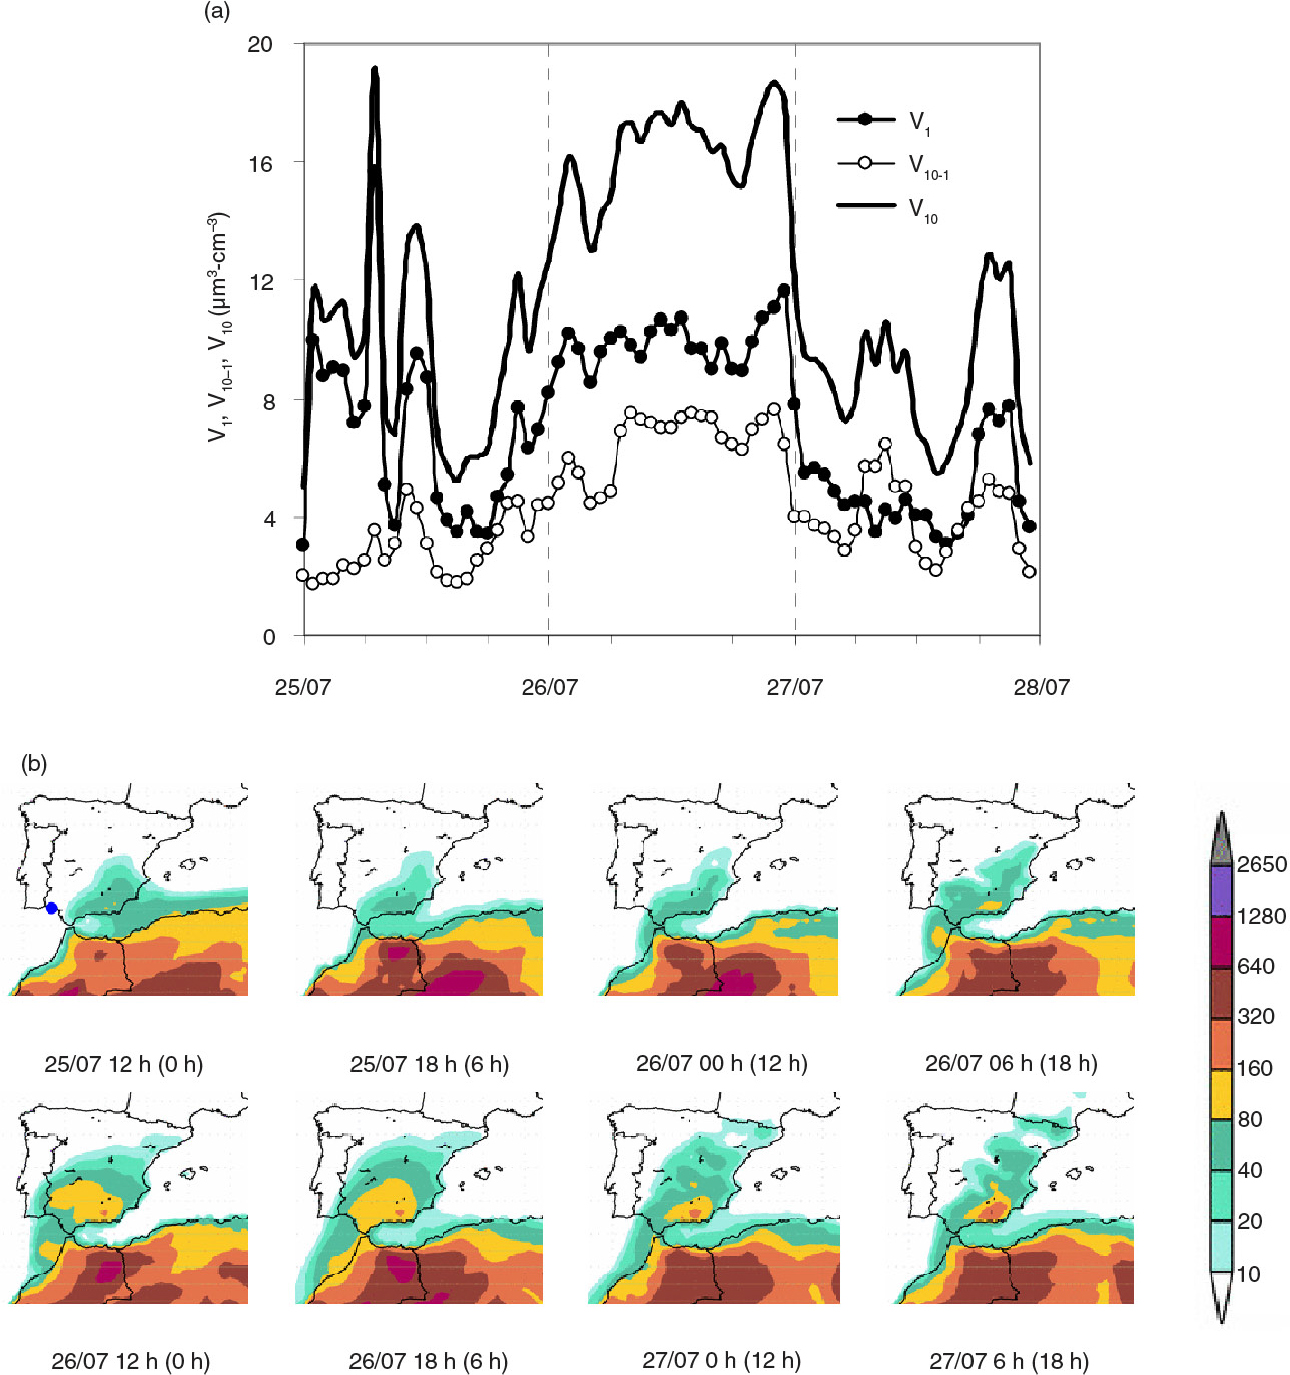
Fig. 3
Desert dust episode at El Arenosillo Station observed during 25–26 July 2009. (a) Sub-micron volume concentration (V1), super-micron volume concentration (V10–1) and total volume concentration (V10) measured by the SMPS-APS system. (b) Daily plots of the dust surface concentration (in µg m−3), provided by the BSC/DREAM model over the Iberian Peninsula from 25 to 27 July. The hours elapsed since the forecasts are indicated between brackets (www.bsc.es/projects/earthscience/DREAM). El Arenosillo Station is identified as a blue dot in the first (b).
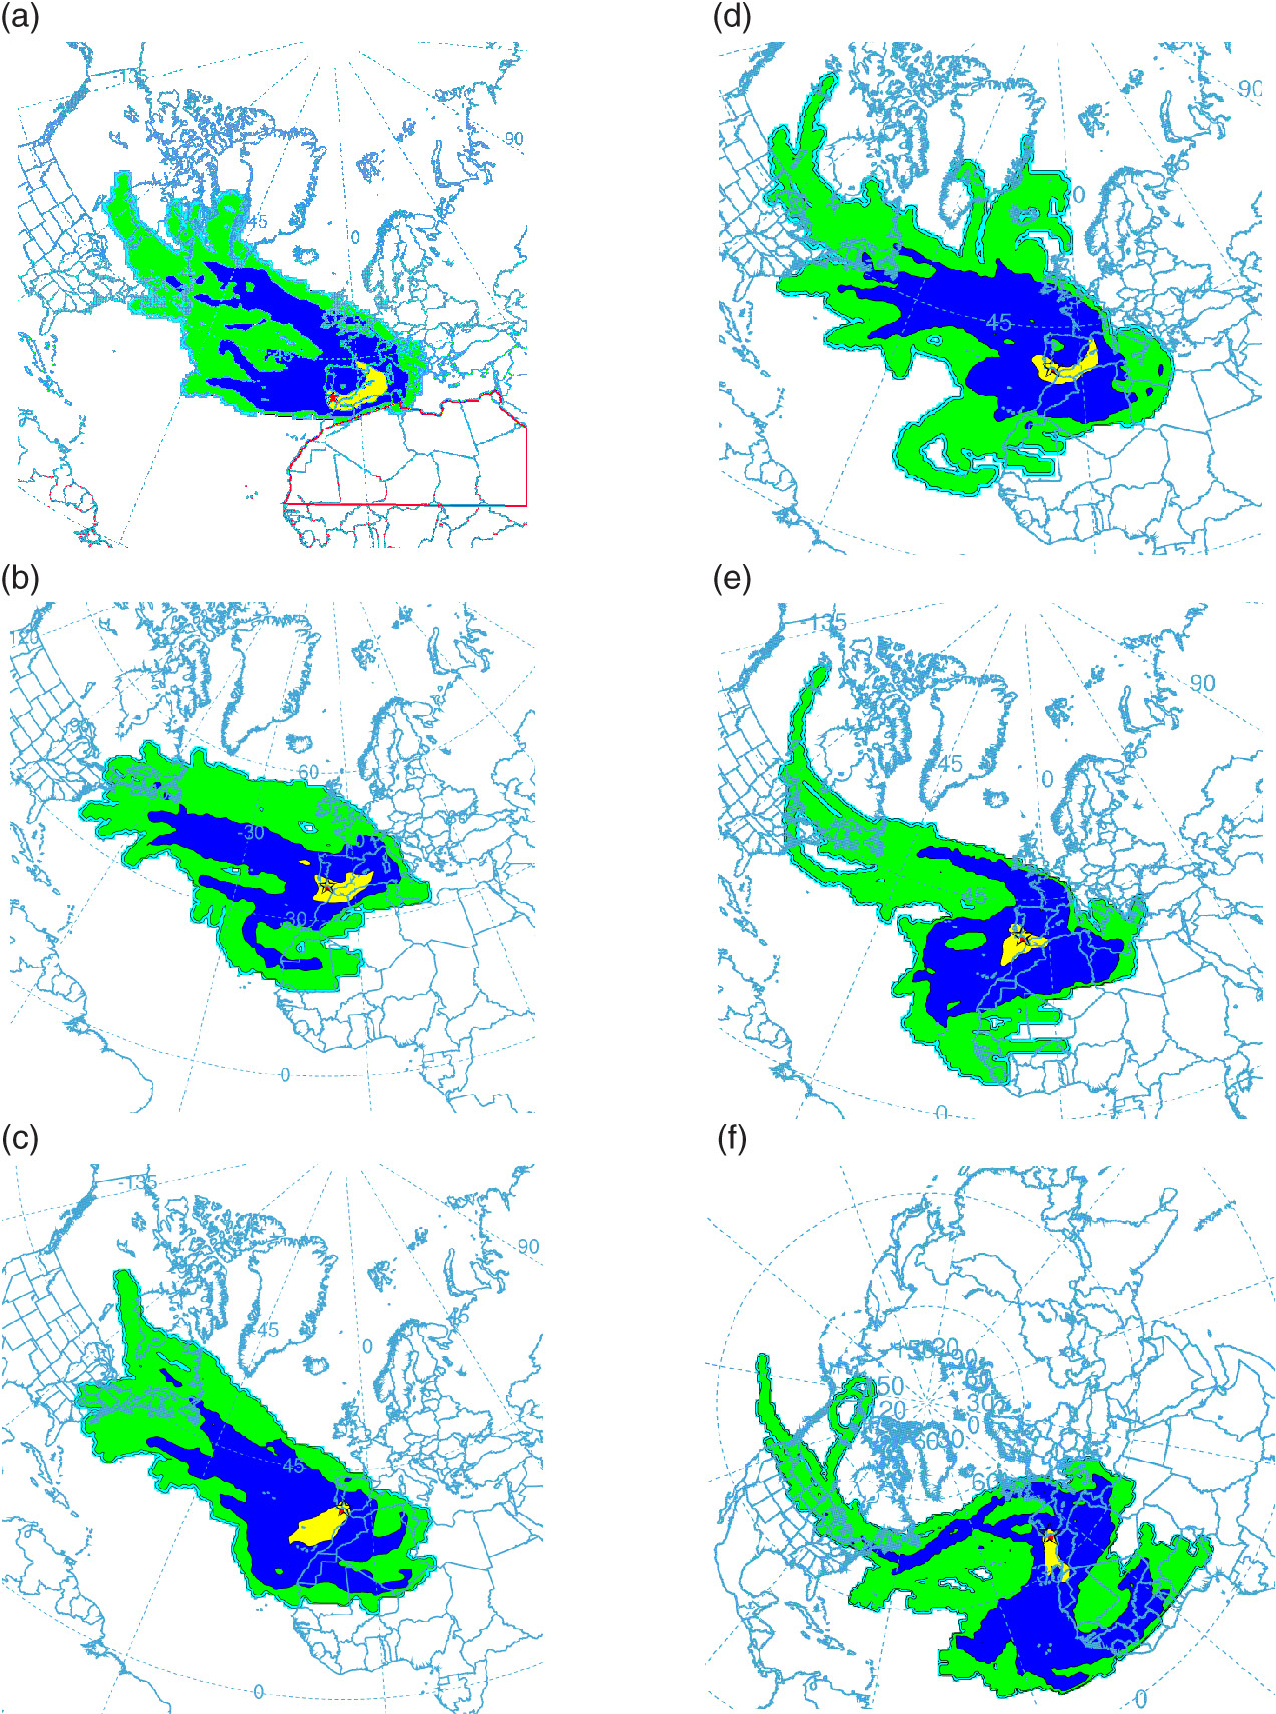
Fig. 4
The back-trajectory frequency evaluated by the HYSPLIT Model at three altitudes, calculated every hour during the desert dust (DD) events. The air flows during the DD-MF days at (a) 500 m, (b) 1500 m and (c) 3000 m and during the DD-MAF days at (d) 500 m, (e) 1500 m and (f) 3000 m. El Arenosillo Station is identified as a red star and the source area of DD as a red line in (a). The colours indicate the frequency (in %) of a backward trajectory crossing over a geographical point (green: >0.1%, dark blue: >1% and yellow: >10%).
{ label needed for table-wrap[@id='UT0002'] }
Table 2. Mean hourly values of the primary microphysical and optical aerosol parameters (for dry conditions) during the N-DD, DD-MF and DD-MAF days from 1 May to 30 September 2009
DD-MF: 574
DD-MAF: 424V1µm3 cm−35 (3)4.5 (1.8)10 (4)9.7 (1.4)8 (3)6.7 (1.7)N-DD: 2024
DD-MF: 560
DD-MAF: 380V10–1µm3 cm−34.2 (2.1)3.7 (1.7)5.3 (2.2)4.8 (1.5)9 (5)7.5 (1.9)N-DD: 2010
DD-MF: 574
DD-MAF: 424V10µm3 cm−39 (4)8.6 (1.6)16 (4)15.1 (1.3)17 (6)15.6 (1.5)N-DD: 1822
DD-MF: 469
DD-MAF: 363RV–0.54 (0.15)0.5 (1.4)0.65 (0.12)0.6 (1.2)0.46 (0.15)0.4 (1.4)N-DD: 1822
DD-MF: 469
DD-MAF: 363PM10µg cm−322 (10)20 (1.7)34 (10)32 (1.4)36 (12)34 (1.5)N-DD: 2264
DD-MF: 545
DD-MAF: 704Optical parametersRSP–0.58 (0.17)0.6 (1.4)0.77 (0.09)0.8 (1.1)0.54 (0.10)0.5 (1.2)N-DD: 1158
DD-MF: 177
DD-MAF: 229Da<10 µmσspMm−129 (16)26.4 (1.6)51 (16)48.6 (1.4)46 (25)41.3 (1.6)N-DD: 1422
DD-MF: 204
DD-MAF:257b–0.122 (0.019)0.1 (1.1)0.129 (0.013)0.1 (1.1)0.120 (0.015)0.1 (1.1)N-DD: 1404
DD-MF: 204
DD-MAF: 257å–1.2 (0.4)1.2 (1.5)1.7 (0.2)1.6 (1.1)1.2 (0.3)0.1 (1.1)N-DD: 1422
DD-MF: 204
DD-MAF: 257Da<1 µmσspMm−117 (13)14.4 (1.8)39 (14)36.4 (1.4)26 (15)22.8 (1.7)N-DD: 1165
DD-MF: 177
DD-MAF: 229b–0.137 (0.018)0.1 (1.14)0.135 (0.016)0.1 (1.1)0.135 (0.020)0.1 (1.2)N-DD: 1153
DD-MF: 177
DD-MAF: 229å–2.0 (0.3)2.0 (1.8)2.00 (0.20)2.0 (1.1)2.03 (0.25)2.0 (1.1)N-DD: 1158
DD-MF: 177
DD-MAF: 229
{ label needed for table-wrap[@id='UT0003'] }
Table 3. Statistics (absolute and relative differences) of microphysical and optical properties (for dry conditions) between desert dust and non-desert dust days (N-DD & DD-MF and N-DD & DD-MAF)
[i] (+) symbol means higher values during DD days and (−) symbol means lower values during DD days. If the differences are not significantly different, it is indicated with an asterisk. aThe absolute and relative differences are calculated using the geometric means; bthe absolute and relative differences are calculated using the arithmetic means.
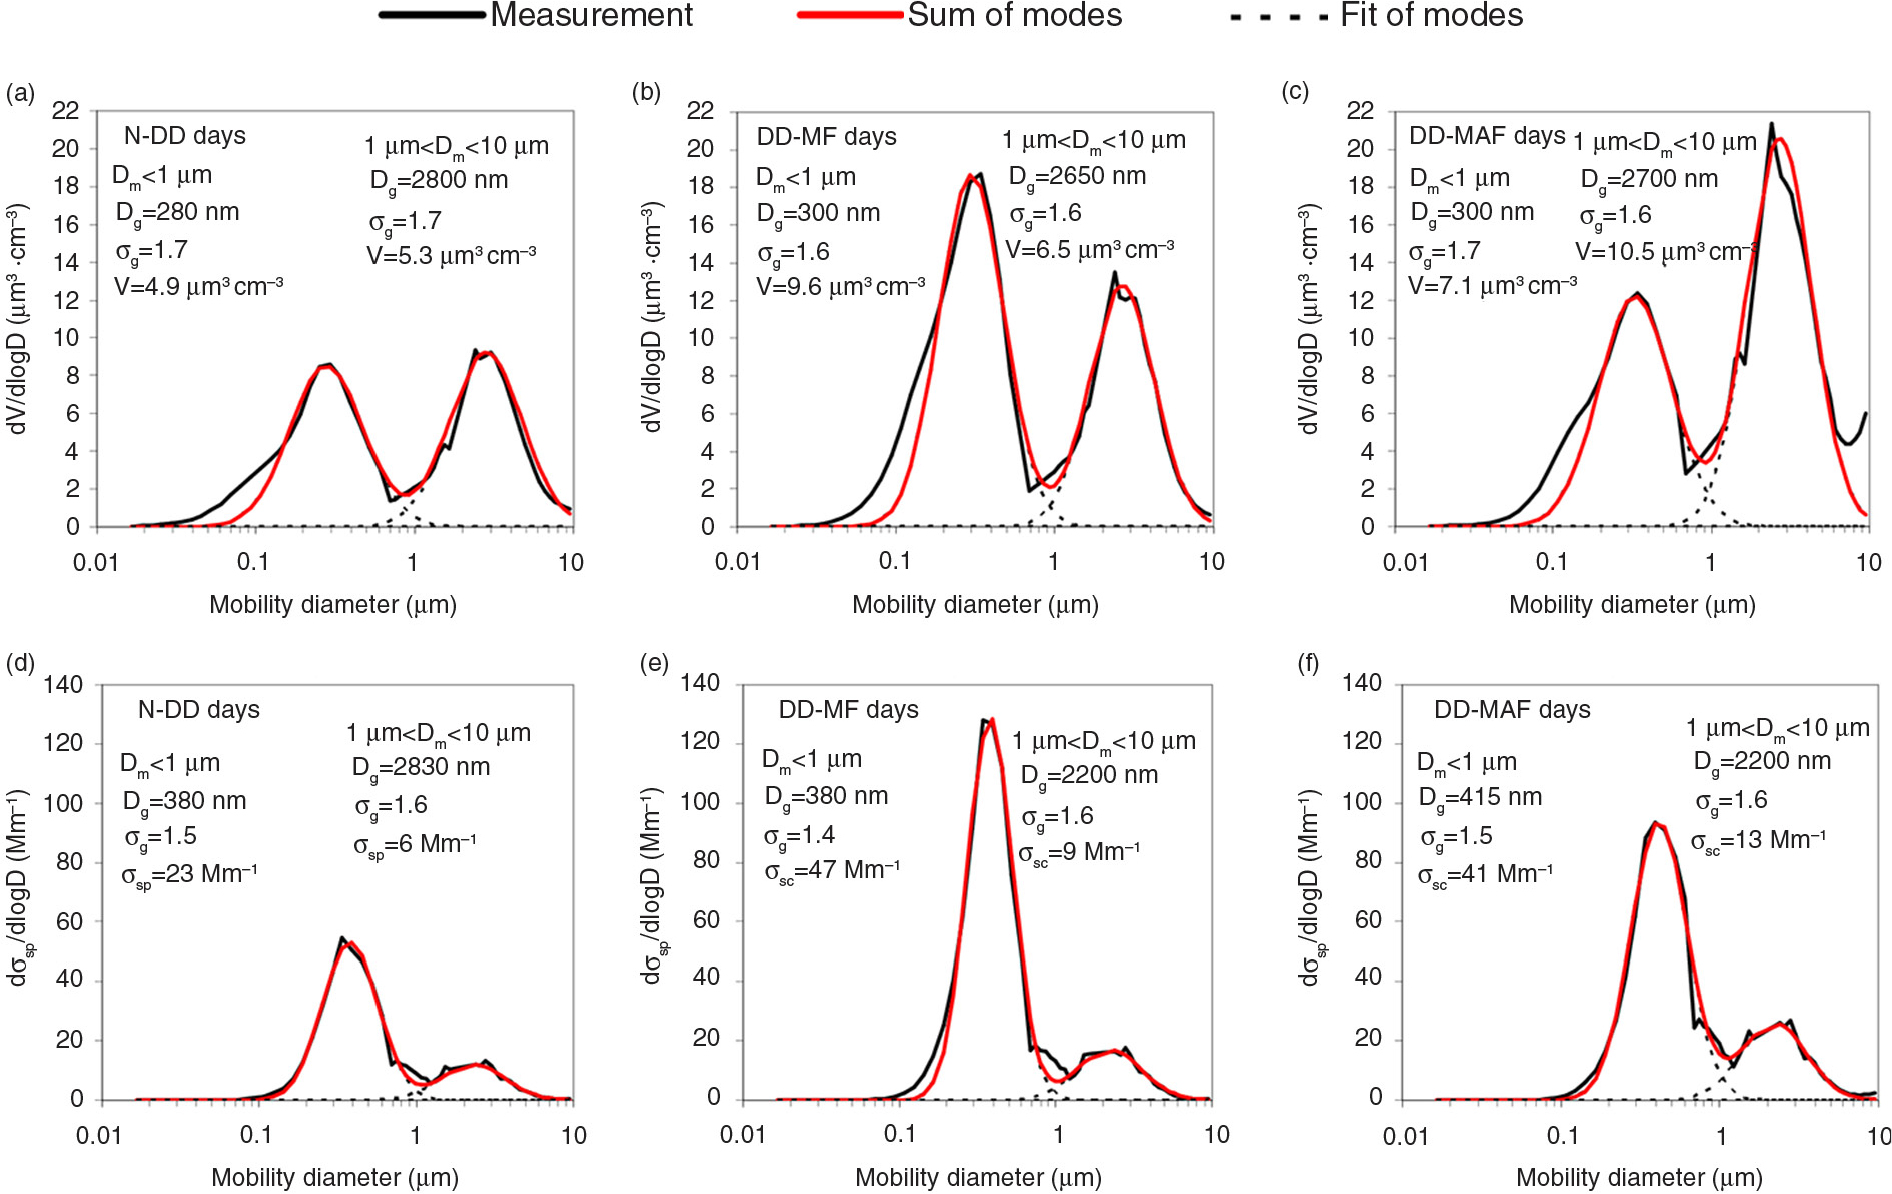
Fig. 5
Mean size distribution of V and σsp and the fitting size distributions of the two log-normal modes and their sum for each type of day (N-DD, DD-MF and DD-MAF). (a, b and c): dV/d log D and (d, e and f): dσsp/d log D. The modal parameters (geometric mean diameter, Dg, the geometric SDs, σg, and the total mode concentration), V and σsp are also shown.
Table 4. Pearson's correlation coefficients (R) obtained by linear regression of AOD (500 nm) versus V within several particle size ranges, as well as, between RSP and RV with FMF
Table 5. The coefficients a and b of the linear regression V=a·AOD+b, for R>0.7, as shown in Table 4.