
Table 1. The chemical reactions associated with CO and the corresponding reaction rates in the WACCM
[i] Adopted from Sander et al. (2003).
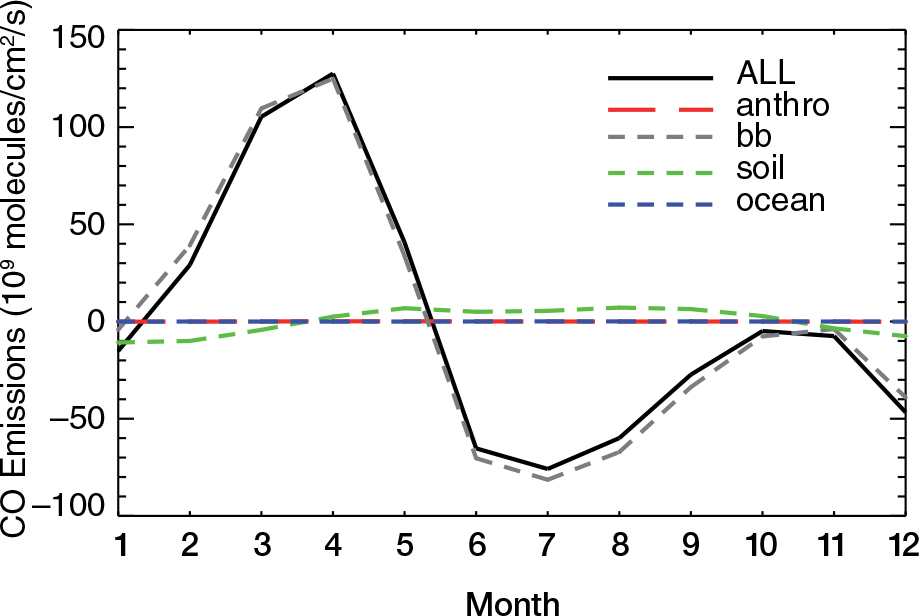
Fig. 1
Temporal variations of zonal mean CO surface emissions anomalies (solid line) averaged over the latitude band 10°N–10°S in the WACCM. The anomalies are defined as the departures of the monthly mean values from their annual mean. Also shown are the zonal mean CO surface emissions anomalies from ‘anthro’ (red dashed line), ‘bb’ (grey dashed line), ‘soil’ (green dashed line) and ‘ocean’ (blue dashed line) sources (see text for the definitions of these abbreviations).
Table 2. The configurations of the numerical experiments
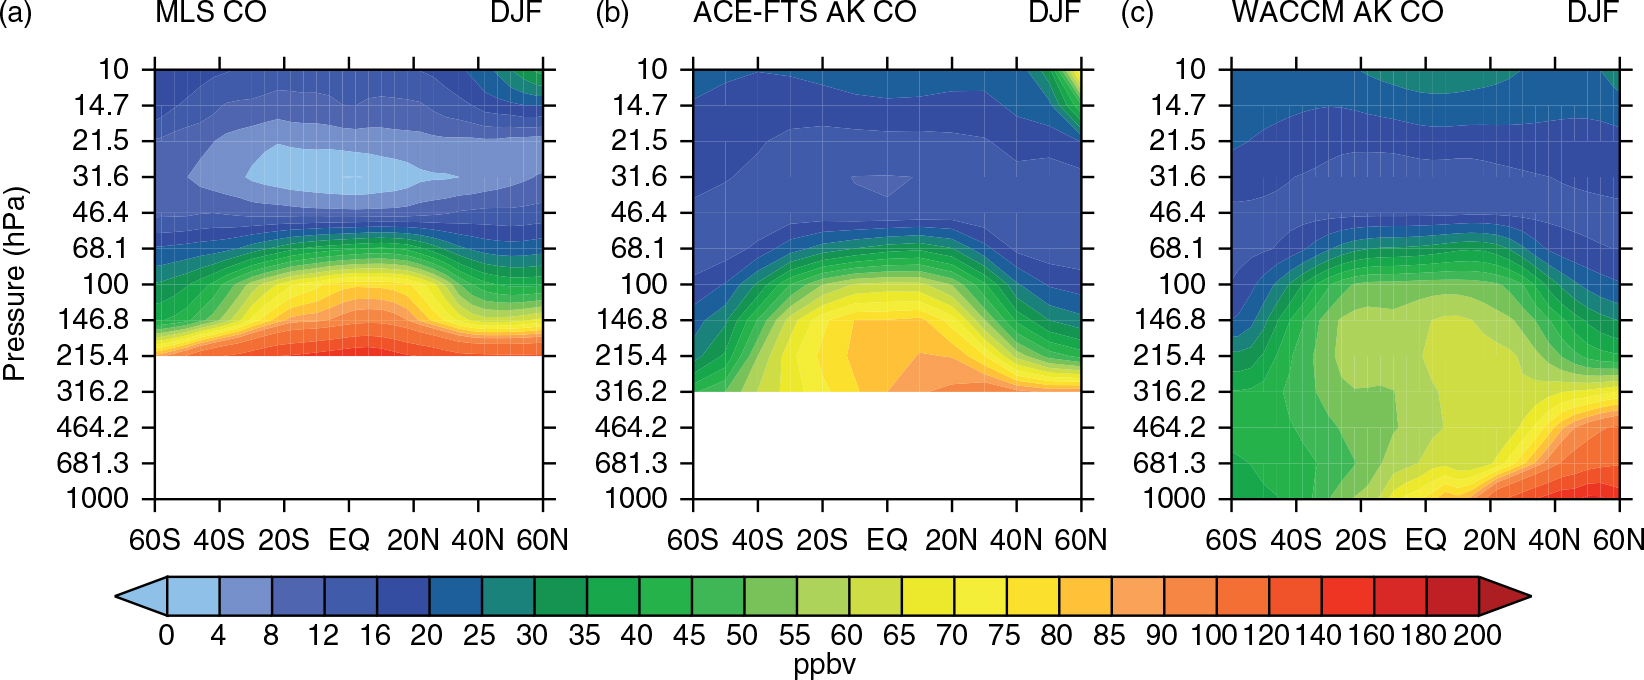
Fig. 2
The latitude–height cross-sections of December–January–February zonal mean CO mixing ratios (unit: ppbv) derived from (a) MLS data, (b) ACE-FTS data and (c) the model simulation in run E0. The ACE-FTS CO and the modelled CO are weighted by the MLS averaging kernels.
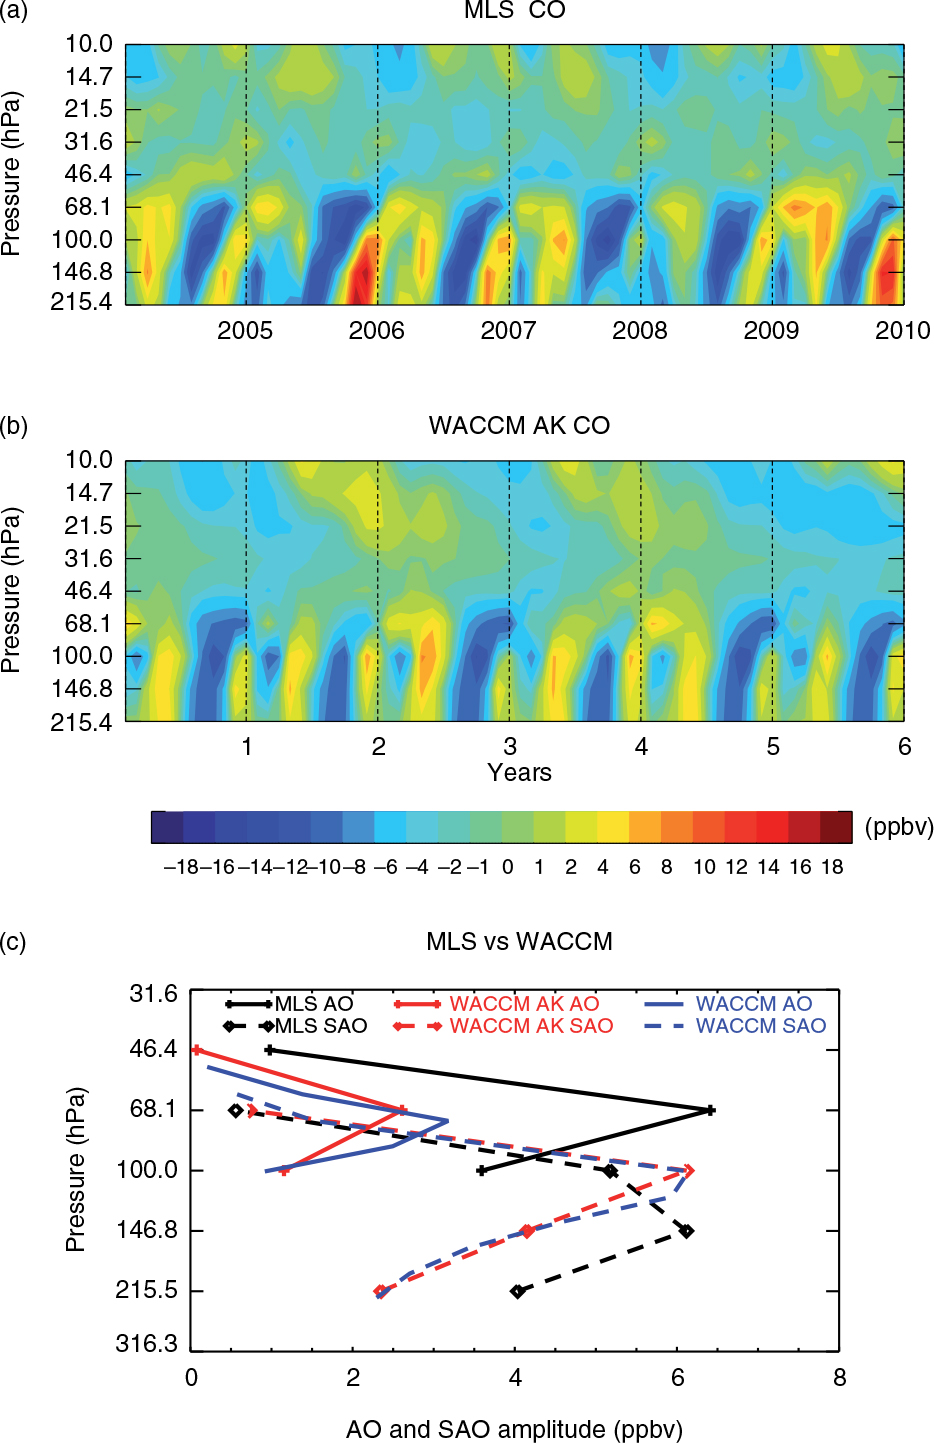
Fig. 3
The (a) MLS and (b) modelled zonal mean CO anomalies in run E0 averaged over the latitude band 10°N–10°S. The modelled CO anomalies are weighted by MLS averaging kernels. The anomalies here are defined as detrended CO time series with 6 yr mean removed from the original time series following Ricaud et al. (2009). Note that only 6 yr of model data are shown since the MLS CO observations cover years from 2005 to 2010. (c) Vertical profiles of the amplitude of the AO (solid lines) and SAO (dashed lines) of zonal mean CO anomalies derived from MLS observations (black lines) and the model simulations (red lines and blue lines). The model results weighted by MLS averaging kernels are shown in red lines. See text for more details of how the AO and SAO amplitudes are estimated.
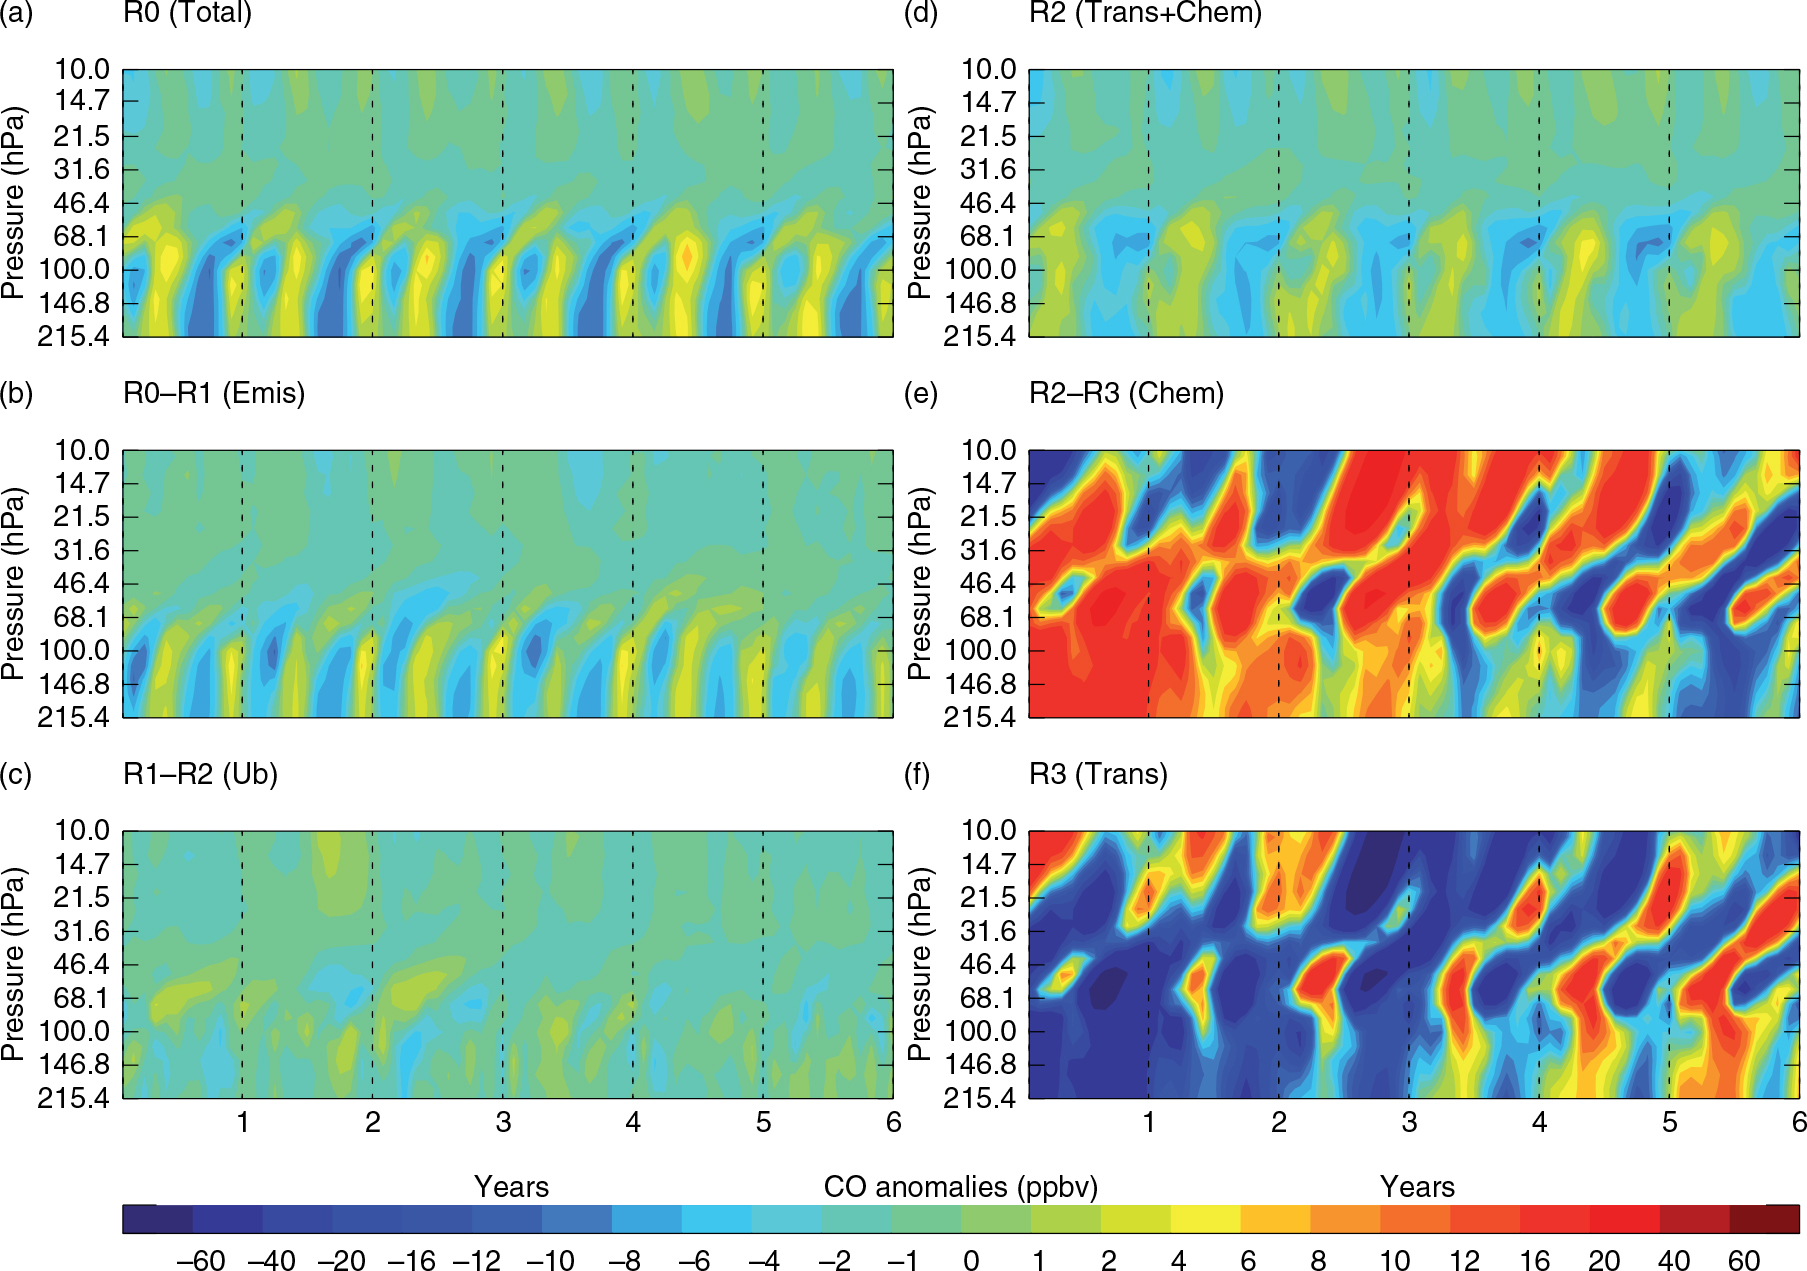
Fig. 4
The modelled zonal mean CO anomalies or difference in CO anomalies averaged over the latitude band 10°N–10°S. (a) The anomalies in run R0 (total), (b) the differences in CO anomalies between run R0 (Total) and run R1 (rmEmis) (i.e. the anomalies caused by the surface emissions), (c) the differences in CO anomalies between run R1 (rmEmis) and run R2 (rmEmis+rmUb) (i.e. the anomalies caused by the CO upper boundary), (d) the anomalies in run R2 (Trans+Chem) (i.e. the anomalies caused by the combination of the chemical and dynamical processes), (e) the differences in CO anomalies between run R2 (Trans+Chem) and run R3 (Trans) (i.e. the anomalies caused by chemical processes) and (f) the anomalies in run R3 (Trans) (i.e. the anomalies caused by dynamical processes).
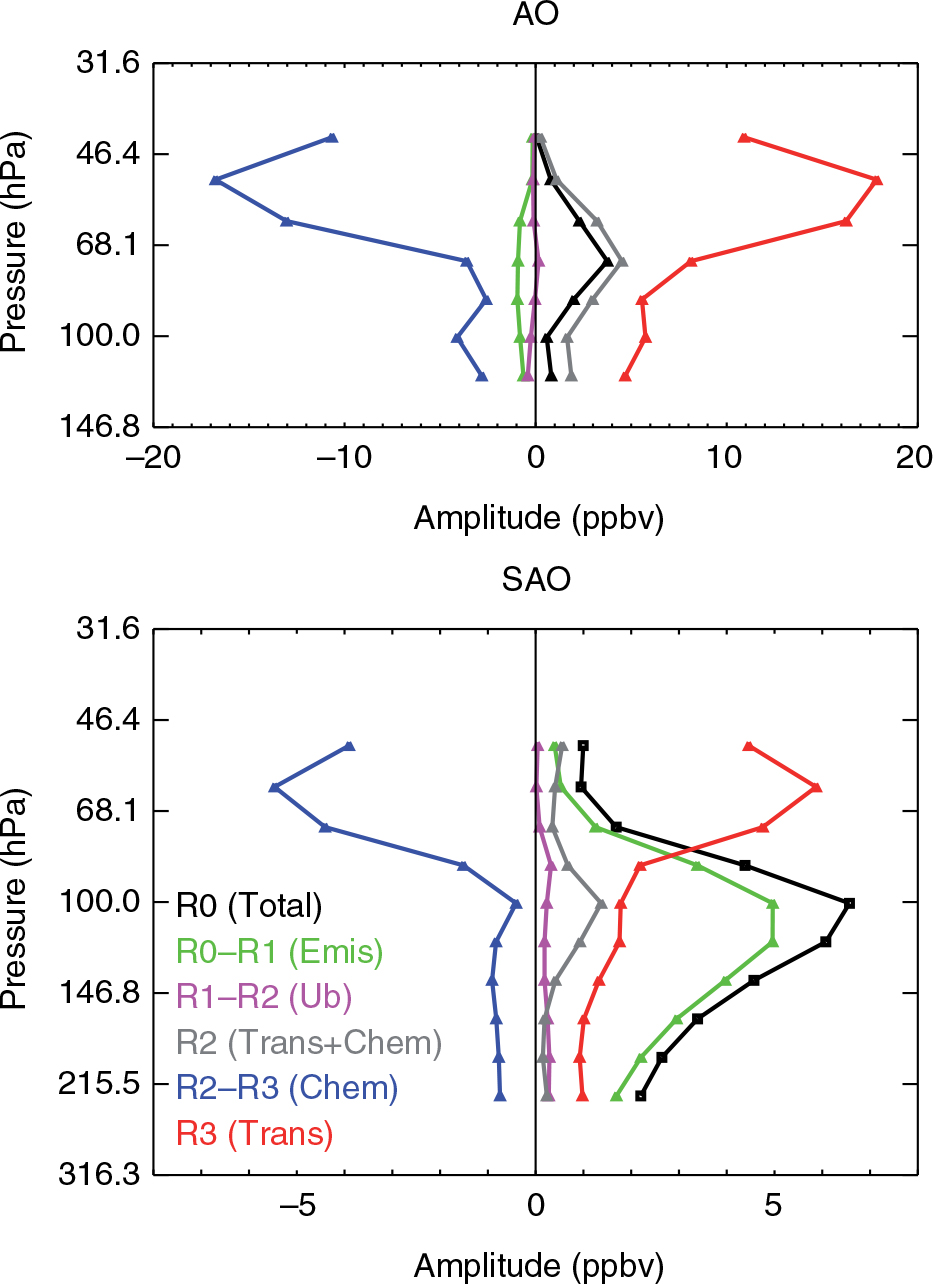
Fig. 5
Vertical profiles of the amplitude of the AO (top) and SAO (bottom) of zonal mean CO anomalies in different runs and their difference between different runs. Black, grey and red lines represent the amplitudes in run R0 (Total), run R2 (Trans+Chem) and run R3 (Trans), respectively. Green, purple and blue lines represent the difference between run R0 (Total) and run R1 (rmEmis), between run R1 (rmEmis) and run R2 (rmEmis+rmUb), and between run R2 (Trans+Chem) and run R3 (Trans), respectively.
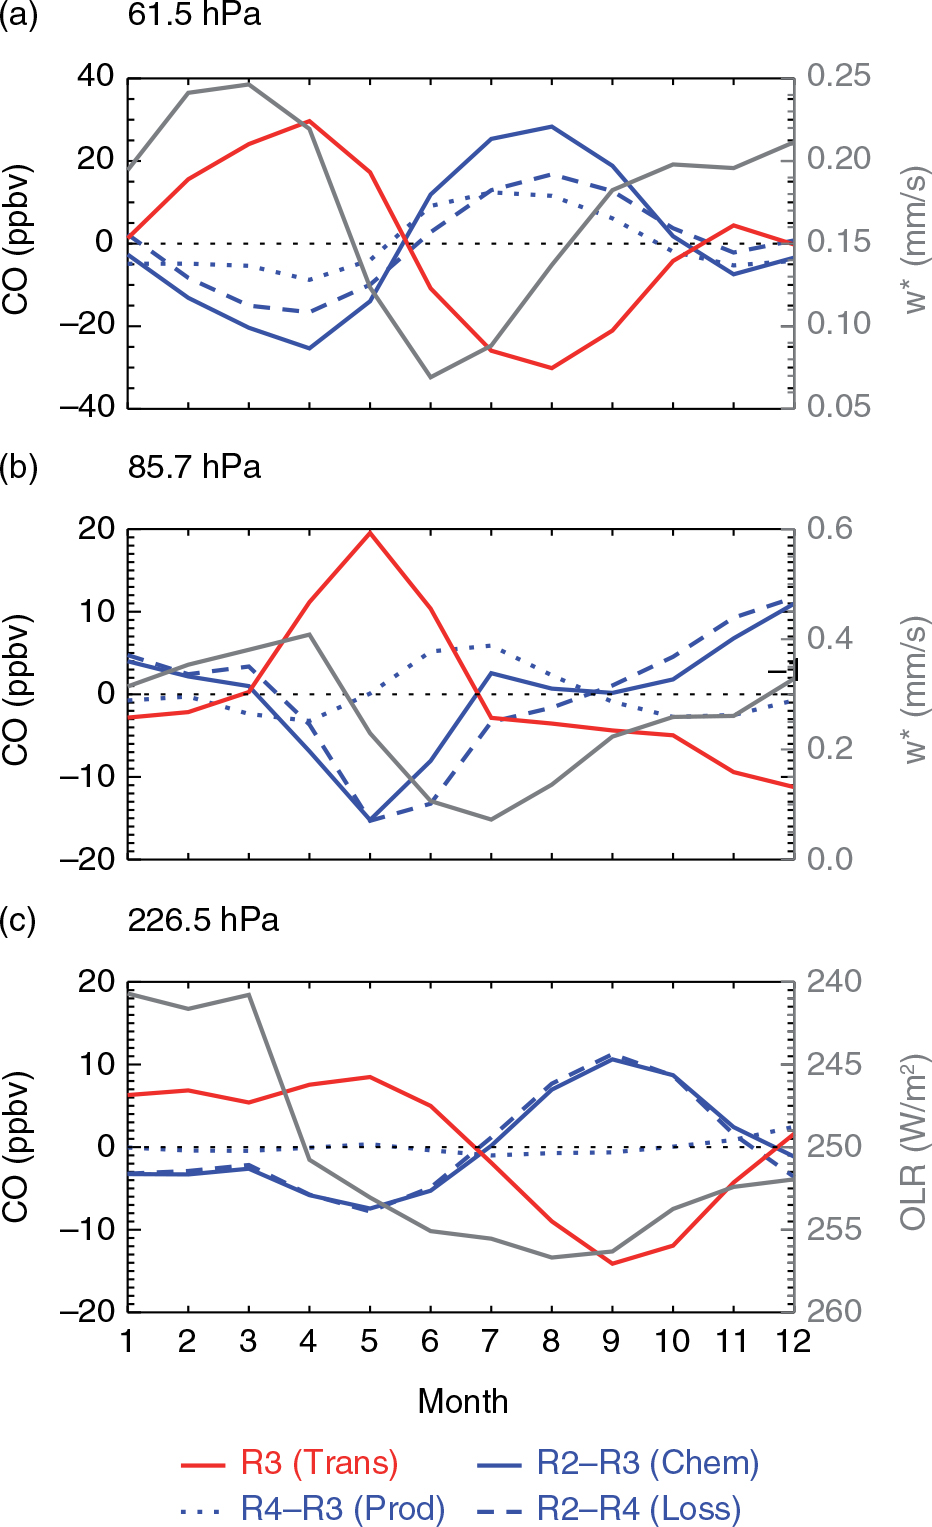
Fig. 6
Seasonal variations of the differences in modelled zonal mean CO anomalies averaged over the latitude band 10°N–10°S between different runs at (a) 61.5 hPa, (b) 85.7 hPa and (c) 226.5 hPa. Blue solid lines, blue dotted lines and blue dashed lines represent the differences between runs R2 (Trans+Chem) and R3 (Trans) (i.e. the CO changes associated with the chemical processes), R4 (Trans+Prod) and R3 (Trans) (i.e. the CO changes associated with the CO chemical production), and runs R2 (Trans+Chem) and R4 (Trans+Prod) (i.e. the CO changes associated with the CO chemical loss). Red solid lines represent the CO anomalies in runs R3 (Trans) (i.e. the CO changes associated with dynamical processes). The time series of the zonal mean OLR averaged over 10°N–10°S (grey solid line) is also shown in Fig. 5c. The time series of residual vertical velocities (grey solid line) at 61.5 and 85.7 hPa are also shown in Fig. 6a and b, respectively.
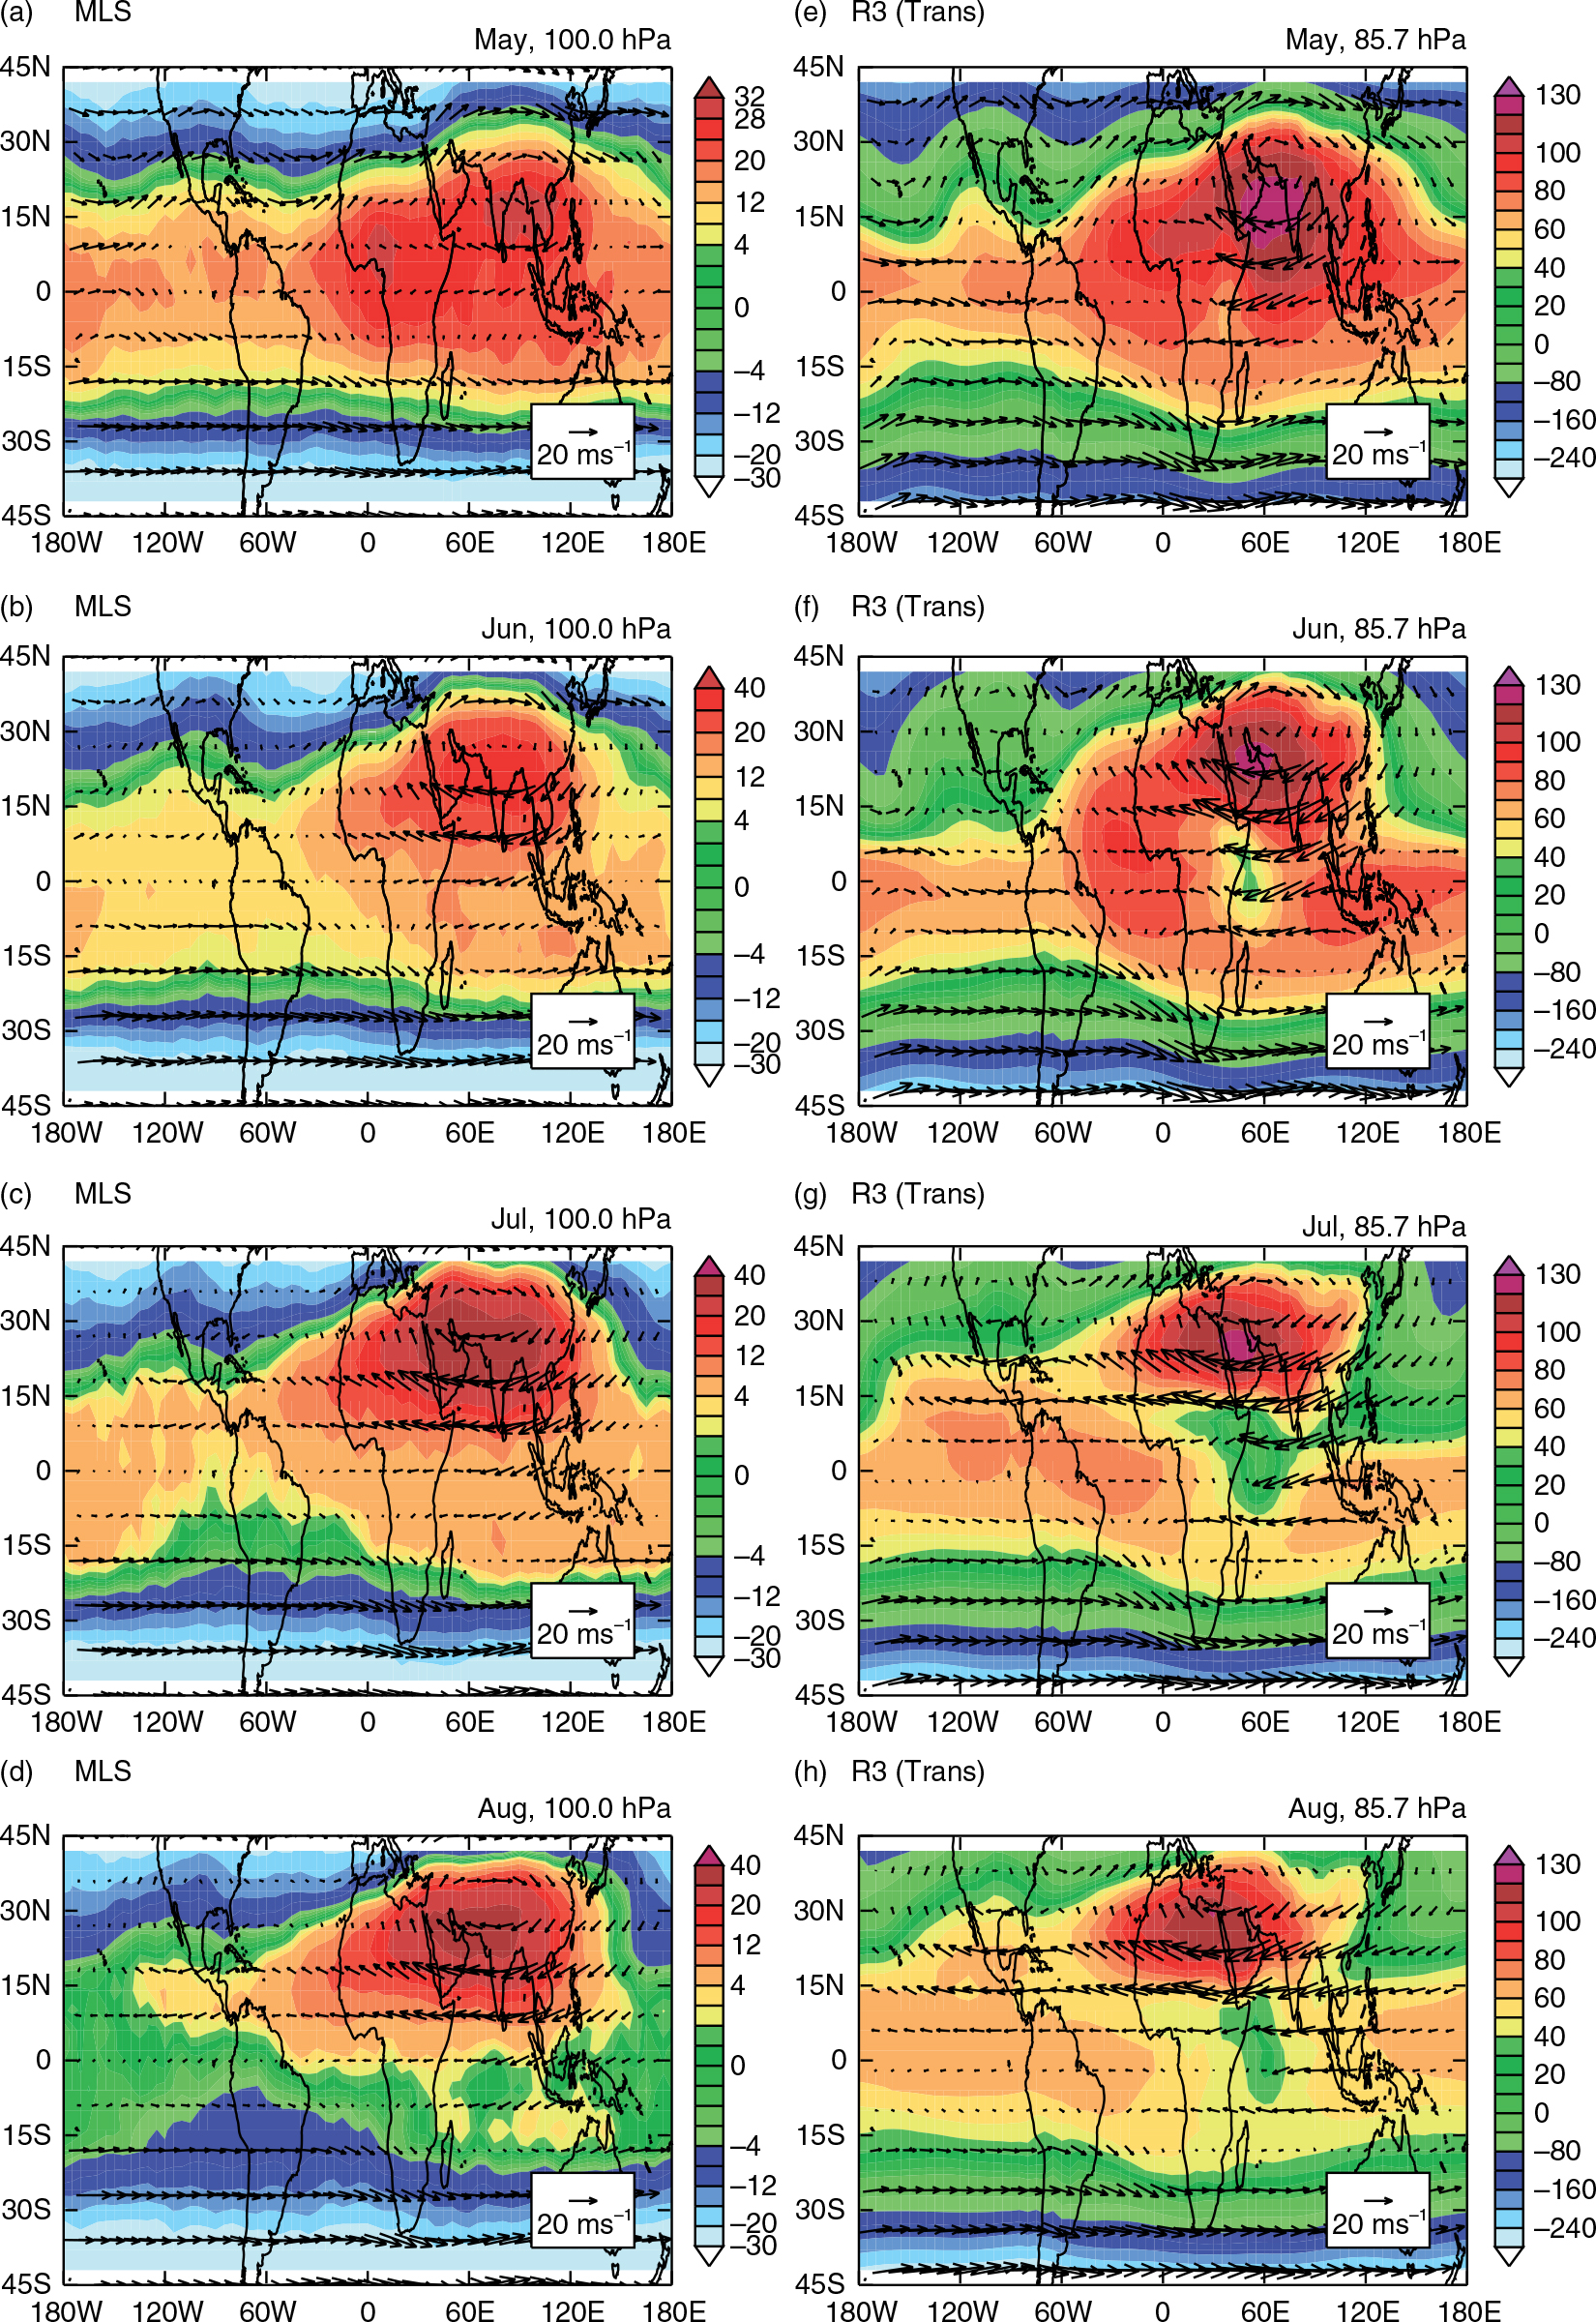
Fig. 7
The horizontal distributions of the monthly mean CO anomalies (deviations from zonal mean CO mixing ratios over the latitude band 42°N–42°S, unit: ppbv) (filled contours) in (a, e) May, (b, f) June, (c, g) July and (d, h) August at (a–d) 100 hPa derived from the MLS CO data and (e–h) 85.7 hPa in the modelled CO in run R3 (Trans). Arrows indicate horizontal wind fields obtained from (a–d) ERA-interim data and (b–h) the model simulations in run R3 (Trans) at the corresponding level.
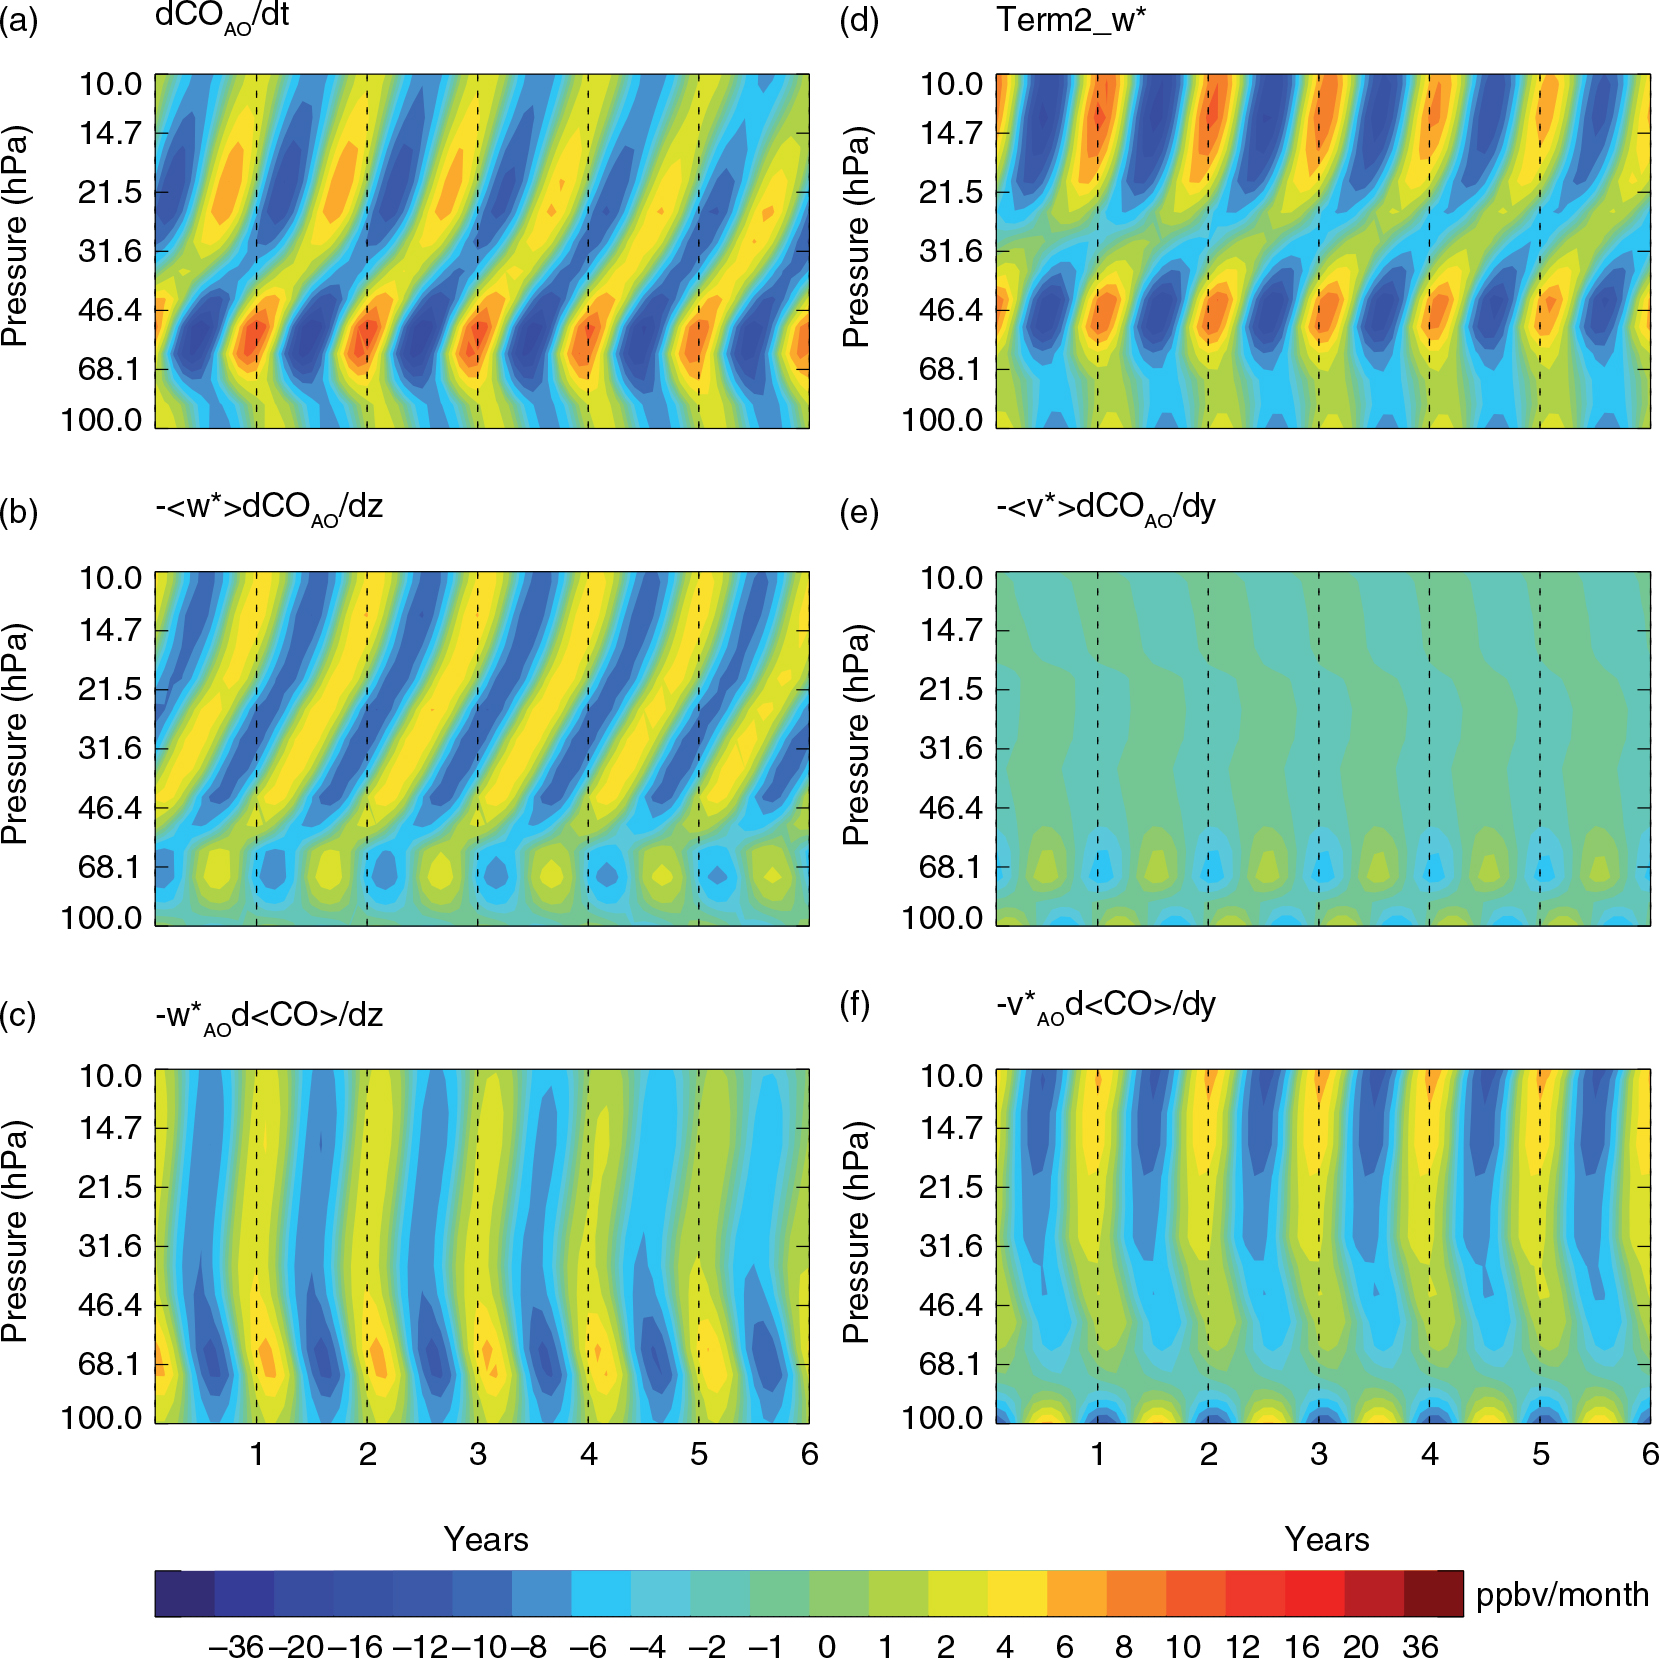
Fig. 8
The time–height cross sections of (a) , (b) , (c) , (d) Term2_w*, (e) and (f) averaged over the latitude band 10°N–10°S derived from the model outputs in run R3 (Trans) (see text for the definitions of these terms).