
Table 1. Description of stations used in the analysis
1Rabat-SaleRAB34.050°N6.767°W79NCDC2CasablancaCASA33.550°N7.640°W57NCDC3BecharBEC31.500°N2.250°W816NCDC, UW4OuarzazateOZT30.939°N6.909°W1140NCDC, AERONET5TindoufTIN27.700°N8.160°W439NCDC6ZagoraZGA30.35°N5.867°W820NCDC7In SalahINS27.230°N2.500°E269NCDC, UW8TamanrassetTAM22.780°N5.510°E1378NCDC, UW, AERONET9SaadaSAD31.626°N8.156°W420AERONET10Ra-El-AinRAS31.670°N7.599°W570AERONET
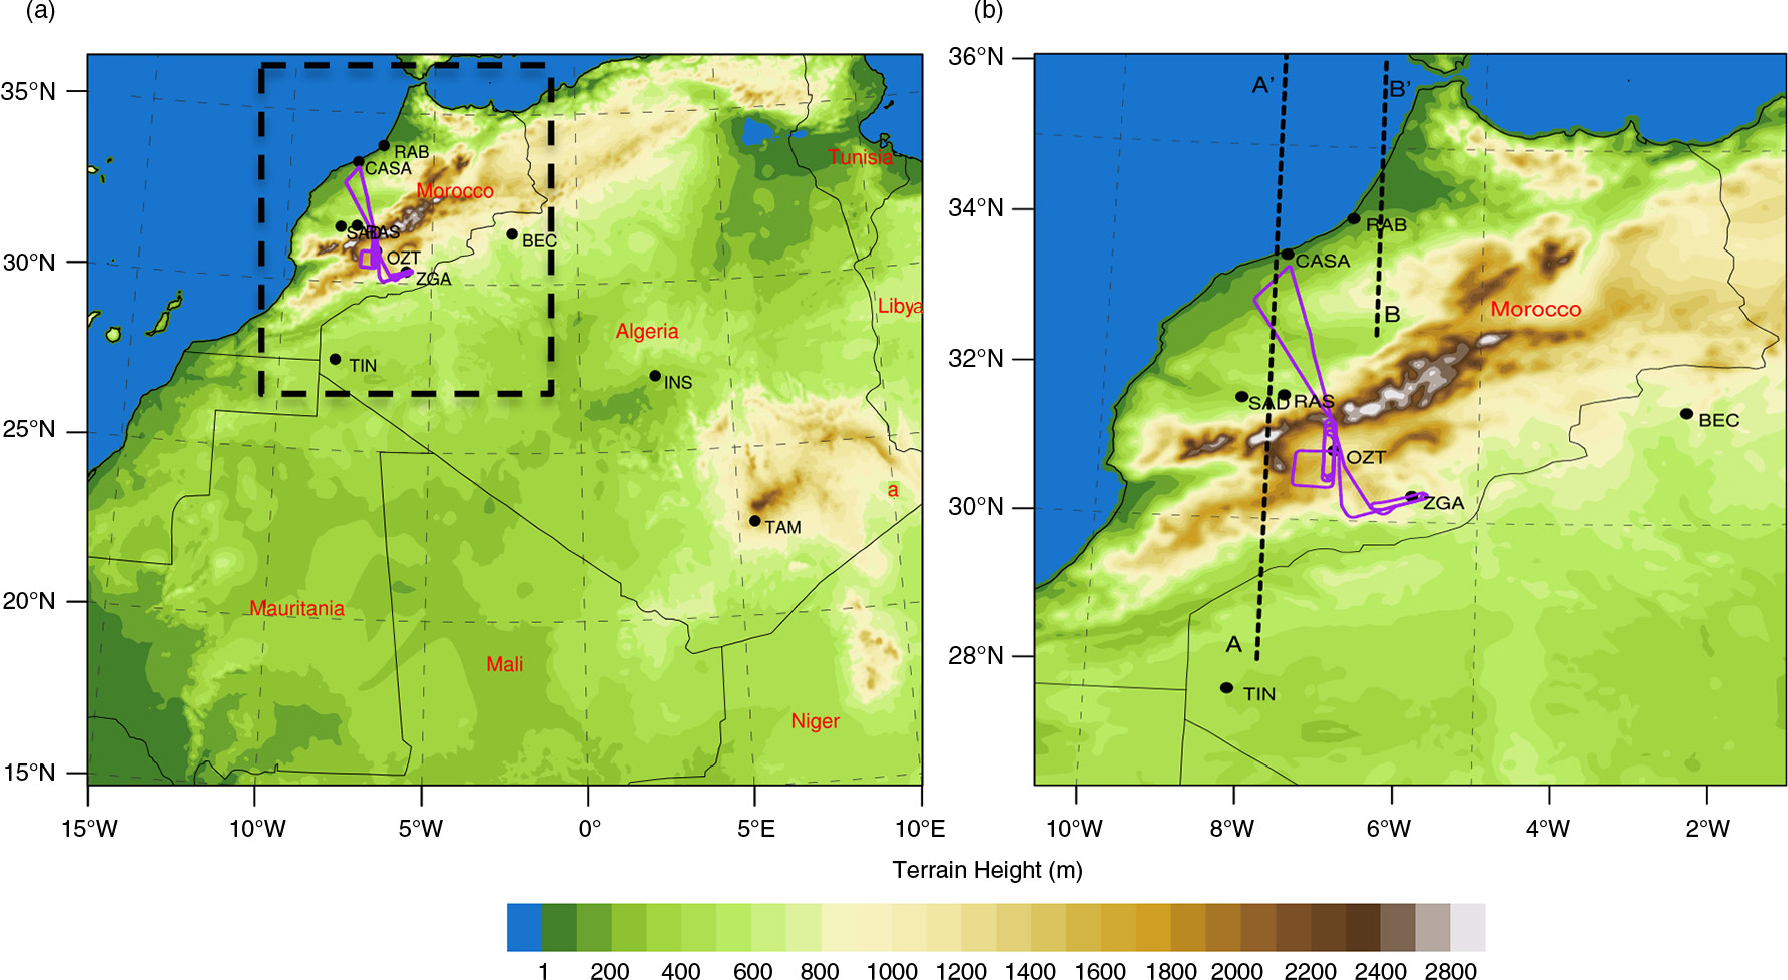
Fig. 1
Maps of the simulation domains with terrain height (shaded), SAMUM-I flight track (purple solid line) on 4 June 2006, and locations of observation stations used in the analysis: (a) the large domain with the black dashed box indicating the area of the small domain; (b) small domain; lines AA′ and BB′ show locations of vertical cross-sections at 7.79°W and 6.3°W, respectively. The description of the observation stations is provided in Table 1.
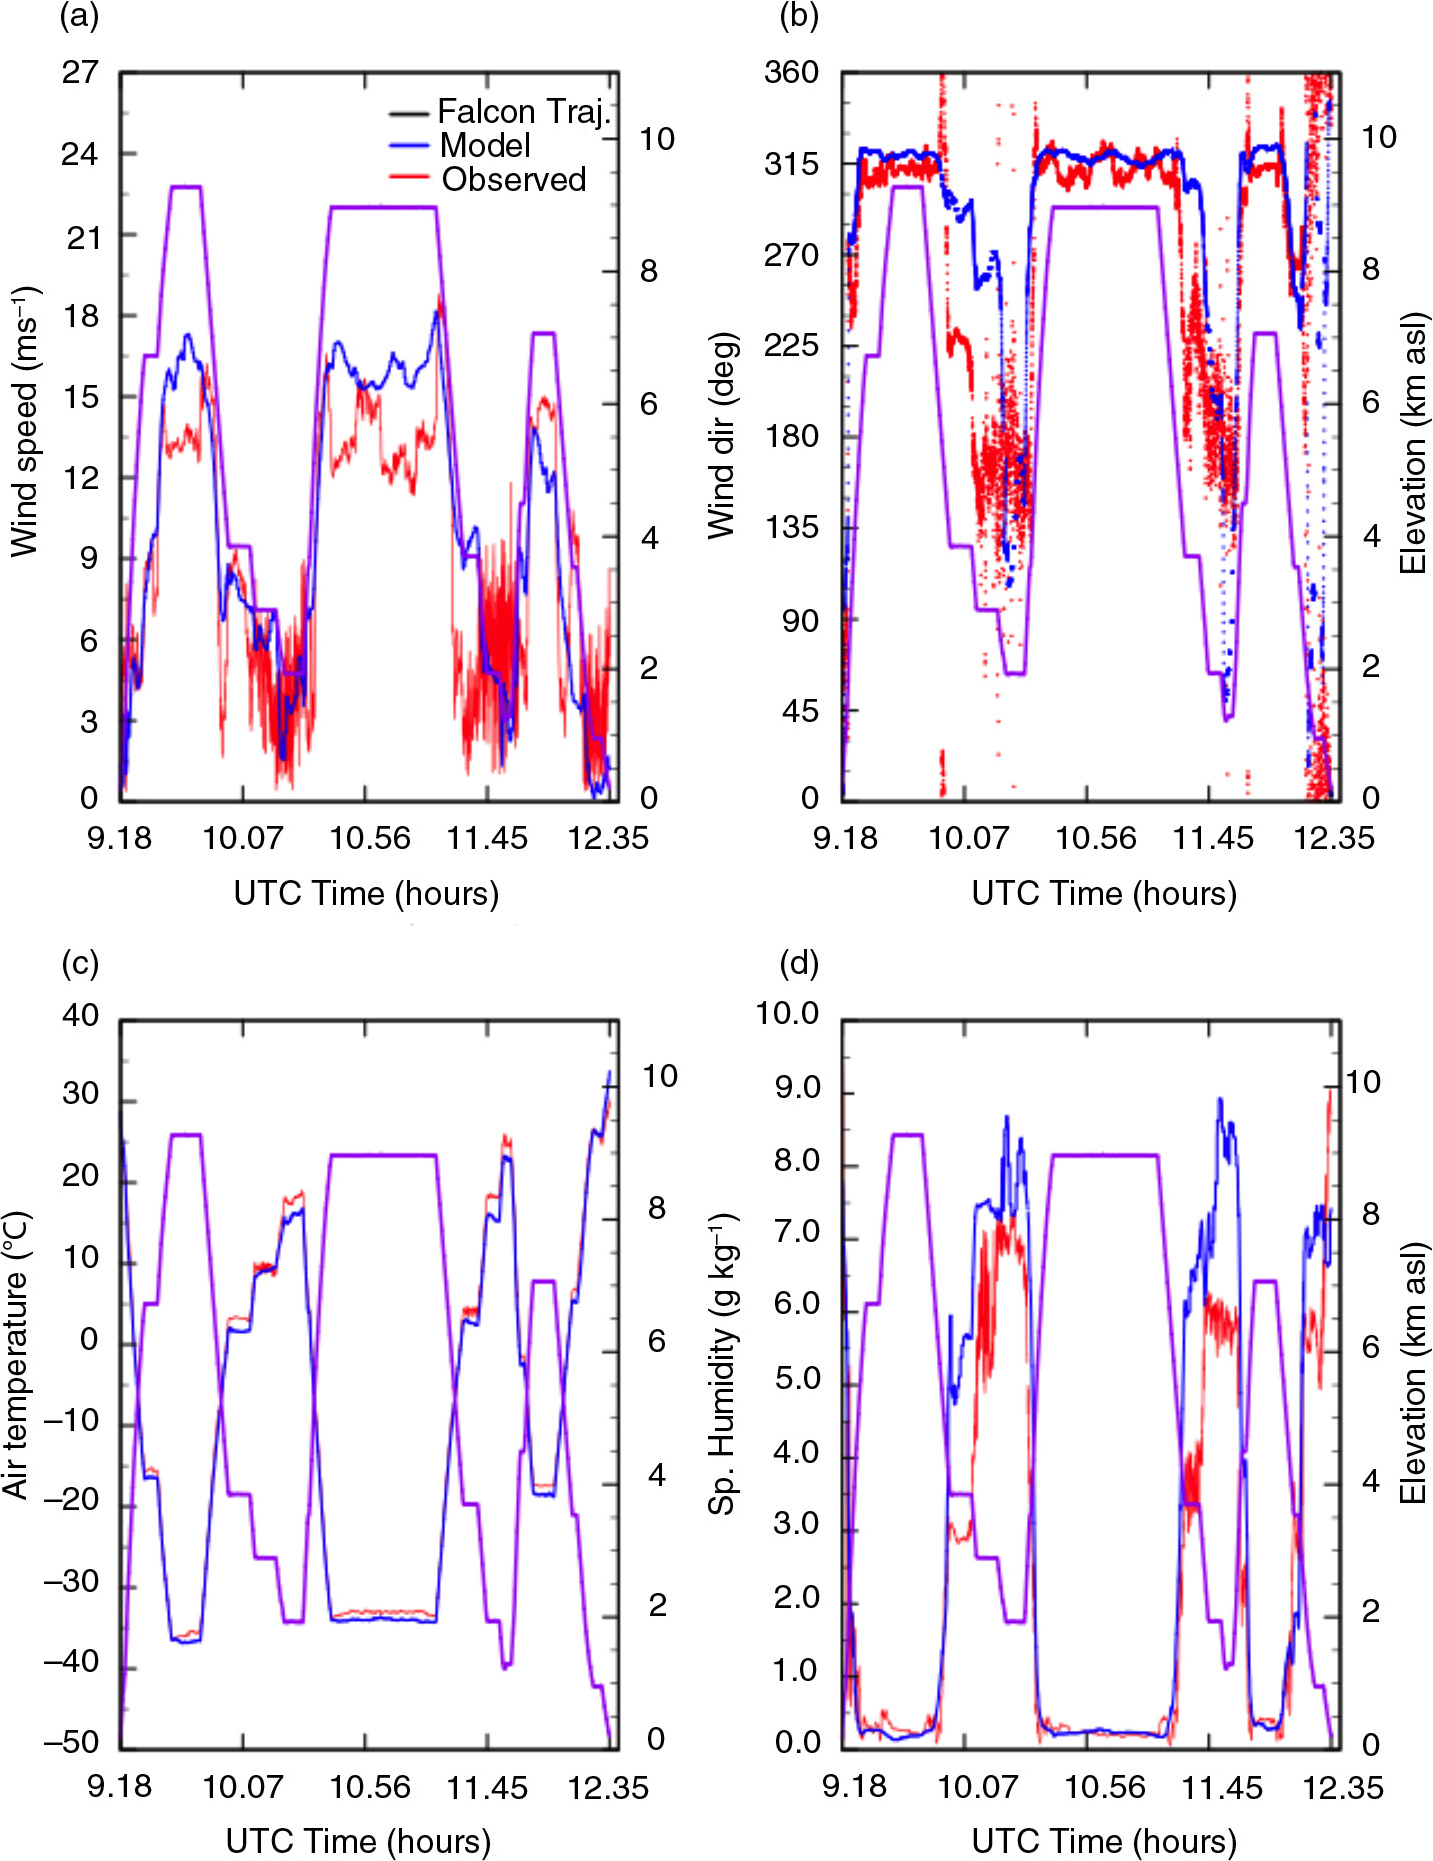
Fig. 2
Plots of the model (blue) wind speed (m s−1), wind direction (degrees), air temperature (°C) and specific humidity (g kg−1) with the aircraft observations (red) conducted during the research flight on 4 June 2006 from 09:18 to 12:35 UTC. The solid purple line shows the height of the flight trajectory (km) with respect to the vertical axis on the right.
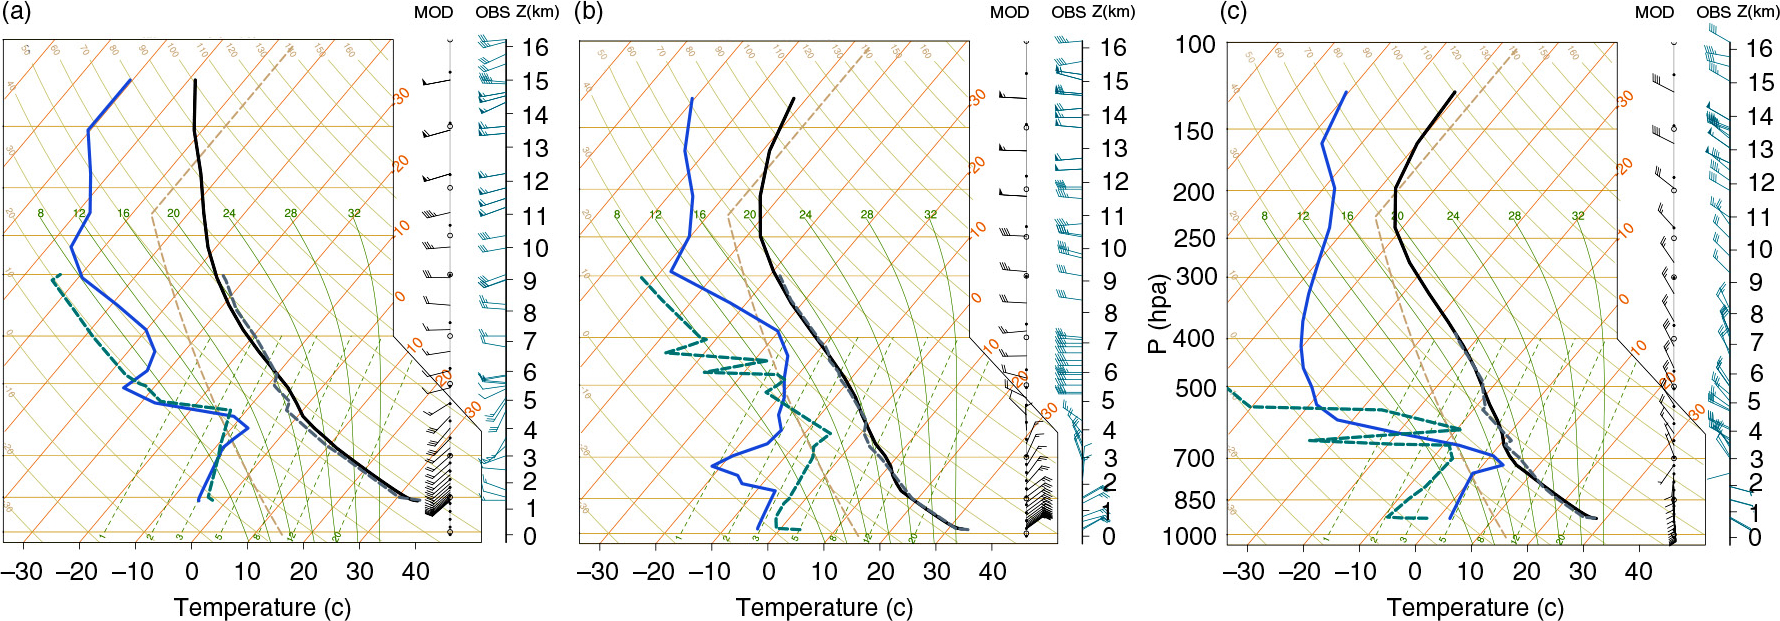
Fig. 3
Skew-T plots of simulated and observed soundings on 4th June 2006 for (a) Tamanrasset, (b) In Salah, and (c) Bechar at 12:00 UTC. Solid black and blue curves show air and dew point temperatures (°C) from the model while dashed grey and dashed cyan curves show observed soundings of air and dew point temperatures, respectively. Black wind barbs show model wind vector while cyan colour barbs show observed winds in knots.
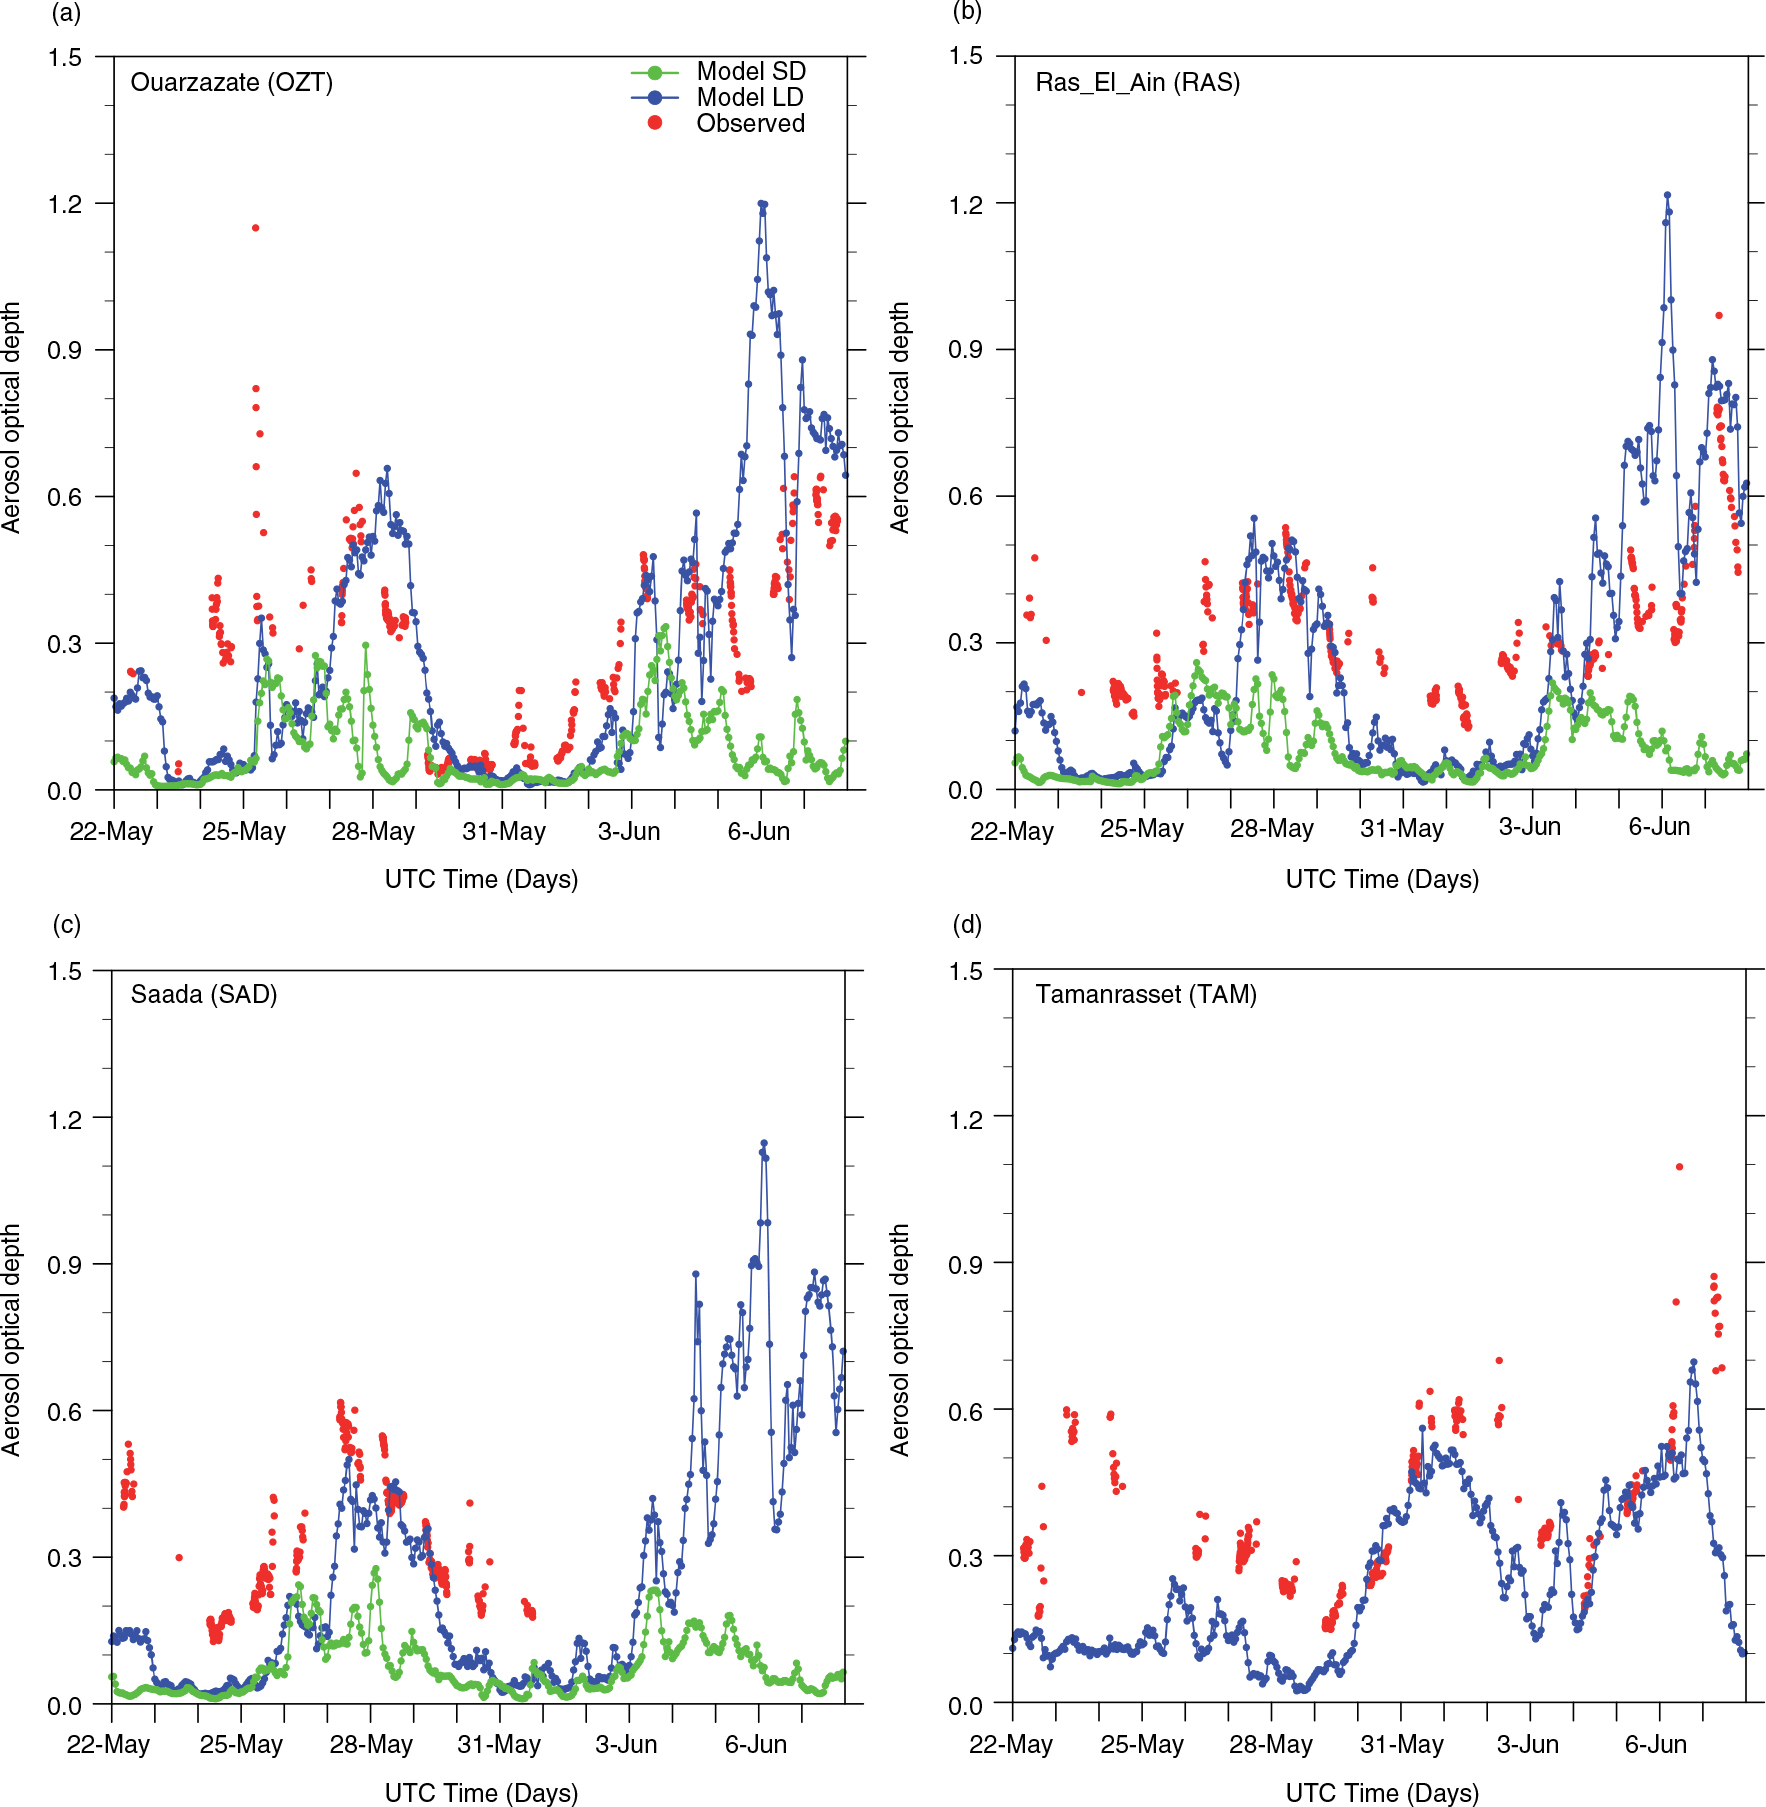
Fig. 4
Plots of the column AOD time series for the period of the SAMUM-I experiment: observation at 0.551 µm (red) from four AERONET stations and simulation at 0.6 µm in the LD (blue) and SD (green) at (a) Ouarzazate (OZT), (b) Ras-Al-Ain (RAS), (c) Saada (SAD), and (d) Tamanrasset (TAM). The geographical coordinates of the AERONET stations are provided in Table 1. AERONET level 1.5 data are used. TAM is beyond SD, and therefore TAM AERONET AOD cannot be compared with the AOD simulated in SD.
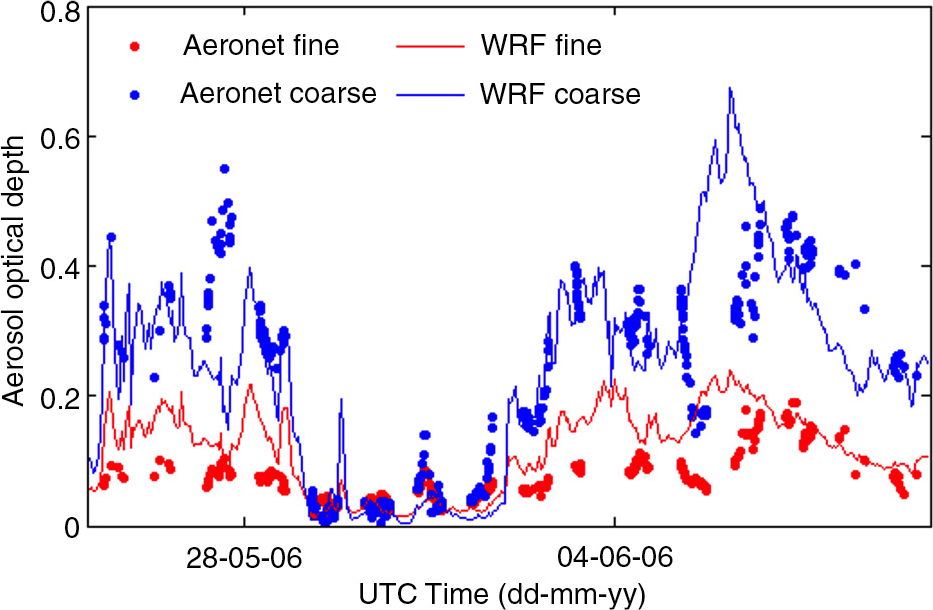
Fig. 5
Plots of the column AOD time series for 0.6 µm from the WRF-Chem simulations (solid lines) and AERONET observations for 0.551 µm (filled circles) for the fine (red) and coarse (blue) modes at the location of the Ouarzazate AERONET station. The AERONET retrievals are calculated using the Spectral Deconvolution Algorithm (SDA).
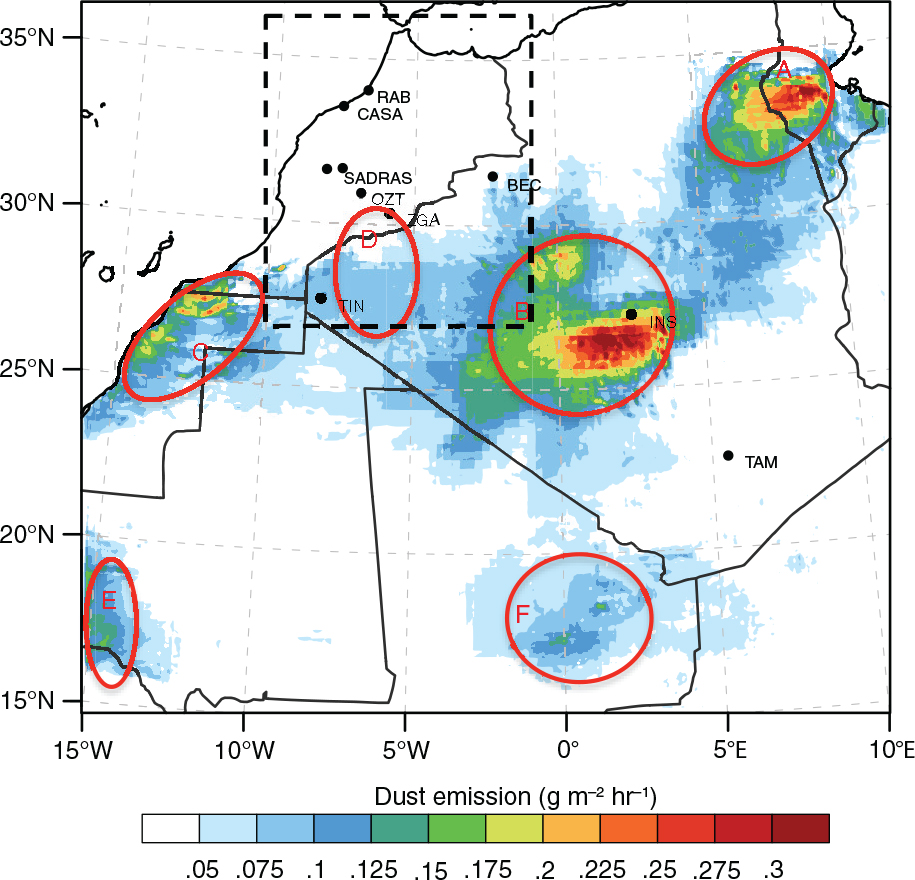
Fig. 6
Spatial distribution of time average dust emissions (shaded) in g m−2 h−1 from 22 May to 7 June 2006. The coloured circles marked as A, B, C, D, E and F show emission areas of Chotts Aljarid, Grand Erg Occidental, western Sahara, haboob activity area near Tindouf, the Senegal River basin, and the upper Niger River basin, respectively. The black dashed line box shows the small domain area.
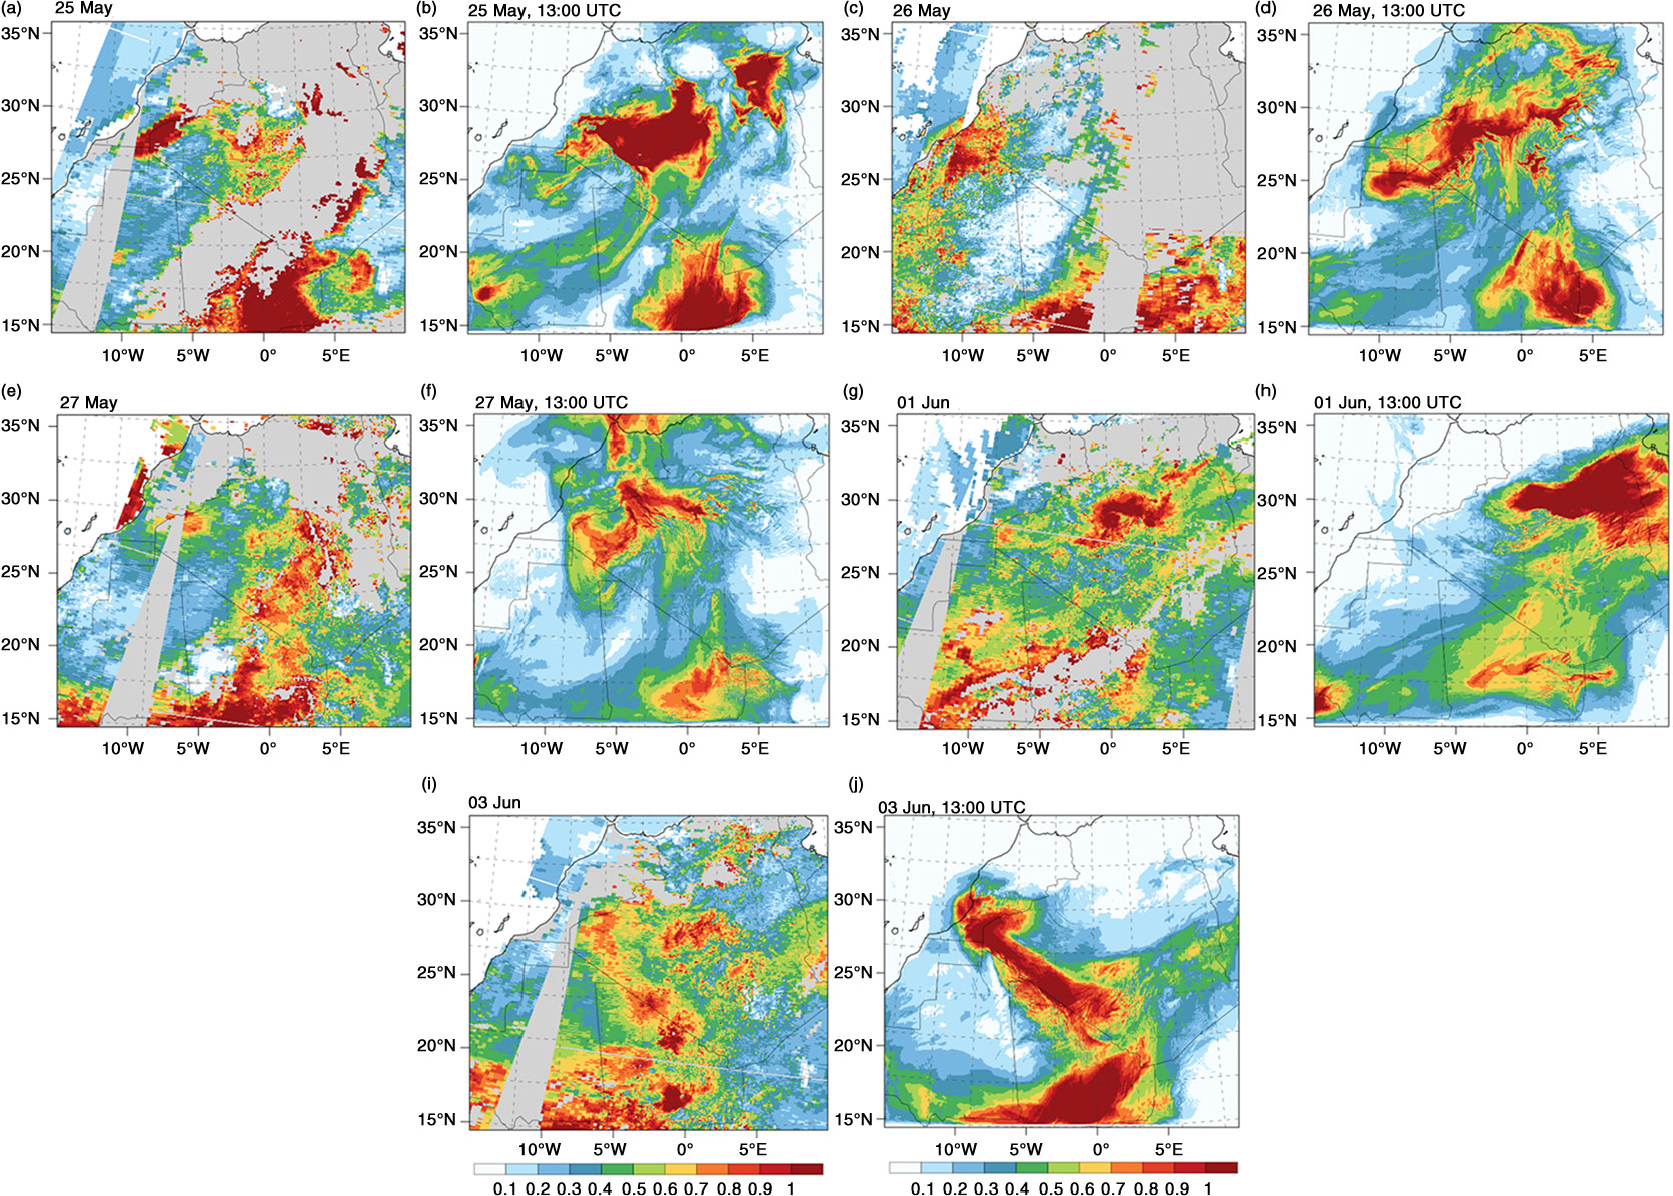
Fig. 7
Comparison of 0.55 µm AOD for the period of the SAMUM-I experiment from Terra-MODIS observations (a, c, e, g, i) and WRF-Chem (b, d, f, h, j) simulations at 0.6 µm. The MODIS plots for each date are generated by overlaying 3–5 images taken during a period from 10:00 to 13:00 UTC. The WRF-Chem AOD is shown at 13:00 UTC.
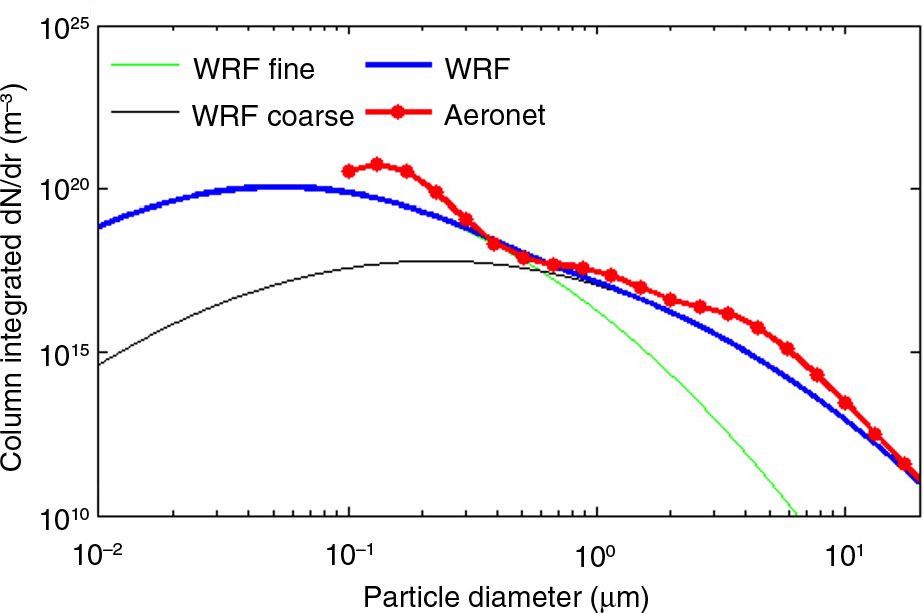
Fig. 8
Plot of column-integrated aerosol number size distributions (m−3) from the WRF-Chem simulations at 7:00 UTC (green – fine mode; black – coarse mode; blue – total) and the AERONET Inversion Level 2.0 (red) at Ouarzazate at 7:07:41 UTC on 4 June 2006.
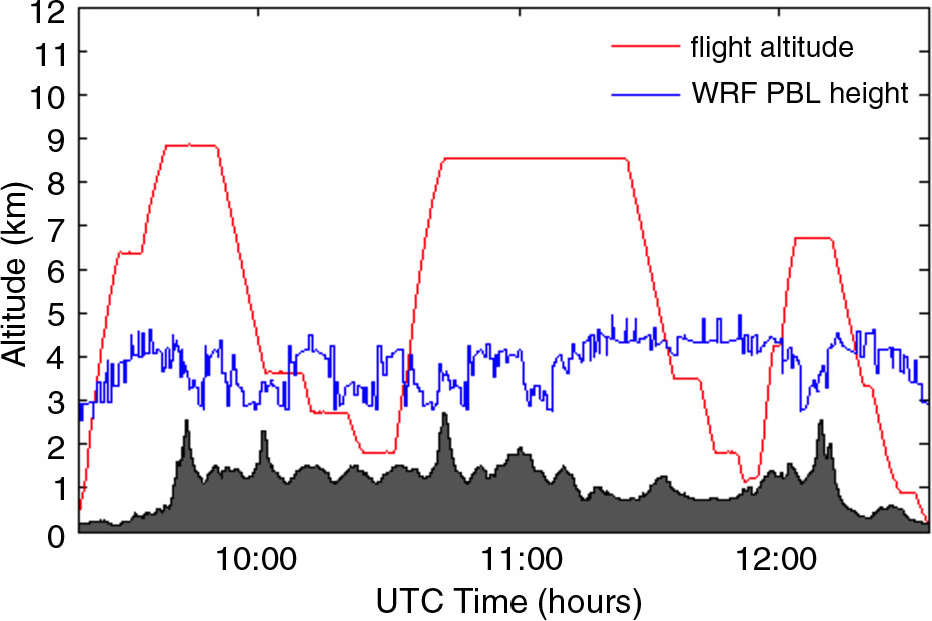
Fig. 9
Height (km) of the flight track as a function of time (solid magenta line) for SAMUM-I flight 060604a on 4 June 2006. Blue line shows the height of the PBL, which is calculated as a sum of CBL/NBL and RL. Grey shading shows the land elevation at the location of the aircraft.
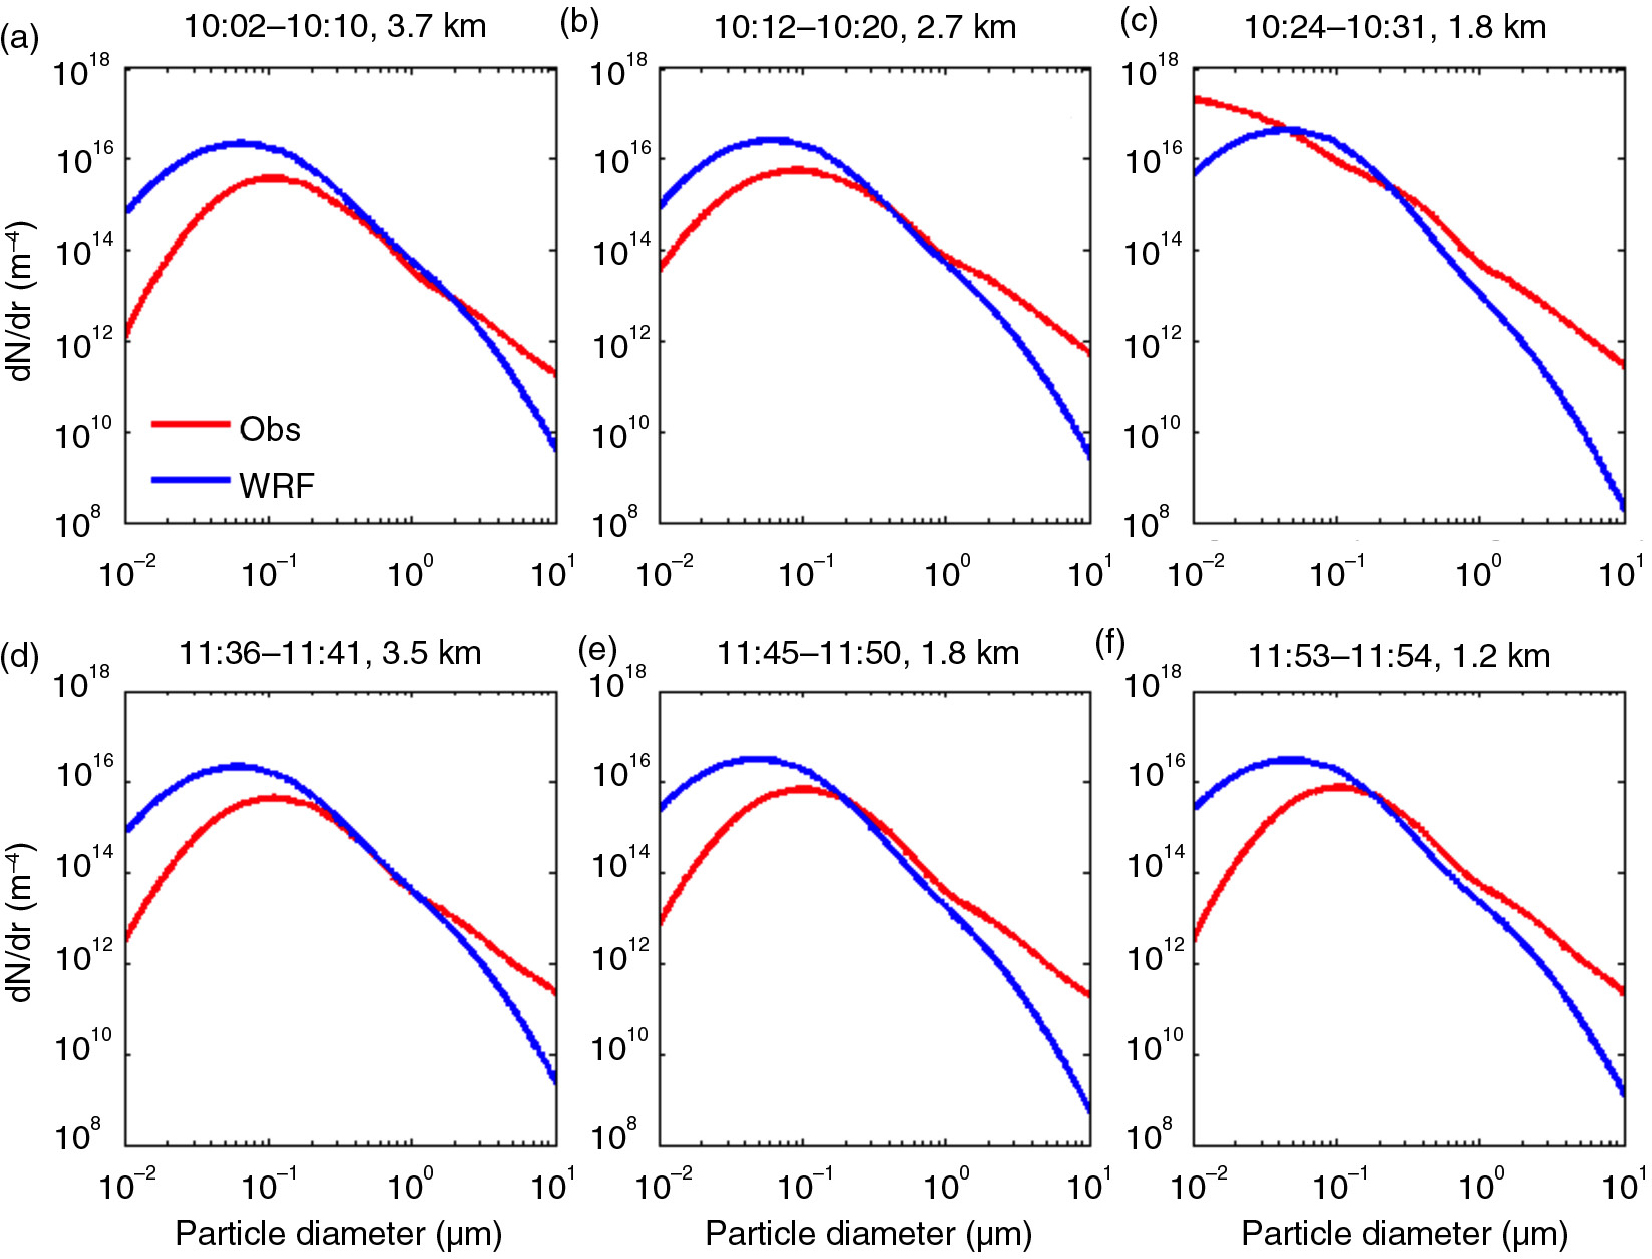
Fig. 10
Plots of the simulated (blue) and observed (red) aerosol number–size distribution (m−4) averaged in time over the constant height elements of the airplane track during research flight 060604a on 4 June 2006. The observed time intervals and the heights of the elements of the flight track are shown in the titles of each panel. The simulated size distributions are sampled at corresponding locations at 10:00 UTC (a–c) and at 11:00 UTC (d–f) on 4 June 2006.
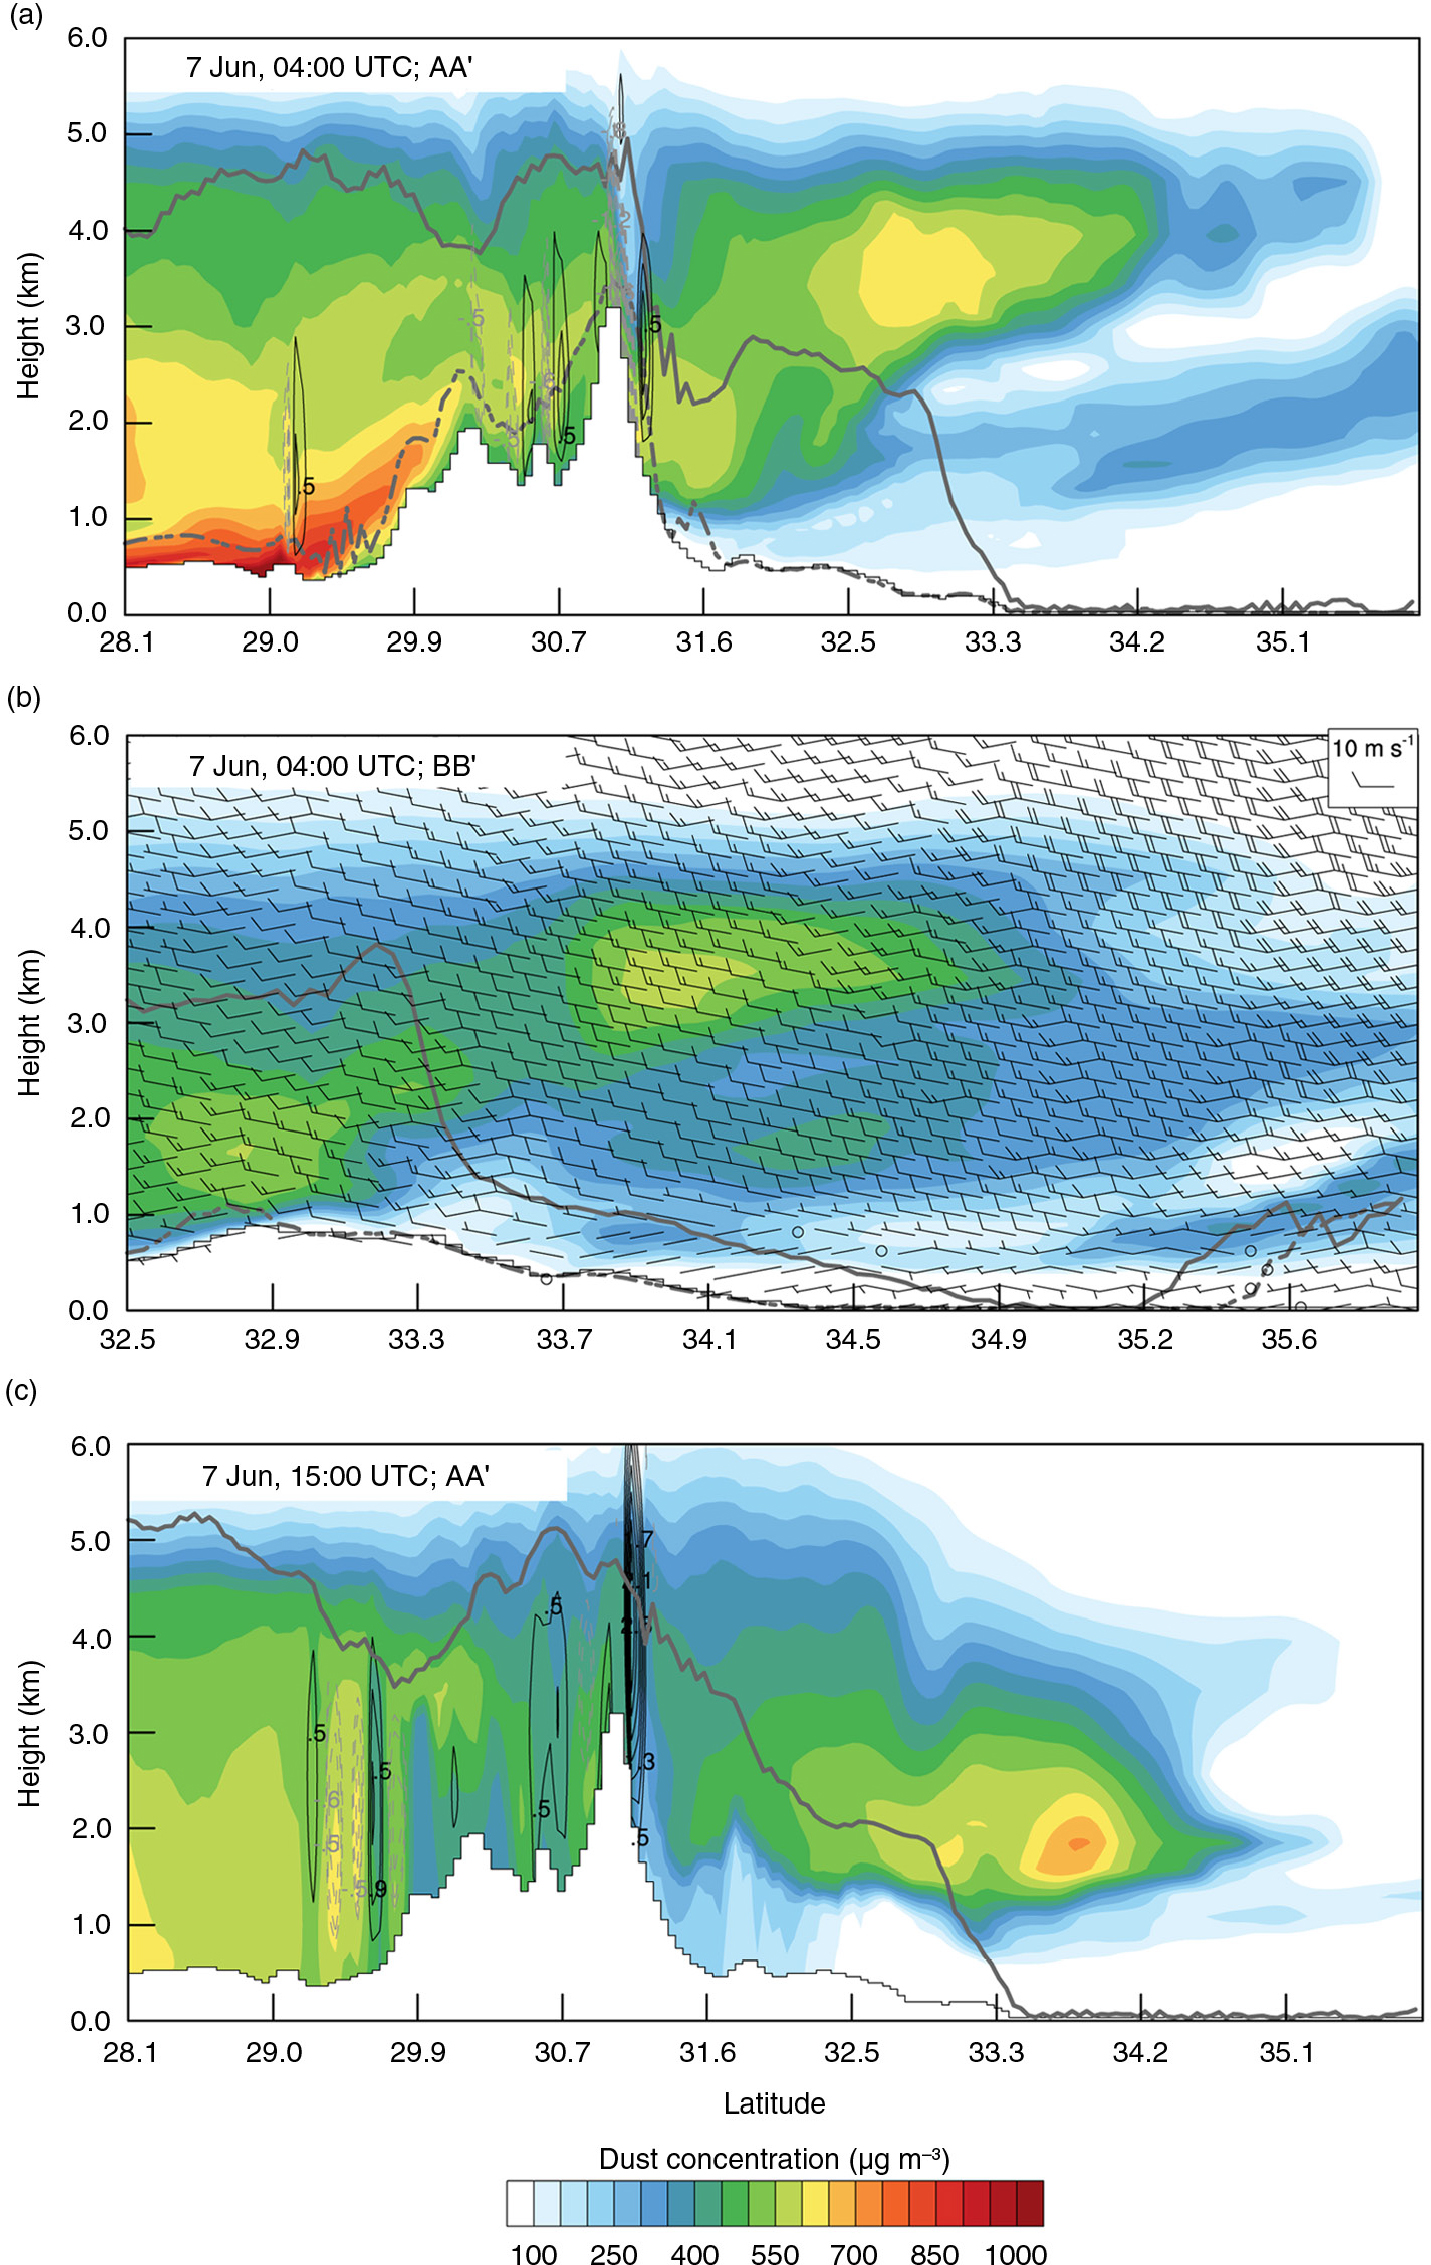
Fig. 11
(Continued)
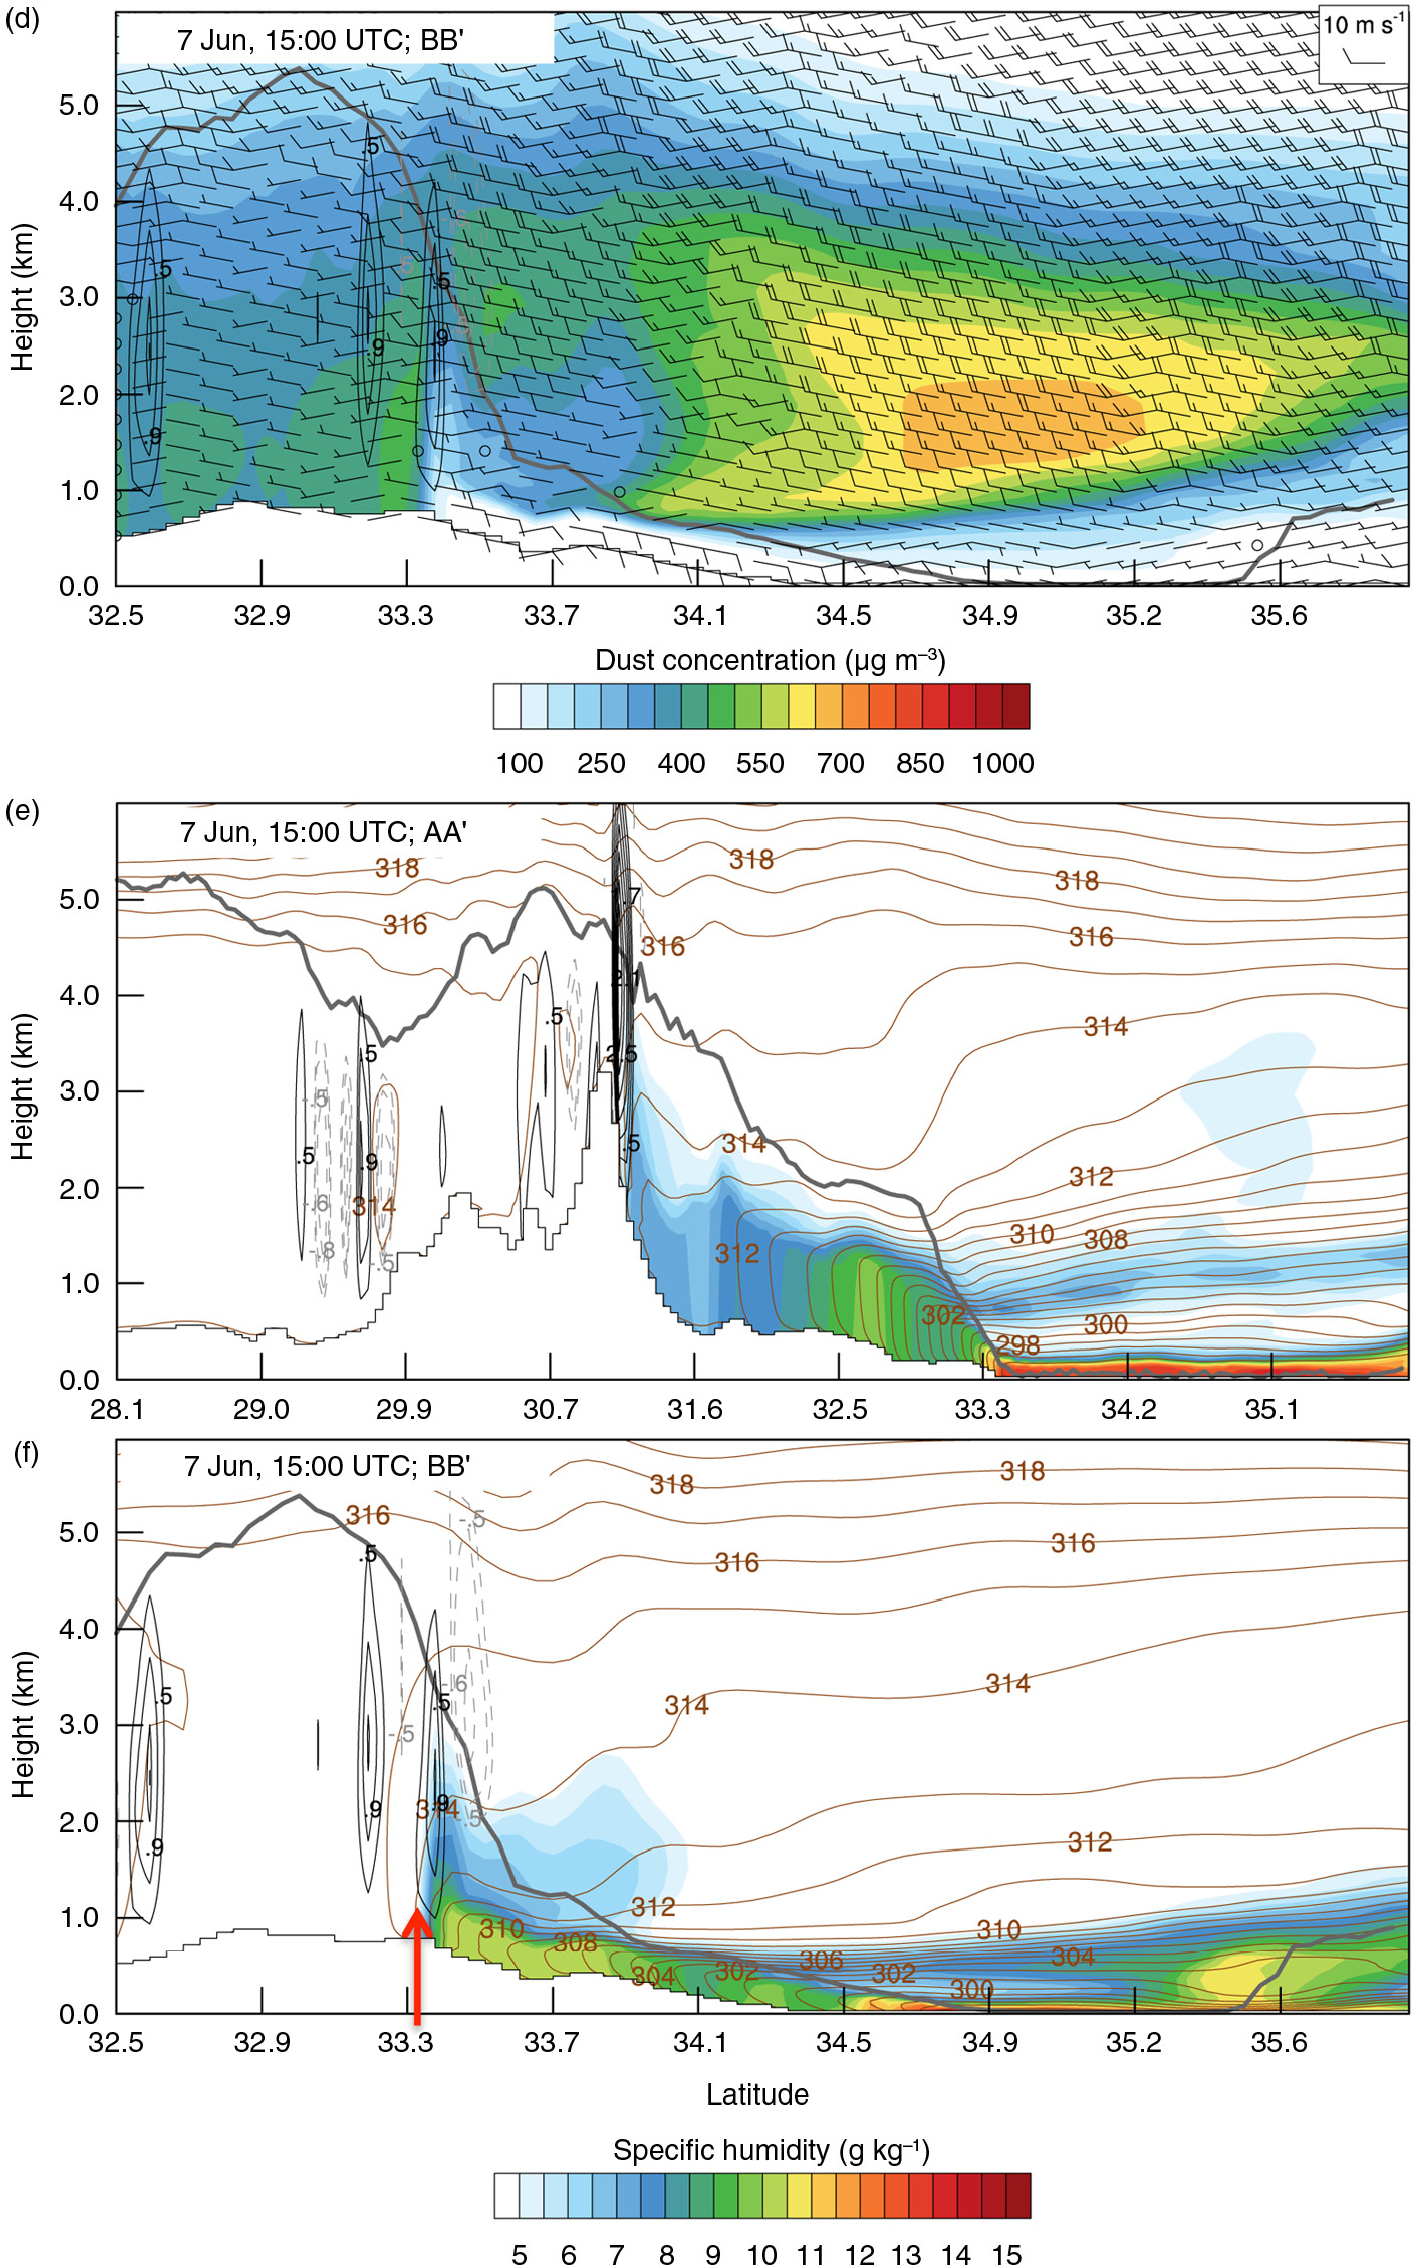
Fig. 11
(a) Dust concentration (shaded, µg m−3), height of the nocturnal boundary layer (dashed grey line, km), vertical velocity (m s−1; upward – black solid line; and downward – grey dashed line) at the AA′ meridional cross-section on 7 June 2006 at 04:00 UTC; the solid grey line shows the height of the PBL (km) at 15:00 UTC the day before 6 June that we associate with the RL height in the morning; (b) same as (a) but for BB′ cross-section and (V,W) wind barbs (m s−1); (c) same as (a) but on 7 June 2006 at 15:00 UTC and the PBL height is shown for 7 June 2006 at 15:00 UTC; (d) same as (b) but on 7 June 2006 at 15:00 UTC and the PBL height is shown for 7 June 2006 at 15:00 UTC; (e) specific humidity (g kg−1) and potential temperature (K, contour lines) in the AA′ cross-section on 7 June 2006; (f) same as (e) but for the BB′ cross-section.
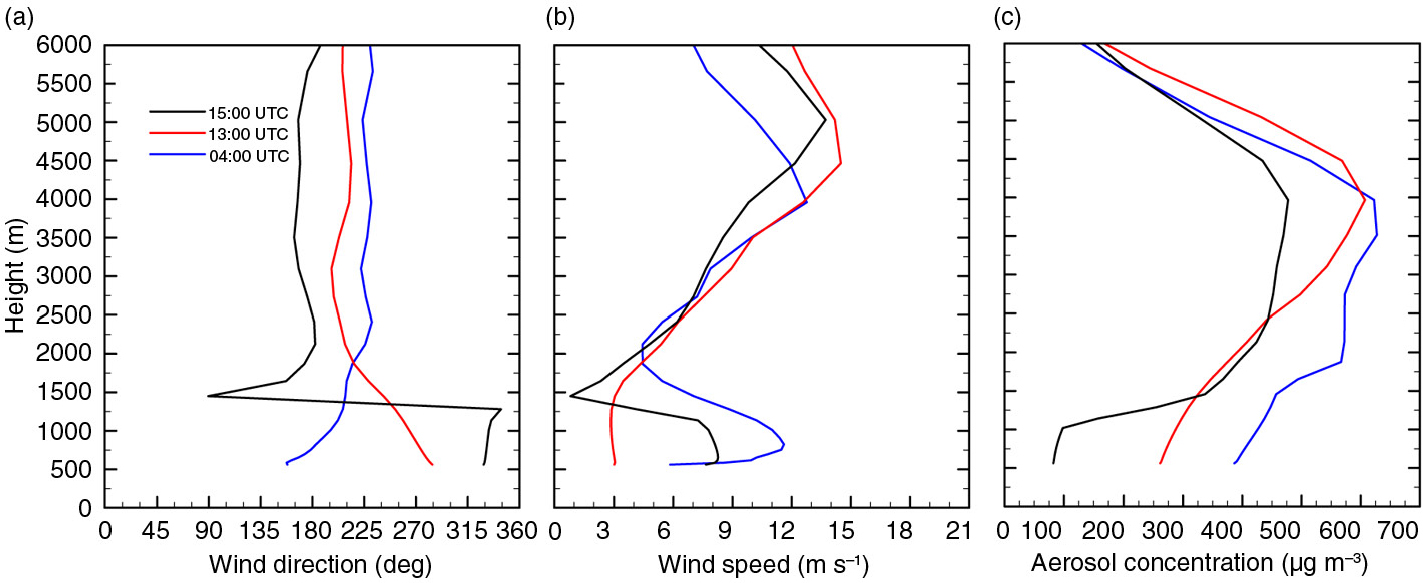
Fig. 12
Vertical profiles of (a) wind direction (degrees), (b) wind speed (m s−1), (c) aerosol concentration (µg m−3) on 7 June 2006 at 04:00, 13:00 and 15:00 UTC in the location of 6.3°W, 33.35°N as indicated by the red arrow in Fig. 11f.
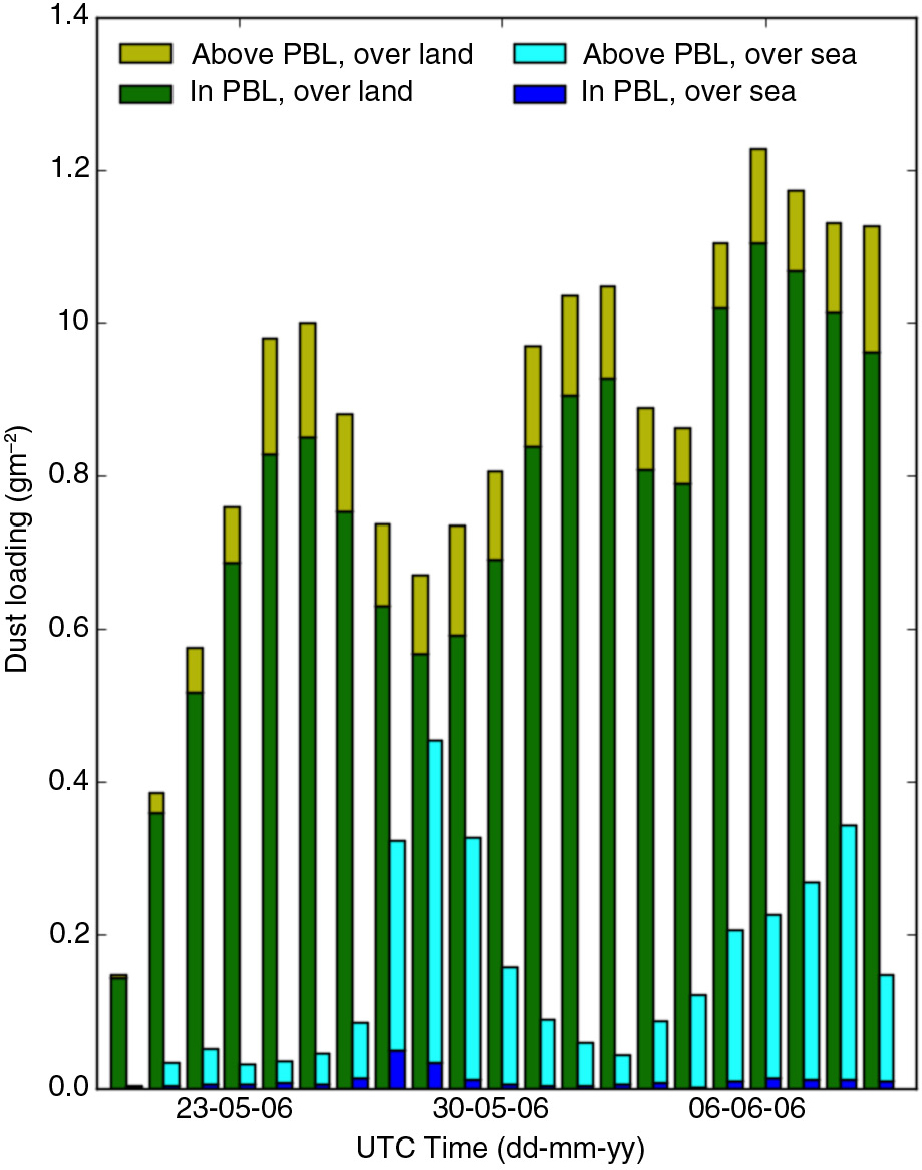
Fig. 13
Bar chart of the domain average daily mean dust loadings (g m−2) in the free troposphere and in the PBL over land (dark and light green) and over the ocean (dark and light blue) as functions of time.