
1. Introduction
The isotopic compositions of water (ice, liquid water and water vapour) provide insights into the global hydrological cycle as well as reconstruction of paleoclimate (Gat, 1996; Thompson et al., 1998; Werner and Heimann, 2002; Webster and Heymsfield, 2003; LeGrande et al., 2006; Cobb et al., 2007; Feng et al., 2007; Fricke et al., 2010). For example, the spatial and temporal variations of δD and/or δ18O in precipitation from the Global Network of Isotopes in Precipitation (GNIP) have been intensively used, and in many cases, the isotopic data are interpreted in the context of atmospheric circulation patterns (Rozanski et al., 1993; Araguás-Araguás et al., 2000; IAEA/WMO, 2006). In addition, these data have been used for evaluations of isotope-enabled general circulation models (Iso-GCMs), which have been used to help reconstruct past climate variations and environmental changes (Lee et al., 2007; Yoshimura et al., 2008; Feng et al., 2009; Tindall et al., 2009). These precipitation isotope data are, however, the end products of a large number of atmospheric hydrological processes, such as evaporation, condensation and mixing, making unique interpretation of these data challenging (Gat, 1996; Lawrence et al., 2004; Brown et al., 2008; Feng et al., 2009). Observations and modelling of the isotopic compositions of water vapour, however, provide information on the mechanisms of the atmospheric movement of water vapour and the subsequent phase changes in the atmosphere (Worden et al., 2007; Frankenberg et al., 2009; Wen et al., 2010; Yoshimura et al., 2011; Risi et al., 2012).
The El Niño and Southern Oscillation (ENSO) is characterised by anomalous warming in the Eastern equatorial Pacific Ocean and is the primary cause of inter-annual variability in the tropical rainfall and humidity (Cane, 2005; Logan et al., 2008; Morishita and Heki, 2008). On the contrary, a unique east–west dipole mode in the sea surface temperature (SST) anomalies of the tropical Indian Ocean is also significantly correlated with the rainfall and humidity variations over the two dipoles, which is known as Indian Ocean Dipole (IOD), named by Saji et al. (1999). The ENSO, IOD and interplay of the ENSO and IOD have an impact on regional hydrological cycle and chemistry, in particular, over East Africa and Indonesia by enhancing or suppressing atmospheric convection (Behera et al., 2005; Abram et al., 2008). In the tropics, the influence of convective activity on the isotopic composition of precipitation and water vapour is important because much of the precipitation is related to the atmospheric convective processes (Lawrence et al., 2004; Bony et al., 2008; Risi et al., 2008a; Lee et al., 2009).
Stable isotopic variations recorded in paleoclimatic proxies are often interpreted in terms of climate variations, such as the amount effect after Dansgaard (1964), an anti-correlation between precipitation amount and the isotopic composition of precipitation in the tropics. This empirical relationship is the fundamental base for climate studies using ice cores, tree rings, continental carbonates precipitates and corals (Posmentier et al., 2004). Recent studies explained the amount effect by the re-evaporation of the falling rain and the diffusive exchanges with the surrounding vapour and the injection of vapour from the unsaturated downdraft into the subcloud layer (Bony et al., 2008; Lee and Fung, 2008; Risi et al., 2008b; Risi et al., 2012). However, the evaluations of such model calculations are hindered by a lack of isotopic data in the tropics.
To better enable the interpretation of the hydrometeorological processes from paleoclimatic observations and/or modelling studies over the tropics, the meteorological processes that may control the isotopic composition of water vapour or precipitation should be established (Brown et al., 2008). We initiated this work to increase our understanding of stable isotopic variations as a result of changing the atmospheric hydrological cycle, which can be directly or indirectly connected to the interpretation of mechanisms of paleoclimate variations. Thus, the objective of this study is to examine how the large-scale circulation modifies water vapour and its isotopic composition (δD) in the lower troposphere through changes in convective activity in two consecutive years (2005 and 2006) as seen by the tropospheric emission spectrometer (TES) during the El Niño and a positive IOD in late 2006, in contrast to 2005, which was a neutral year with respect to ENSO and negative IOD (Cai et al., 2009). The TES observations are in a unique position to measure global variations of the isotopic signals at lower troposphere caused by the large-scale circulations (Worden et al., 2007).
2. Data
2.1. Tropospheric Emission Spectrometer
As discussed in Beer et al. (2001) and Worden et al. (2004), the TES on the EOS-Aura platform is a nadir-viewing infrared Fourier transform spectrometer that covers a spectral range between 650 cm−1 and 3050 cm−1. The footprint of each nadir observation is approximately 5.3 km×8.4 km. In the nadir view, TES data are sensitive to the abundant tropospheric gas species including H2O, HDO, CO and O3.
Global surveys are the primary observations that TES conducts and made on approximately a ‘one day on, one day off (standard products)’ cycle. An entire survey requires 16 orbits (around 26 h), and the TES is rested to avoid mechanical wear and tear and to extend the life of the instrument if no ‘Special (or Research) Observations’ are needed. The ‘off’ periods are available for the special observations, including all other measurements for validations, volcano eruptions and biomass burning. Both standard products and special observations are used in this study. The analysis presented here uses TES version 003 data (R10, http://tes.jpl.nasa.gov).
2.2. Isotopic composition of water vapour (δD) by TES
For the analysis shown here, we selected TES HDO/H2O observations in which the retrieval degrees of freedom of the HDO component of the profile retrieval is>0.5 (Worden et al., 2006). This criterion ensures that the estimate of profile of HDO/H2O ratio is sufficiently sensitive to the true distribution of HDO/H2O and that there is significant error reduction in the estimate of the HDO/H2O ratio relative to the assumed a priori uncertainty (Worden et al., 2004, 2006; Brown et al., 2008; Lee et al., 2011, 2013). Worden et al. (2006) calculated the error, including the smoothing error, measurement error and uncertainties in the prior estimate of surface and atmospheric temperature, at approximately 1% in the tropics (up to 8‰). The performance of the TES retrievals for cloud optical properties, such as effective cloud optical depth, is well discussed by Kulawik et al. (2006) and Eldering et al. (2008) in detail.
The estimated HDO is mostly sensitive to emission between 850 hPa and 500 Pa (Worden et al., 2006). As such, we restrict our analysis to lower troposphere mean values. TES data used in this work come from October 2005 to December 2006 over tropics, and two data sets (2005 and 2006) are generated, representing October to December of each year. The retrieved HDO/H2O ratios were expressed in the δ notation as a part of thousand difference relative to Vienna Standard Mean Ocean Water (VSMOW) following the definition
where HDO and H2O are proportional to the number of molecules of each species. The ratio ((HDO/H2O)VSMOW) is 311.52×10⁻⁶ by volume. There is a bias in the HDO/H2O ratio of approximately 6% (Worden et al., 2006, 2011), assumed to be related to the spectroscopic line strengths of HDO or both HDO and H2O combined. This bias needs be corrected to better compare the TES isotope data to the moisture process models shown in this work. Lee et al. (2011) discussed sensitivities of measurements with different cloud types, and Worden et al. (2011) discussed validation of TES isotope data in detail.
2.3. ENSO and IOD
There was a moderate El Niño in late 2006 (Logan et al., 2008; Chandra et al., 2009). SST anomalies in the Niño 3.4 region were −0.1°C, −0.4°C and −0.8°C (2005), neutral) and 0.9°C, 1.2°C and 1.1°C (2006, warm) for the last 3 months of each year (October, November and December) (www.cpc.noaa.gov/products/analysismonitoring/ensostuff/ensoyears.shtml). Logan et al. (2008) reported strong anomalies in TES CO, O3 and water vapour amount during October and November of 2006, compared to that in 2005. Anomalies in the SST gradient between the Western equatorial Indian Ocean (WIO, 40°–60°E and 10°S–10°N) and the Eastern equatorial Indian Ocean (EIO, 90°–110°E, −10°–10°N) derived from the HadlSST dataset were −1.3°C, −1.2°C and −1.1°C (2005, negative, nIOD) and 1.6°C, 1.6°C and 1.3°C (2006, positive, pIOD) for the last 3 months of each year (http://www.jamstec.go.jp/frsgc/research/d1/iod).
A nIOD signal appeared in the winter of 2005, together with a neutral ENSO condition in the Pacific, with severe drought over Eastern Africa. In addition, a pIOD signal appeared in the winter of 2006, together with an El Niño condition in the Western Pacific, with drought in the regions around the EIO, including Indonesia, and with an increase of precipitation in the regions around WIO, South India, and East Africa (Abram et al., 2008). Nassar et al. (2009) reported that ENSO's impact on Indonesian precipitation is larger than that of the pIOD. In this study, we relate the isotopic composition of water vapour to the atmospheric hydrological cycle over the WIO (40°–60°E and 15°S–15°N) and the EIO (90°–135°E, 15°S–15°N).
3. Results
3.1. Movement of convective centres
The maps in Fig. 1 show how the changes in the phases of ENSO and IOD affect precipitation amount over the WIO and EIO for October, November and December of 2005 (top), 2006 (middle) and differences between 2005 and 2006 (Bottom), described by the Global Precipitation Climatology Project (GPCP) (Adler et al., 2003). The monthly precipitation maps show a very strong maximum (22.3 cm, mean value of the 3 months) over Indonesia in late 2005 owing to the interplay between ENSO and IOD. In late 2006, however, the maps illustrate the dramatic changes in monthly precipitation amount due to the coincidence of ENSO and the positive IOD over the EIO (22.3 cm and 12.7 cm for 2005 and 2006, respectively) and WIO (4.3 cm and 12.5 cm for 2005 and 2006, respectively).
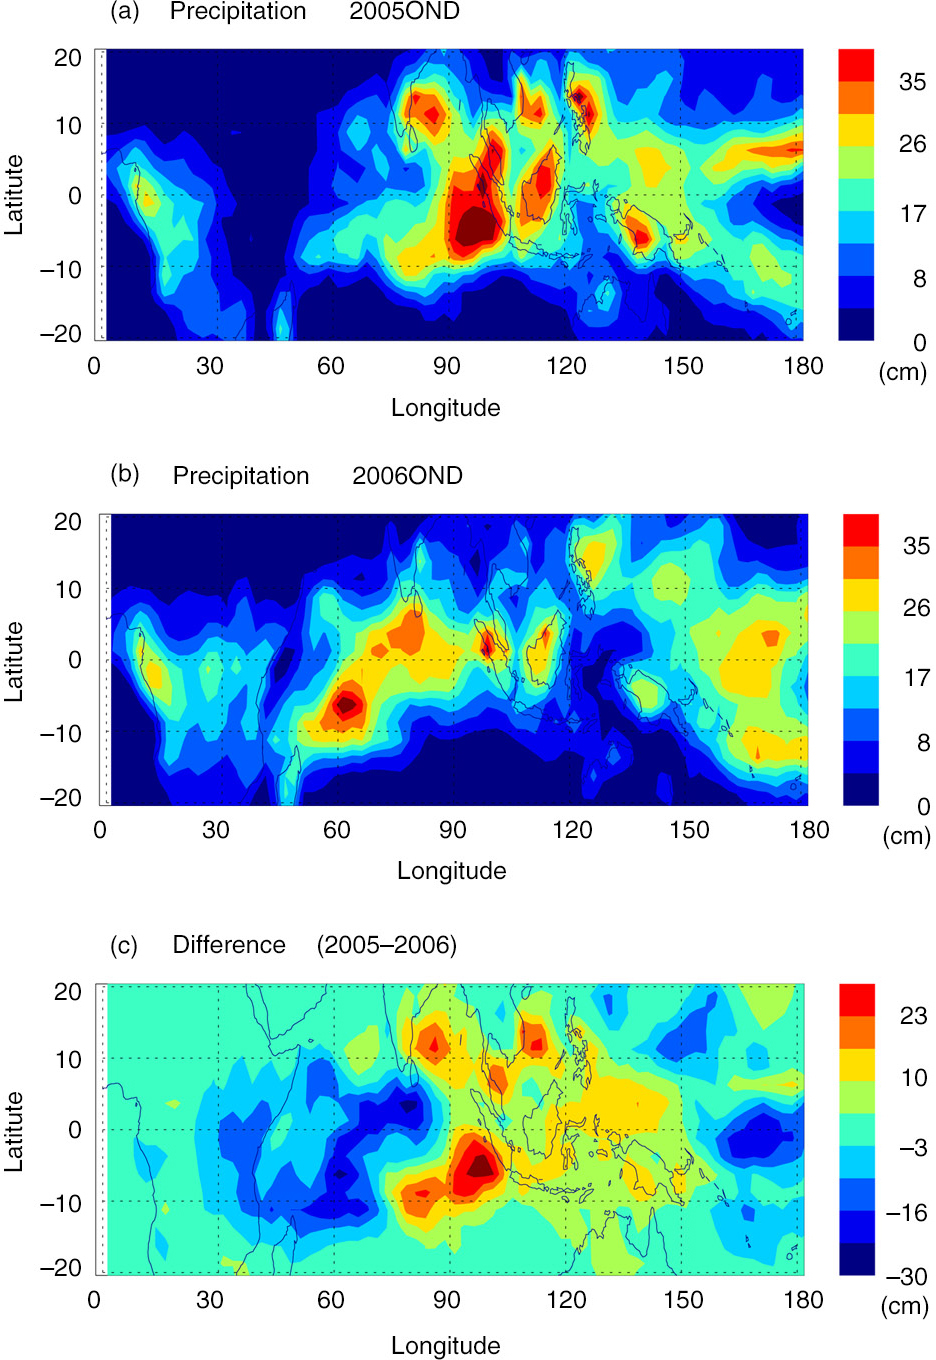
Fig. 1
Maps of means of precipitation amounts from GPCP from October, November and December for 2005 (a), 2006 (b) and difference (2005–2006, c), respectively. Results are shown as monthly means binned on a grid of 2.5°×2.5°.
Figure 2 shows a proxy of convective activity, the values of the National Oceanic and Atmospheric Administration (NOAA) spatially and temporally interpolated outgoing longwave radiation (OLR) at the top of the atmosphere (http://www.cdc.noaa.gov), which is often used to distinguish between the areas of tropical convective activity (Liebmann and Smith, 1996; Logan et al., 2008). Results are shown as monthly means binned on a grid of 2.5°×2.5°. This is closely linked to the regional hydrological processes because precipitation is related to convective processes.
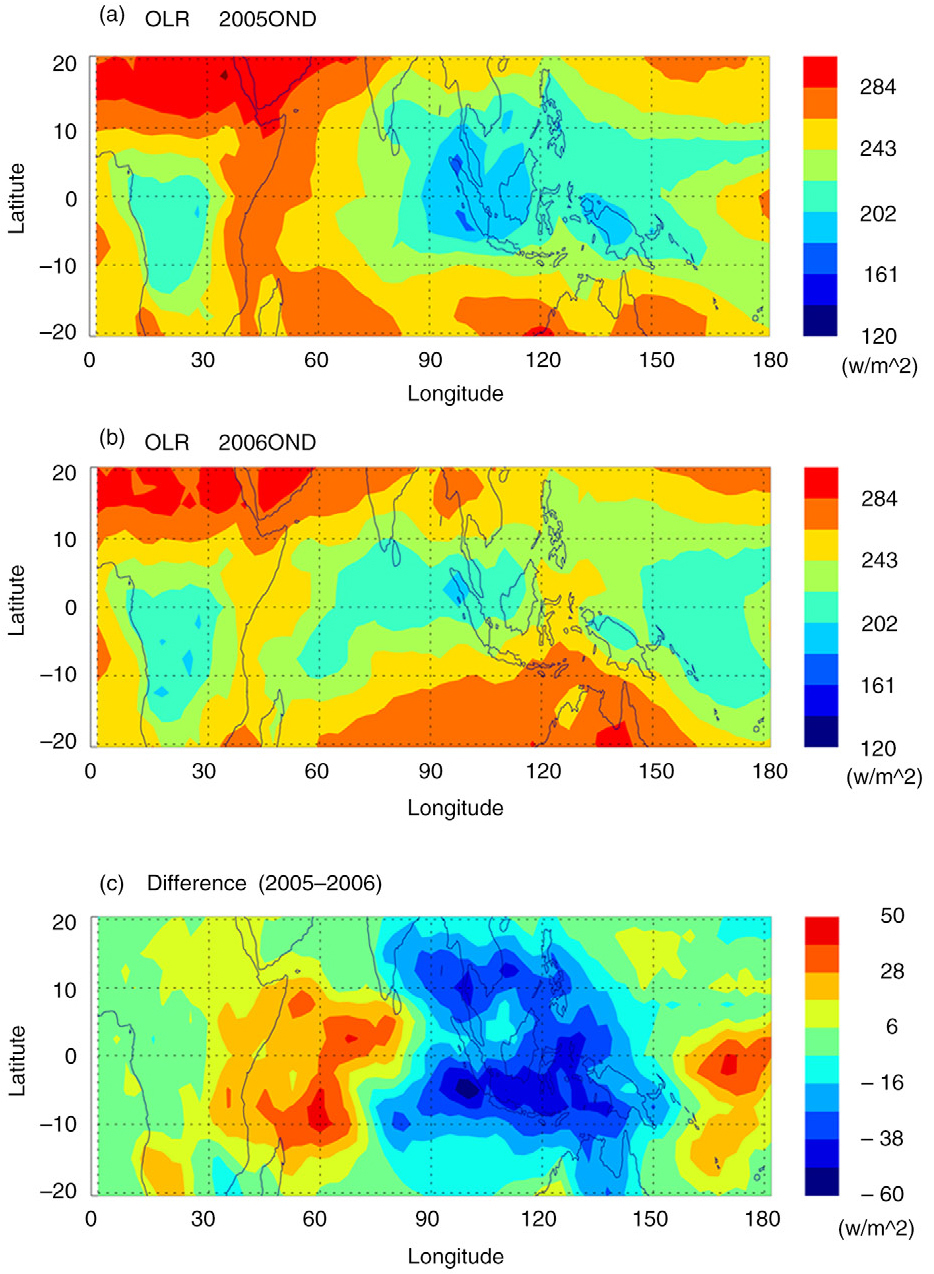
Fig. 2
Maps of outgoing longwave radiation (OLR) values from NCEP/NCAR reanalysis from October to December for 2005 (a), 2006 (b) and difference (2005–2006, c), respectively. Results are shown as monthly means binned on a grid of 2.5°×2.5°.
Since the level of OLR is related to the amount of cloudiness, low monthly mean OLR values (<180 W·m−2) associated with deep atmospheric convection were found over the EIO during 2005. Relatively high monthly mean OLR values (271, 274 and 269 W·m−2 for Oct, Nov and Dec, respectively) are observed over a region of the WIO during 2005, which is related to the severe drought over Eastern Africa. By contrast, the frequency or strength of deep convective activity over the EIO decreased remarkably, causing repeated drought and biomass burning over Indonesia, presumably by the interplay of El Niño and pIOD during 2006 (mean values of 3 months, 217 and 245 W·m−2 for 2005 and 2006, respectively), which has only occurred four times in the past 50 yr (Nassar et al., 2009), while concurrently convective activity increased over the WIO due to the pIOD (271 and 250 W·m−2 for 2005 and 2006, respectively).
To investigate further variability in convective activity, we use data from NCEP/NCAR reanalysis to distinguish areas of convective activity (Kalnay et al., 1996). Vertical velocities (ω) at the 500-hPa level are extracted from the database. The magnitude of the longitudinal vertical velocities in the winter of both 2005 and 2006 are compared in Fig. 3. Results are shown as longitudinal mean values of the 3 months of each year binned on a grid of 2.5°×2.5° (15°S–15°N). We assumed that the longitudinal variations of vertical velocity are an indicator of surface convergence and divergences (Feng et al., 2009). The unit of ω is given in Pa/s, with positive values indicating subsiding air and negative one rising air.
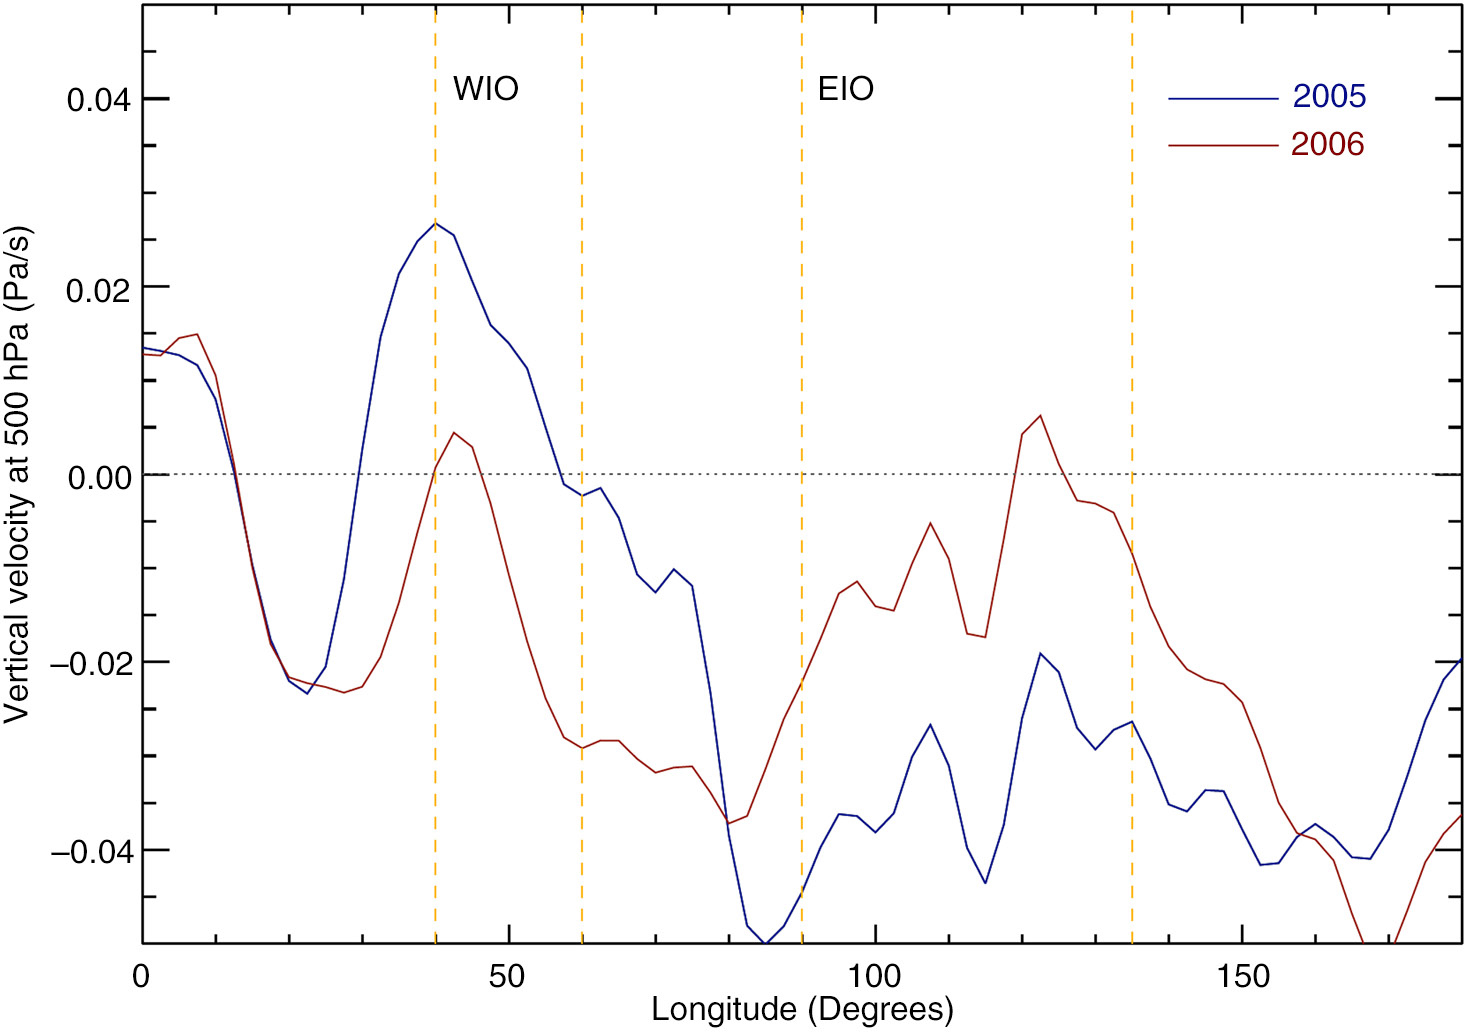
Fig. 3
Longitudinal distributions of vertical velocity for 2005 (blue solid) and 2006 (red solid), with positive values indicating subsiding air and negative one rising air. The values (unit, Pa/s) are averaged between October and December of each year. The selected latitudes are between 15°S and 15°N. The orange dotted lines represent selected regions for this study.
As shown in Fig. 3, the EIO (15°S–15°N, 90°–135°E) is characterised by strong upward velocity (minimum value of −0.045 Pa/s, red line) and is known as a region of enhancement of deep convective activity, whereas subsidence regions are seen over the whole WIO (15°S–15°N, 40°–60°E) during 2005 (maximum value of 0.027 Pa/s, red line). During 2006, however, the EIO is characterised by weaker upward velocity (minimum value of −0.022 Pa/s, blue line), which indicates weaker or less frequent deep convective activity. A pIOD is expected to influence the WIO through intensifying the enhancement of convective activity during 2006, which is related to East African short rains (Behera et al., 2005).
We use the cloud ice water content (IWC) from Aura Microwave Limb Sounder (MLS, http://mls.jpl.nasa.gov, Version 2.2×) to confirm the location and timing of deep convection (Li et al., 2005; Su et al., 2006; Wu et al., 2008). Figure 4 shows the MLS IWC at 215 hPa as monthly means binned on a grid of 2.5°×2.5°. The spatial variations of MLS IWC over the WIO and EIO resemble those of OLR. Relatively high IWC values (12 mg/m3) are coincident with low OLR values (180 W/m2), indicative of deep convection over the EIO in 2005 (Su et al., 2006). In 2006, the cloud IWC decreased to 5.4 mg/m3 due to the ENSO and IOD over the EIO compared to that of 2005 (8.3 mg/m3). The 2006 IWC value over the WIO increased up to 3.7 mg/m3 due to the pIOD compared to that of 2005 (0.9 mg/m3), which is related to the increased precipitation amount (see Fig. 1).
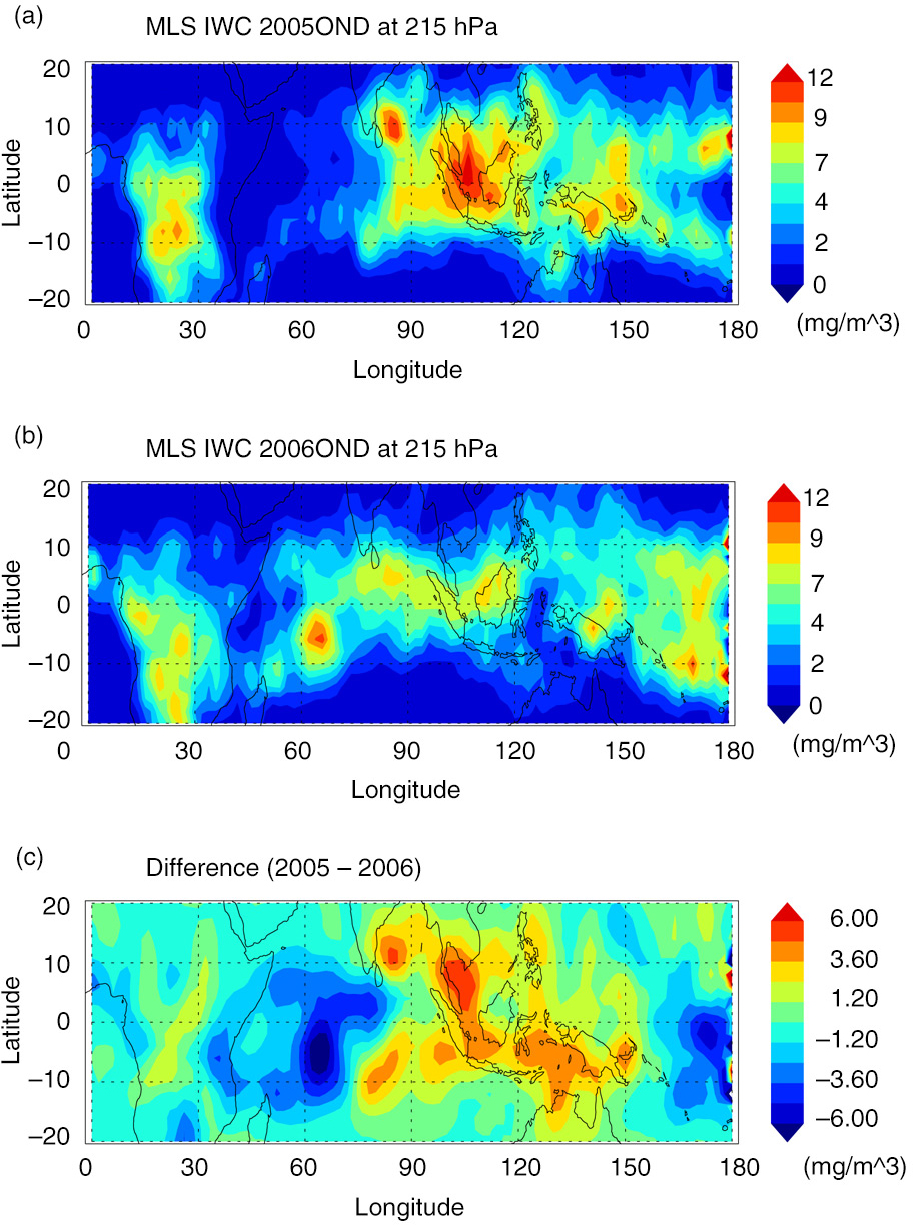
Fig. 4
The MLS cloud IWC from October to December for 2005 (top), 2006 (middle) and difference between 2005 and 2006 (bottom); IWC is expressed as mg/m3.
3.2. Water vapour and its isotope in the lower troposphere
We next present the water vapour (g/kg) and its isotope (δD) from October to December in 2005 and 2006, respectively (Figs. 5 and 6). As a result of reduced convective activity, the amount of water vapour over Indonesia (EIO) from October to December in 2006 is apparently less than that of 2005 (Fig. 5). We ascribe the relatively decreased water vapour in 2006 over the EIO to either weaker or less frequent deep convective activity (the interplay of El Niño conditions and pIOD) and to both eastward and westward movements of convective activity during this period (Figs. 2, 3 and 4 Fig. 3 ). In contrast, the 2006 water vapour in the lower troposphere over the WIO is increased relative to 2005 due to the enhanced convective activity associated with the pIOD.
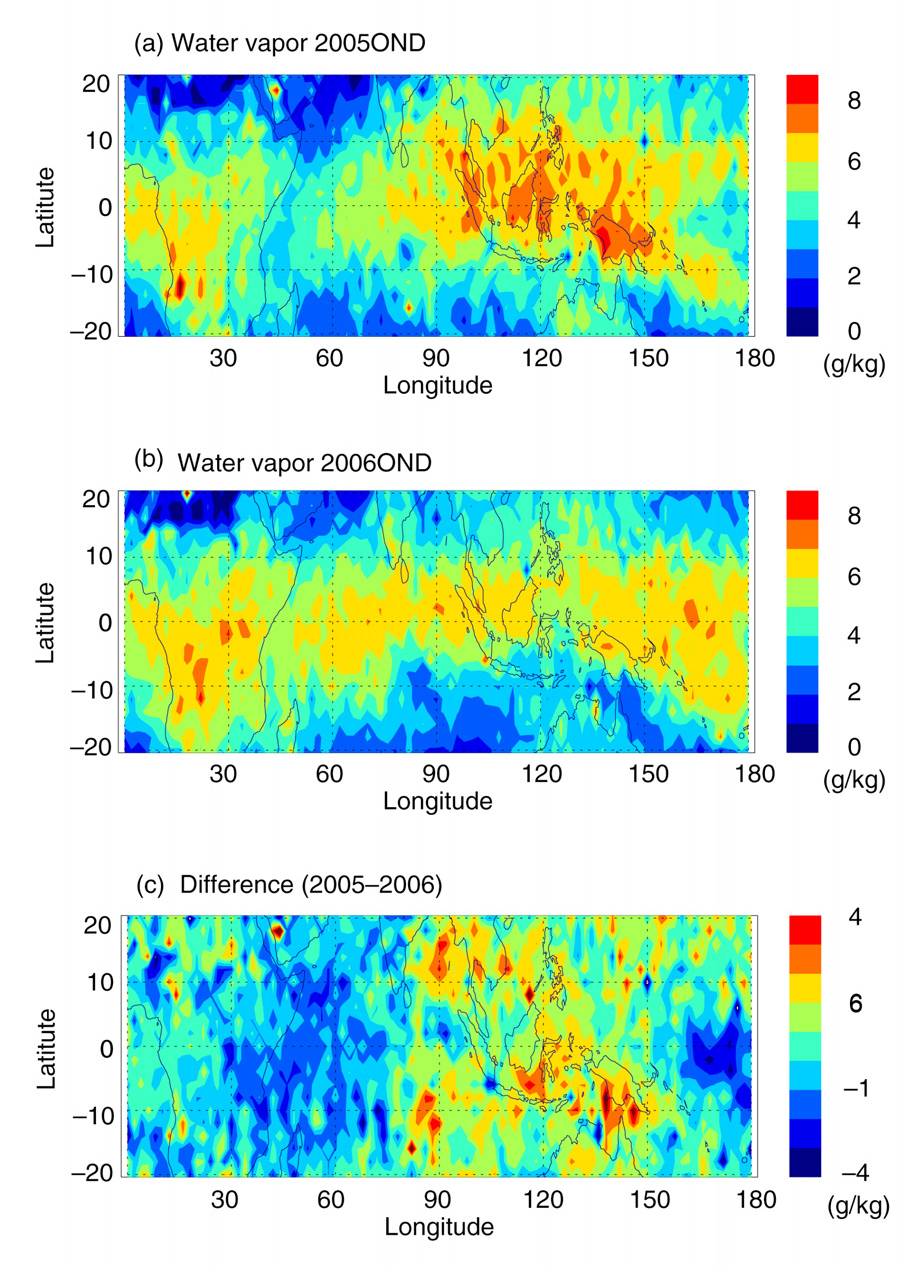
Fig. 5
Water vapour amount from October to December for 2005 (top), 2006 (middle) and difference between 2005 and 2006 (bottom). H2O is expressed as mass mixing ratio.
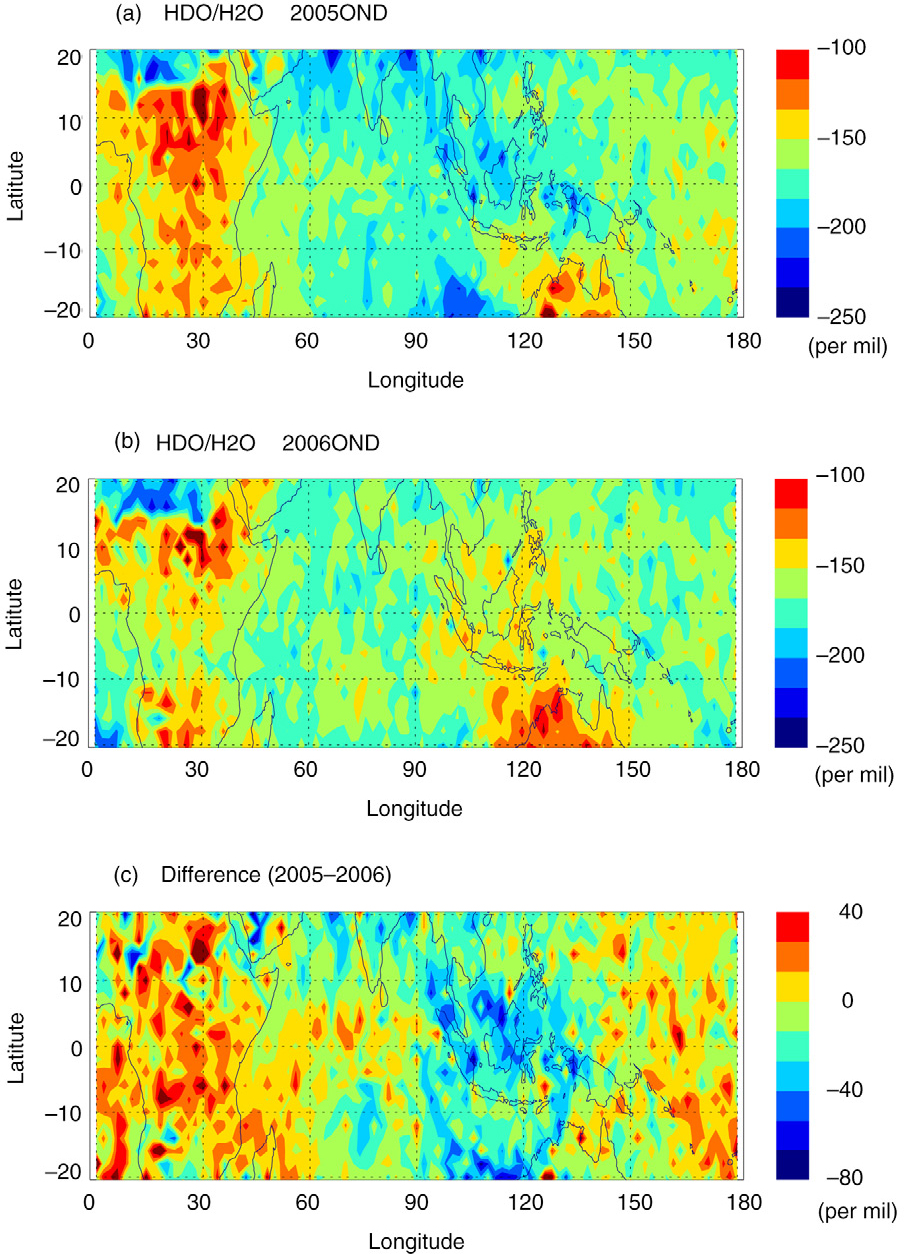
Fig. 6
Water vapour isotope from October to December for 2005 (top), 2006 (middle) and difference between 2005 and 2006 (bottom).
Isotopic composition of water vapour in the lower troposphere (850–500 hPa) over the EIO and WIO is closely related to the ENSO and/or IOD variations (Fig. 6). Over the EIO, the isotopic composition of water vapour abruptly changes and the variations of isotopic composition coincide with changes in convective activity and precipitation (Figs. 2 3 4 and 6). When the deep convection is stronger over EIO due to the nIOD and neutral ENSO conditions during 2005, the isotopic composition of water vapour is more depleted than that of 2006 (Fig. 6b). However, compared to 2005, the isotopic composition of water vapour over WIO does not show significant changes during 2006 except possibly over the southern sub-tropics in December 2006 (Fig. 6c) associated with the southern shift in convection and precipitation for that month.
4. Discussion
4.1. Relationship between convective activity and water vapour isotope
Figure 7 compares the probability density distributions (PDFs) for water vapour and its isotopic composition. The changes in water vapour amount and its isotopic composition in the PDFs are due to the enhanced (or reduced) convective activity caused by the ENSO, IOD and the interplay between them. This analysis shows a number of characteristics. First, there is a dramatic change between water vapour amount and its isotopic composition over the EIO in an opposite way (6.5 g/kg,–172‰ during 2005 and 5.5 g/kg,–153‰ during 2006).
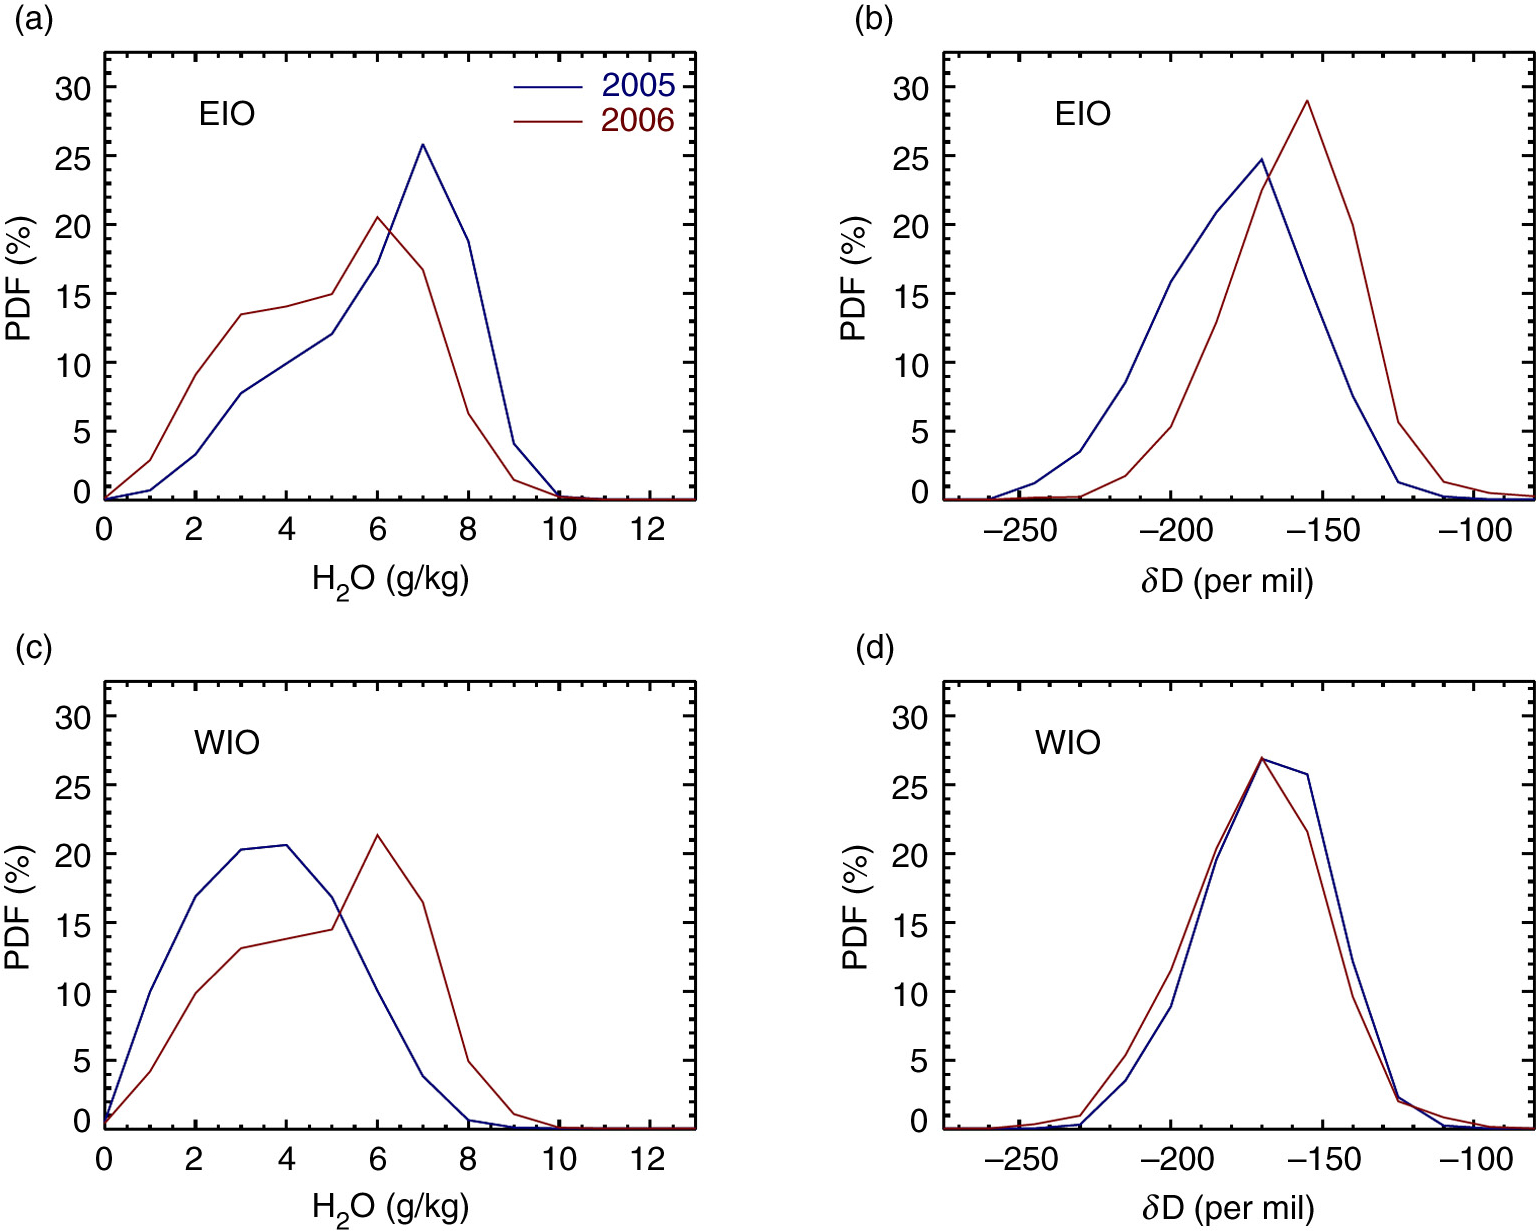
Fig. 7
Probability density distributions for water vapour and its isotope by TES during October to November. (a) and (b) East Indian Ocean (15°S–15°N, 90°–135°E, EIO), and (c) and (d) West Indian Ocean (15°S–15°N, 40°–60°E, WIO). Blue lines represent 2005 and red lines represent 2006.
Second, owing to increased convective activity during 2006 compared to that in 2005, the amount of water vapour is increased (4.1–5.4 g/kg), but there is little variation in the isotopic composition of water vapour over the WIO (−161.3‰ in 2005 and −164.7‰ in 2006) compared to the changes in the isotopic composition of water vapour over the EIO (~19‰) (Fig. 7). This similar isotopic distribution implies similar moist processes between 2 yr regardless of the changes in convective activity, which suggest that shallow convection, triggering non-precipitating clouds (for example, cumulus), likely moistens the lower troposphere, but shallow cumulus convection is not associated with heavy precipitation (Stevens, 2005; Lee et al., 2011). We will discuss this in the following section in detail.
4.2. Water vapour isotopic composition affected by cloud process
TES vapour isotope (δD) from tropical observations is plotted as a function of specific humidity (g/kg) to show the history of evaporation and condensation processes and to infer the water vapour transport characteristics (Worden et al., 2007; Brown et al., 2008; Lee et al., 2011). This approach, suggested by Worden et al. (2007), considers single processes in isolation: (1) only condensation is active; and (2) only evaporation from the surface is allowed. The lower line (orange dotted) in each figure shows a model of Rayleigh distillation, or what we would expect for an air parcel originating from the local ocean at the mean local ocean temperature followed only by condensation in the lower troposphere and upper planetary boundary layer based on oceanic temperatures (Fig. 8). The top line (orange solid) shows a mixing line between evaporation from an oceanic source and transpired air (enriching effect) and depleted dry air. The initial oceanic moisture source is assumed to be vapour in equilibrium with the local ocean of average temperature observed by TES. The analytical form for these models is also described in the supplementary material of Worden et al. (2007).
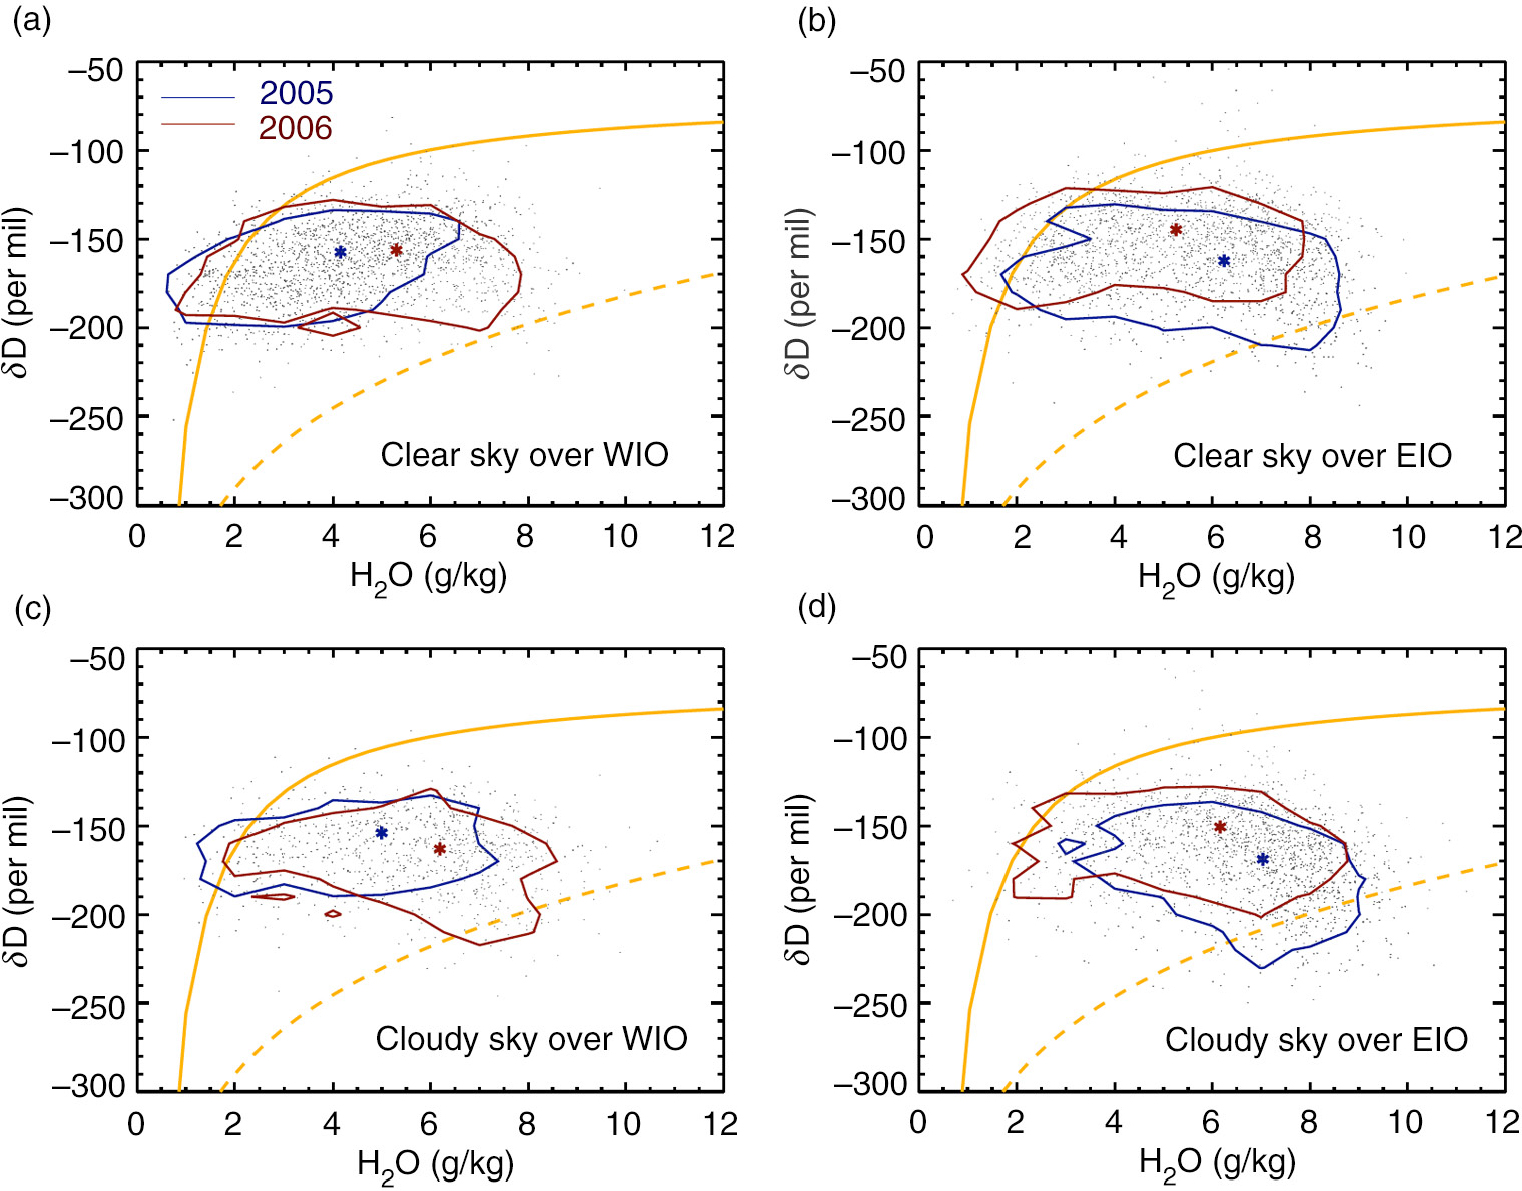
Fig. 8
Scatter plots of H2O versus δD observed by TES (contour lines envelops 95% of the observations). Observations are for clear sky (TES optical depth < 0.2) and cloudy (TES optical depth > 1.0) conditions as suggested by Worden et al. (2007). The orange solid and dotted lines show model prediction as described in the TES water vapour and water vapour isotope. (a) and (b) Clear sky over the Western Indian Ocean (WIO) and the Eastern Indian Ocean (EIO) during 2005 and 2006, respectively. (c) and (d) Cloudy conditions over the WIO and the EIO during 2005 and 2006, respectively.
Most observations, as shown in Fig. 8, lie between the theoretical curve for condensation from moisture originating over an oceanic source (orange dotted line) and the curve of the evolution of δD under continual evaporation towards isotopic composition of ocean sources (orange solid line). In this analysis, the observations are for clear sky (optical depth<0.2, Fig. 8a and b) and cloudy condition (optical depth>1.0, Fig. 8c and d) (Worden et al., 2007).
In clear-sky regions, the WIO has more water vapour in 2006 with 5.1 g/kg than that in 2005 with 4.0 g/kg, but similar isotopic composition as 2005 (−162.9‰ in 2005 and −161.7‰ in 2006), which may be affected by nearby cumulus clouds originated by shallow convection (Johnson et al., 1999; Lee et al., 2011). The cumulus clouds are triggered by shallow convection, which is likely to moisten the lower troposphere (Stevens, 2005). Despite an increase in precipitation and subtropical convection over the WIO, the overall isotopic distribution shows very little change as seen in Fig. 7 except for cloudy scenes (4.8 g/kg and −159.4‰ for 2005 and 6.0 g/kg, −168.5‰ for 2006) (Fig. 8a and c). In contrast, the EIO has more water in 2005 and is more depleted in heavy water vapour isotopes for both clear (6.1 g/kg and −167.8‰ for 2005 and 5.1 g/kg, −150.2‰ for 2006) and cloudy scenes (6.8 g/kg and −174.3‰ for 2005 and 6.0 g/kg, −156.0‰ for 2006); these changes occur along with increases in deep convection according to the OLR (Fig. 2), MLS cloud IWC data (Fig. 4) and increase in precipitation (Fig. 1).
An anti-correlation between precipitation amount and the isotopic composition of precipitation, the so-called ‘amount effect’ after Dansgaard (1964), has long been observed and discussed in the tropics (Lawrence et al., 2004; Bony et al., 2008; Risi et al., 2008a, 2008b; Feng et al., 2009). In the moisture source region where dry air subsides, resulting in strong evaporation and little precipitation, the precipitation forms at the beginning (enriched end) of the Rayleigh distillation curve. When moving away from the source region towards the intertropical convergence (ITC), the precipitation isotope decreases as the moisture progressively rains out. Feng et al. (2009) observed that the isotopic composition of precipitation reaches a minimum at the ITC because intensive rainout by convective activities within the rising air of the ITC causes the vapour, already depleted by initial rainout from the moisture source, to continue to rainout to the very light end of the Rayleigh distillation curve. The changes in the distribution of the isotopic composition of water vapour over the EIO during 2006 in both clear sky and cloudy scenes are consistent with these changes observed in the isotopic composition of precipitation. Bony et al. (2008) and Risi et al. (2008b) contributed the recycling of detrained water vapour from tropical convection to the isotopic depletion of precipitation in their model studies. These results are consistent with the explanation that precipitation associated with deep convection results in extra opportunities for water vapour to become more depleted through rainfall evaporation and the recycling of source vapour back into the convective system (e.g. Lawrence et al., 2004; Worden et al., 2007; Risi et al., 2008b).
On the contrary, the increased convection and precipitation over the WIO does not result in more isotopically depleted clear-sky scenes, and the increased isotopic depletion in cloudy scenes is less than that over the EIO. Consequently, there must be a compensating effect such as increased shallow convection over the WIO (relative to the EIO) to maintain the same isotopic composition. In 2006, the increased deep convection and precipitation depletes the water vapour in heavy isotope as the moisture rains out. In the clear sky, however, the increased shallow convection results in frequent mixing of enriched vapour originating from the local ocean surface.
5. Conclusions and implications
Variations in the ENSO, IOD and the interplay between them play a crucial role in changing the convective activity, which influences precipitation amount, tropospheric water vapour and its isotopic composition in the tropics. Here, we investigate the changes in convective activity using OLR, MLS cloud IWC and vertical velocities in the tropics and link these changes with water vapour amount and its isotopic composition using TES observations. When the convective activity is enhanced (reduced), water vapour amount increases (decreases) over both the WIO and EIO. When the convective activity is enhanced (reduced) over the EIO, the isotopic composition of water vapour is depleted (enriched) in heavy water vapour isotope. Although there is an increase in precipitation amount and convective activity over the WIO, there is little fractionation in the isotopic composition of water vapour, which suggests increased moistening of the free troposphere due to shallow convection to compensate for the expected decrease in isotopic composition from the increase in deep convection and precipitation.
These results are also useful not just for partitioning the moistening processes associated with convection but also for interpreting paleoclimate proxies. Variations in the isotopic composition of precipitation from paleo-records are used to examine variations in moist processes: condensation temperature, moisture source, pathway from source to sink or convection change with climate variability. Over the tropics near the warm pool, we would expect that paleo-records of precipitation isotopes will vary with long-term changes in deep convection based on these results (Hoffmann et al., 2003; Cobb et al., 2007; Partin et al., 2007). However, paleo-records of precipitation isotopes near Africa will be more difficult to relate to a single process because changes in convective activity result in changes in precipitation but do not have a significant impact on the isotopic composition of the source vapour based on this case study (Levin et al., 2009).
6. Acknowledgements
The research described in this paper was carried out at the Jet Propulsion Laboratory, California Institute of Technology, under a contract with the National Aeronautics and Space Administration. Support from NASA funding under 07-NEWS07-20 is gratefully remembered. This work was partially supported by KOPRI research grant (PE15010) and Basic Research Program through the National Foundation of Korea (NRF) funded by the Ministry of Education (2014R1A1A2057572).