Fig 1.
Geographical location of the three sampling stations (a). View from Izaña observatory during dust-free (b) and under Saharan dust conditions (c). Jungfraujoch station (d) and a view from Chaumont station across the Swiss Plateau towards Jungfraujoch on the crest of the snow covered mountain ridge on the horizon (e).
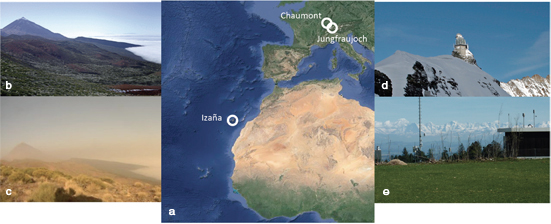
Fig 2.
Time course of IN−8 at Jungfraujoch (filled symbols indicate Sahara dust events) and maximum daily temperature (columns). When no freezing event was detected in 108 filter cut-outs (IN−8 below detection limit), values were set to 0.01 m−3.
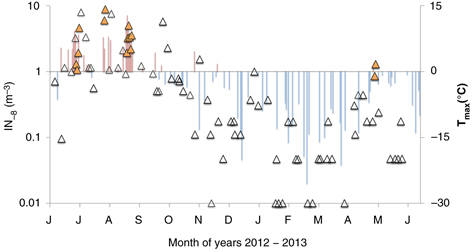
Fig 3.
Time course of IN−8 at Izaña (full symbols indicate Sahara dust events). Values of IN−8 below detection limit are set to 0.01 m−3.
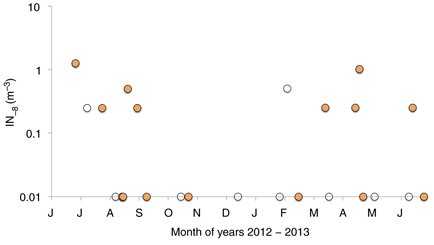
Fig 4.
Separation of data from Jungfraujoch into three groups (top left): large PM10 values (blue), small PM10 values but with large numbers of IN−10 (green), and the remainder (red). Source sensitivity fields, integrated from the model surface to 100 m above model ground τ0–100, for days with large PM10 values (top right), and for days with small PM10 values but large numbers of IN−10 (bottom).
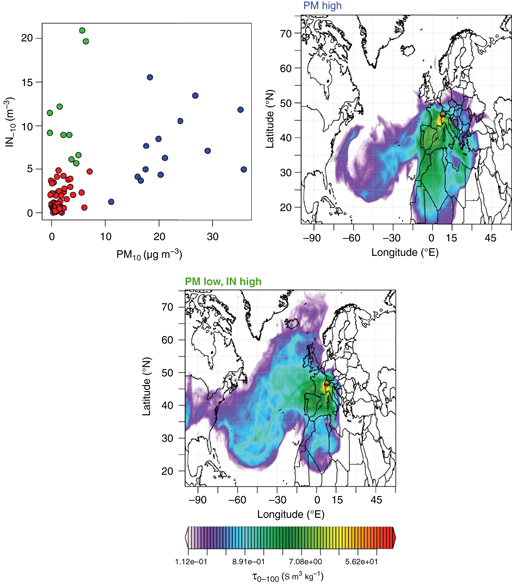
Fig 5.
IN−8 as a function of N>0.5 at Jungfraujoch (n =66). Full symbols indicate Sahara dust events. Values of IN−8 below detection limit are set to 0.01 m−3 to keep them in the plot and avoid a perception biased towards larger values. The regression line is fitted to all data (when data below detection limit is omitted from calculating the regression line, then R2=0.14).
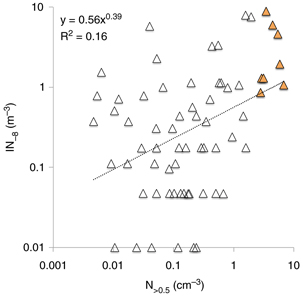
Fig 6.
Time course of IN−8 at Chaumont (symbols) and maximum daily temperature (columns). Full symbols indicate cold days (Tmax<0°C). Values of IN−8 below detection limit are set to 0.01 m−3.
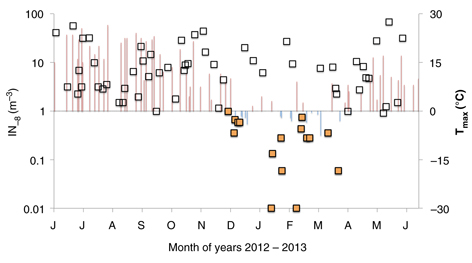
Fig 7.
IN as a function of Tmax at Jungfraujoch. The regression line is fitted to all data. Limiting the analysis to days for which N>0.5 data are available (n=66 instead of 83), R2 is reduced to 0.48. Values below detection limit were set to 0.01 m−3 to keep them in the plot and avoid a perception biased towards larger values. Omitting values below detection limit results in R2=0.55.
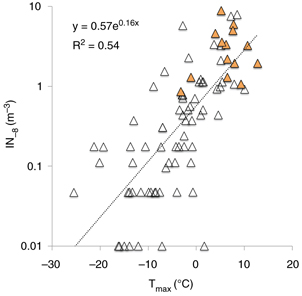
Fig 8.
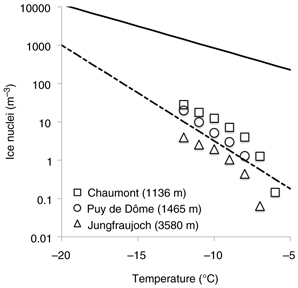
Median concentrations of IN active at −12°C or warmer at different heights above sea level. Data for Puy de Dôme are from Joly et al. (2014). Lines indicate temperature dependent parameterisations by Fletcher (1962; dashed line) and by Meyers et al. (1992; continuous line).