
Introduction
1.
A very small number of ice nuclei (IN) active at slight supercooling can impact cloud development by initiating a process of ice multiplication through riming and splintering. This is possible in a temperature window from −3 to −8°C (Hallett and Mossop, 1974). Mason (1996) explained how observed rapid glaciation of slightly supercooled cumulus clouds can be caused by less than 10 IN m−3 active at −8°C (IN−8) in cloud tops. Similarly, a more recent observation and modelling study by Crawford et al. (2012) led to the conclusion that about 10 IN m−3 active at −7.5°C were sufficient to initiate the ice phase in a cloud. There is little information on the abundance of such IN in the atmosphere. Almost all natural particles known so far to be IN−8 are of biological origin and include certain bacteria (Murray et al., 2012), fungal spores (Morris et al., 2013) and soil organic matter, probably derived from debris of former particles (Conen et al., 2011; O'Sullivan et al., 2014). Large temporal and spatial variation of their abundance in the atmosphere is likely to limit effects on clouds to specific seasons and locations (Després et al., 2012). The only mineral IN−8 discovered so far is K-feldspar, but it is probably of secondary importance at temperatures warmer than −15°C (Atkinson et al., 2013).
The objective of this study was to investigate processes that contribute to the abundance of IN−8 at the high-alpine site Jungfraujoch (3580 m.a.s.l.), Switzerland, throughout a 1-yr period. Factors potentially affecting IN−8 number concentrations at the station include Sahara dust events and aerosol transported from the planetary boundary layer air by upward flows. Large Sahara dust events occur about a dozen times a year (Collaud Coen et al., 2004). Air from the planetary boundary layer regularly reaches the station in summer, mainly during the afternoon. In other seasons, this upward transport of air from the boundary layer is less frequent and less intense (Lugauer et al., 1998; Collaud Coen et al., 2011; Griffiths et al., 2014). We analysed in immersion freezing mode samples of atmospheric particles (particulate matter–PM) collected on quartz micro-fibre filters. This freezing mode is probably dominant in clouds with temperatures warmer than −20°C (Westbrook and Illingworth, 2011). On its way towards Jungfraujoch, rising and cooling boundary layer air may preferentially lose particles with ice nucleation ability, leaving a population of particles depleted in IN to arrive at the station. To assess such potential influences we also analysed IN−8 during the approximately same 12-month period at two other atmospheric observatories: (1) Chaumont, a hill-site often situated within the planetary boundary layer at 95 km northwest of Jungfraujoch, and (2) Izaña mountain observatory (2367 m.a.s.l.) located 300 km to the west of the African coast on Tenerife Island, which is mostly under free tropospheric conditions and frequently impacted by the dust-laden Saharan Air Layer (Tsamalis et al., 2013). The important differences between the amount of IN−8 and their seasonal evolution at the three sites allowed us to investigate processes affecting spatial and temporal variability of IN.
Material and Methods
2.
Sites and IN analysis
2.1.
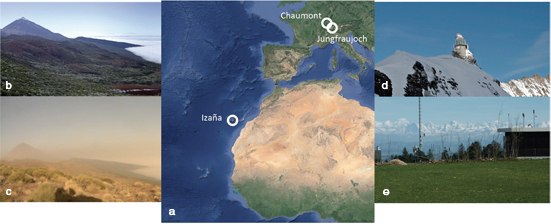
We previously developed a method by which samples of atmospheric particles collected from large volumes of air (>10 m3) on quartz micro-fibre filters can be analysed for IN at temperatures warmer than −12°C (Conen et al., 2012). Sampling of airborne particles on filters, with high-volume samplers, is regularly performed in atmospheric observatories and in air quality monitoring networks for determining the concentrations of PM10 particles (PM with an aerodynamic diameter smaller than 10 μm) by gravimetry. Sections of filters with PM10 samples were analysed within less than 1 yr after they had been collected from the atmosphere. In the meantime, they had been stored at −20°C, except during transport. Storage at −20°C may not have been necessary, because re-analysis of filters we had analysed previously showed no effect of storage on measured numbers of IN−8 at all, although storage between the first and the second analysis 1.5 yr later was at room temperature, just in a dark and dry place (office drawer). Sampling was performed at the three study sites (Fig. 1):
(1) At Jungfraujoch, located on the northern Alpine Ridge (07°59′02″ E, 46°32′53″ N, 3580 m.a.s.l.), sampling was performed during 24-hour periods (starting at midnight). Thus, each filter accumulated particles potentially transported from the boundary layer by the diurnal upward flows and particles associated with the free tropospheric condition at night (Weingartner et al., 1999).
(2) At Chaumont, located in the southern Jura at 700 m above the Swiss Plateau (06°58′45″ E, 47°02′58″ N, 1136 m.a.s.l.). The station is surrounded mainly by meadows and pastures. Samples were also collected during 24-hour periods (starting at midnight) and are mostly representative of the day-time boundary layer and night-time residual layer.
(3) At Izaña (16°29′58″ W, 28°18′32″ N, 2367 m.a.s.l.) the sampling was performed only at night (22:00–06:00 hours). Because particles transported from the boundary layer during the day-time up-slope wind period (Rodríguez et al., 2009) were not collected, the samples are representative of the free troposphere. In summer (July–August) Izaña is regularly within the dust-laden Saharan Air Layer (Rodríguez et al., 2011; Tsamalis et al., 2013).
Fig 1.
Geographical location of the three sampling stations (a). View from Izaña observatory during dust-free (b) and under Saharan dust conditions (c). Jungfraujoch station (d) and a view from Chaumont station across the Swiss Plateau towards Jungfraujoch on the crest of the snow covered mountain ridge on the horizon (e).
At Jungfraujoch and Chaumont, samples were collected between June 2012 and May 2013. To cover the full range of PM10 concentrations, all samples of a month were stratified by PM10 load into six groups and one filter from each group was randomly selected for analysis. At Jungfraujoch, the 72 randomly selected samples included three with PM10 values >10 μg m−3, associated with Saharan dust. The additional 11 samples in the 12-month period at Jungfraujoch with PM10>10 μg m−3 were also analysed. Source–receptor relationships for these days calculated with the dispersion model FLEXPART all included a Saharan component when PM10 concentrations were >10 μg m−3 (individual results available from http://lagrange.empa.ch/FLEXPART_browser/). Another strong evidence of the Saharan origin of these aerosols was the ochre or brown–yellow colour of these samples (Collaud Coen et al., 2004). At Izaña (16°29′58″ W, 28°18′32″ N, 2367 m.a.s.l.) we selected a total of 24 samples: 15 with Sahara dust (PM10>10 μg m−3) and nine without Saharan influence (PM10<10 μg m−3). Thirteen of the Sahara dust samples preceded dust events at Jungfraujoch by 1 to 7 d. All samples at Izaña were collected between June 2012 and June 2013. The air volume (ambient pressure) sampled on a single filter (140 mm effective diameter) was 1075 m3 at Jungfraujoch, 720 m3 at Chaumont and 240 m3 at Izaña.
From each filter we cut out 108 small circles (2 mm diameter) containing particles collected from 24 m3 of ambient air at Jungfraujoch, 16 m3 at Chaumont and 5 m3 at Izaña. When upper limits of detection were exceeded (all 108 sub-samples frozen before end of analysis), another 108 cut-outs of 1 mm diameter were analysed, containing particles from only a quarter of the aforementioned volumes of air. Each cut-out was placed in a 0.5 ml tube, 0.1 ml Milli-Q water was added and the tubes were exposed to decreasing temperatures (0.33°C min−1) from −4 to −12°C in a cooling bath. The number of frozen tubes was inspected visually and counted after every 1°C temperature step. Numbers of IN were calculated as explained earlier (Conen et al., 2012).
The smallest numbers of IN detectable (1 of 108 cut-outs causing a freezing event) were 0.06, 0.07 and 0.19 m−3 at Jungfraujoch, Chaumont and Izaña, respectively (adjusted to sea-level pressure). However, IN numbers in this range have little meaning on their own. Only an ensemble of several samples with such low numbers of IN can be treated statistically. The precision of an individual measurement on a single sample, based on 108 cut-outs from the same filter, gets better than ±50% when five or more of the cut-outs freeze, which is equivalent to about five times the number of IN m−3 stated above.
Sample blanks were obtained for Jungfraujoch and Chaumont from the 5 mm wide fringe of 19 and 20 filters, respectively, where no air had passed through the quartz fibre material. From Izaña, a total of eight blank filters were analysed. These had been handled the same way as other filters, except that they had never been placed in the air stream of the high-volume sampler. Average blank values were at Jungfraujoch in summer 0.10 and for the rest of the year 0.02 m−3; at Chaumont 0.08 m−3 and at Izaña 0.00 m−3. Blank values were subtracted to obtain net IN concentrations (expressed in m−3 at sea-level pressure).
Flexpart
2.2.
Source–receptor relationships (also source sensitivities) for the Jungfraujoch observations were calculated using the Lagrangian particle dispersion model FLEXPART (Stohl et al., 2005) driven with meteorological analysis from the European Centre for Medium-Range Weather Forecast (ECMWF) integrated forecast system (IFS). The horizontal resolution of these data in the Alpine area was 0.2°×0.2° and 1°×1° otherwise. Each simulation was based on a 3-hourly release of 50000 particles at the location of Jungfraujoch. Particles were then followed for 10 d backward in time. The resulting surface source sensitivities were integrated from the model surface to a sampling height 100 m above model ground, τ0–100. They indicate regions from which surface fluxes would have had an impact on the concentration at the receptor location. Source sensitivities can directly be multiplied with mass fluxes (emissions in units mass per time and area) and divided by the sampling height to yield mass mixing ratios at the receptor site (Stohl et al., 2005).
Particle numbers
2.3.
Concentrations of total number of particles >0.5 μm diameter (N>0.5) were determined at Jungfraujoch with an optical particle counter (OPC; Grimm™ Dust Monitor 1.108) connected to a heated total aerosol inlet (25°C), which, besides aerosol particles, also allows hydrometeors with D<40 μm to enter and to evaporate, at wind speeds of 20 m s−1. The instruments were operated at a laboratory temperature of 25°C and a relative humidity (RH) <15%. The 15-channel OPC was factory calibrated using polystyrene latex spheres (PSLs, refractive index=1.588) at a laser wavelength of 780 nm, yielding optical diameter (Dopt) size ranges of >0.3 μm, >0.4 μm, >0.5 μm, >0.65 μm, >0.8 μm, >1 μm, >1.4 μm, >2 μm, >3 μm, >4 μm, >5 μm, >7.5 μm, >10 μm, >15 μm and >20 μm. Complete 24 hours observations were available for 66 of the 83 d for which IN−8 was determined.
Results and discussion
3.
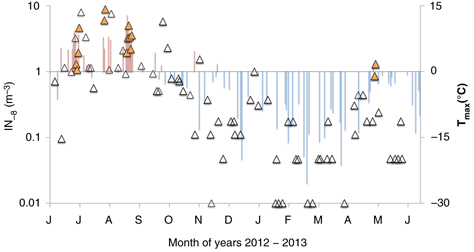
A seasonal cycle in IN−8 at Jungfraujoch was perceivable despite a fair amount of scatter on a monthly time scale (Fig. 2). Values in the order from 1 to 10 m−3 were observed during summer (June, July, August), decreasing throughout autumn to values predominantly smaller than 0.1 m−3 during winter and early spring (February, February, March), before increasing again in April. In May 2013, values were smaller than in the preceding month, which may have been due to May 2013 having been around 2°C colder, while April 2013 had been slightly warmer than usual (MeteoSchweiz, 2013). A similar seasonality at Jungfraujoch was observed over 14 yr in the aerosol scattering coefficient and is related to the influence of planetary boundary layer air, which is particularly favoured by convective weather types dominant in summer (Collaud Coen et al., 2011). The scattering coefficient is sensitive to particles of a size range that overlaps with the size of particles (>0.5 μm) observed to correlate with IN (DeMott et al., 2010).
Fig 2.
Time course of IN−8 at Jungfraujoch (filled symbols indicate Sahara dust events) and maximum daily temperature (columns). When no freezing event was detected in 108 filter cut-outs (IN−8 below detection limit), values were set to 0.01 m−3.
Influence of Sahara dust and particles>0.5 μm
3.1.
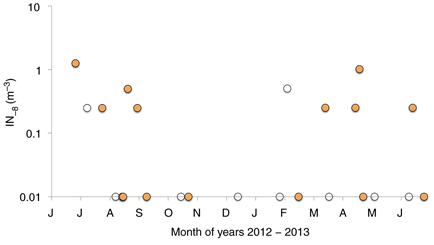
Concentrations of IN−8 during Sahara dust events were in the upper range of observed values, but not larger than other summer values without Saharan influence. Does this mean that Saharan dust contains only negligible numbers of IN−8? Mean travelling time of Saharan dust from the northern and north-western part of the Sahara to Jungfraujoch is 4 d (Collaud Coen et al., 2004). Our observations during Sahara dust events at Izaña (PM10>10 μg m−3; median 39 μg m−3), 1 to 7 d before a dust event at Jungfraujoch, indicate number concentrations mostly well below 1 m−3 (Fig. 3). The median concentration of IN−8 during a Sahara dust event was therefore an order of magnitude smaller at Izaña than at Jungfraujoch (0.2 and 2.8 m−3, respectively). Since dust storms are very much large-scale events and their extended plumes do not follow narrow trajectories, we cannot claim to have sampled the same ‘air parcels’ at Jungfraujoch that had been sampled at Izaña before. Still, time-lags between observations at both stations suggest some link between them. Probably, Sahara dust events make little difference to the number of IN−8 around Jungfraujoch except, perhaps, during winter, when concentrations are generally very small.
Fig 3.
Time course of IN−8 at Izaña (full symbols indicate Sahara dust events). Values of IN−8 below detection limit are set to 0.01 m−3.
IN active at −10°C were similarly abundant at Jungfraujoch (Fig. 4, top left), no matter whether simulated source sensitivity fields revealed pronounced influence from the Sahara (Fig. 4, top right) during episodes with elevated PM10 concentrations, or for periods with moderate PM10 concentrations, when source sensitivities were more restricted to Western Europe (Fig. 4, bottom). In contrast, numbers of IN active at −18°C were clearly enhanced at The Taunus Observatory (825 m.a.s.l.) in Germany (Klein et al., 2010) and at −31°C at Jungfraujoch (Chou et al., 2011) during Sahara dust events, and at temperatures below −12°C during dust events in the eastern Mediterranean (Ardon-Dryer and Levin, 2014). Contrast is not contradiction. As a rule of thumb, ice nucleation at temperatures colder than approximately −15°C is dominated by mineral dust and at warmer temperatures by biological particles (Murray et al., 2012; Atkinson et al., 2013). Mineral dust is the dominant component in Saharan dust plumes (Kandler et al., 2007; Rodríguez et al., 2011), although they may contain some biological material from North Africa (Izquierdo et al., 2010). Our results indicate a very minor biological component, or at least a very small number of biological IN in Saharan dust plumes. Observations by Ardon-Dryer and Levin (2014) in the eastern Mediterranean (Tel Aviv), using a very similar filter technique, equally showed no evidence for IN active at −10°C in dust plumes, although the earliest observed onset of freezing was at warmer temperatures during dust events (−12°C), than during relatively clean atmospheric conditions (−15°C).
Fig 4.
Separation of data from Jungfraujoch into three groups (top left): large PM10 values (blue), small PM10 values but with large numbers of IN−10 (green), and the remainder (red). Source sensitivity fields, integrated from the model surface to 100 m above model ground τ0–100, for days with large PM10 values (top right), and for days with small PM10 values but large numbers of IN−10 (bottom).
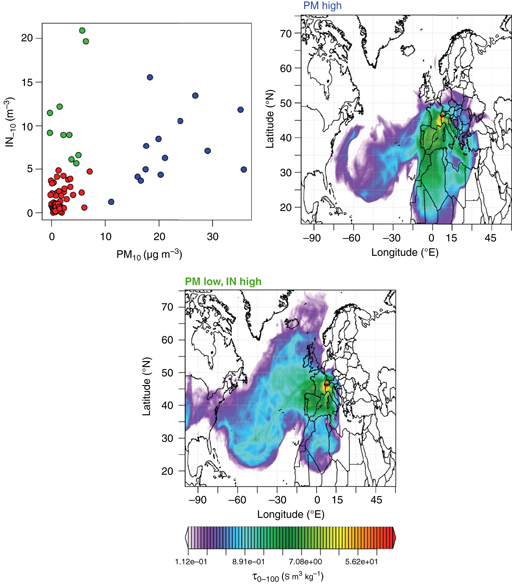
Seifert et al. (2010) suggested that the absence of ice in clouds at −10°C over Cap Verde was due to a lack of IN active at this temperature. Biological IN active at slight supercooling are probably more abundant over fertile land, as indicated by the observation of about a quarter of clouds over central Europe containing ice at −10°C (Seifert et al., 2010). Agricultural fields emit soil organic matter through wind erosion to the atmosphere and are possibly an important anthropogenic source of biological IN (Conen & Leifeld, 2014). Another source is plant surfaces from where bacterial and fungal spores are emitted (Burrows et al., 2009; Morris et al., 2013). Therefore, we presume that the relatively abundant IN−8 at Jungfraujoch during summer originates from fertile regions in Europe and not from the Saharan dust plume or remainders thereof. This is also supported by the source sensitivities for Jungfraujoch samples with IN−8>5 m−3 and PM10<10 μg m−3, which were focused on south-western, continental Europe Fig. 4, bottom).
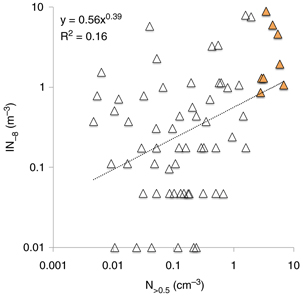
A good correlation (R2=0.57) between IN active at −33.5°C and the number concentration of particles>0.5 μm diameter (N>0.5) has previously been reported (DeMott et al., 2010, supplementary Figure 1), getting weaker at increasingly warmer temperatures (R2=0.47 at −27.5°C; R2=0.39 at −11.5°C). For IN−8, we found a weak correlation with N>0.5 at Jungfraujoch (Fig. 5). Only one IN−8 in every 106–107 N>0.5 (Fig. 5) does not provide for a strong coupling between both kinds of particles. From this we conclude that the observed seasonality in IN−8 at Jungfraujoch is unlikely to be driven by the seasonality of the bulk aerosol measured at Jungfraujoch (Collaud Coen et al., 2011).
Fig 5.
IN−8 as a function of N>0.5 at Jungfraujoch (n =66). Full symbols indicate Sahara dust events. Values of IN−8 below detection limit are set to 0.01 m−3 to keep them in the plot and avoid a perception biased towards larger values. The regression line is fitted to all data (when data below detection limit is omitted from calculating the regression line, then R2=0.14).
Influence of deposition
3.2.
Another factor driving seasonality in IN−8 could be seasonal variations in sink strength. Fridlind et al. (2012) predicted the depletion of IN from the well-mixed boundary layer within minutes when conditions are cold and humid enough to activate IN and make them grow into ice crystals. For IN active at warmer temperatures this process is expected to quickly lead to increasing particle size and accelerating deposition velocity. Experimentally, efficient depletion of IN from a supercooled cloud has been reproduced under controlled conditions in a large cloud chamber, where aerosolised suspensions of bacteria had been introduced and exposed to temperatures around −20°C. A fraction of the bacterial population was ice nucleation active at slight supercooling. This fraction declined only slowly as long as no cloud formed. Once cloud formation was induced by a slight pressure drop inside the chamber, the fraction of ice nucleation active bacteria suspended in air declined rapidly by at least two orders of magnitude (Pierre Amato, Institut de Chimie de Clermont-Ferrand, France, personal communication). Although there is no doubt about the reality of the Wegener–Bergeron–Findeisen process, its efficient selective removal of the IN-active fraction from a population of suspended bacteria is striking. The same mechanism may remove particles active as IN at high temperatures from an airborne population of other particles of similar size. This could have caused the weak correlation between IN−8 and N>0.5 described earlier. However, selective deposition is not necessary to explain the apparent lack of high-temperature IN in the Saharan dust contribution to Jungfraujoch; such IN were already missing at Izaña, near the dust source.
Observations at Chaumont show numbers of IN−8 in the planetary boundary layer can be large throughout the year (>10 m−3 on 15 of 72 d). Unlike at Jungfraujoch, there was no discernable seasonality in the upper bound of values. This suggests that the ensemble of sources influencing IN−8 in the boundary layer may have a relatively steady strength across all seasons (Fig. 6), although the mix of sources perhaps changes over the course of the year. However, the lower bound of values was clearly lower in winter than at other times, but only on cold days when maximum daily temperature (Tmax) did not exceed 0°C. Apart from temperature, there was little difference in meteorological conditions at Chaumont between the cold and warmer days (Tmax>0°C) in the period from end of November to beginning of April. Daily maxima of RH exceeded 95% on 11 of 16 cold days and on 8 of 11 warmer days analysed for IN−8. Average wind speeds were 2.8 and 4.0 m s−1 on cold and on warmer days, respectively. Precipitation occurred on nine of the cold and on seven of the warmer days with total daily amounts ranging from 0.02 to 2.4 mm day−1 and from 0.02 to 2.0 mm day−1, respectively. The only other difference apart from temperature was in predominant wind directions. Cold days more often had a northerly component (68% of the time) than warmer days (33% of the time). However, there was also considerable overlap in wind sectors between cold and warmer days.
Fig 6.
Time course of IN−8 at Chaumont (symbols) and maximum daily temperature (columns). Full symbols indicate cold days (Tmax<0°C). Values of IN−8 below detection limit are set to 0.01 m−3.
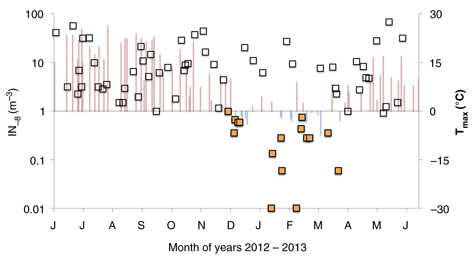
Air from the planetary boundary layer transported towards Jungfraujoch at times other than summer is very likely to experience on its way humid and cold conditions similar to those at Chaumont on cold winter days. Jungfraujoch itself is regularly in clouds (37% of the time, as observed over a 12 month period by Baltensperger et al., 1998). Maximum daily temperatures at Jungfraujoch rarely exceeded 0°C between September 2012 and May 2013. During this period, the majority of observed IN−8 concentrations was<1 m−3 (49 of 55 values) and in a similar range as at Chaumont on days when Tmax<0°C. The correlation between IN−8 and Tmax at Jungfraujoch was relatively strong (R2=0.54; Fig. 7). Even when limiting the analysis to days for which N>0.5 values are available, the correlation was still much stronger between IN−8 and Tmax (R2=0.48) than it was between IN−8 and N>0.5 (R2=0.16).
Fig 7.
IN as a function of Tmax at Jungfraujoch. The regression line is fitted to all data. Limiting the analysis to days for which N>0.5 data are available (n=66 instead of 83), R2 is reduced to 0.48. Values below detection limit were set to 0.01 m−3 to keep them in the plot and avoid a perception biased towards larger values. Omitting values below detection limit results in R2=0.55.
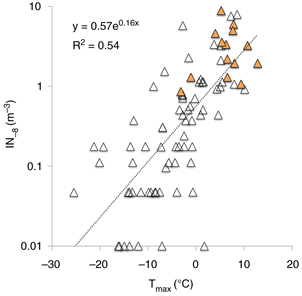
Observations by Bigg (1996) in the high Arctic revealed a four-fold decrease in IN active at −15°C when air temperatures decreased from 0 to −10°C, and little or no change when air temperatures increased above 0°C. He inspected whether he may have seen a purely seasonal effect, but found the relationship was still highly significant after adjusting the results for the mean seasonal change. Our observations are similar, showing a five-fold decrease in concentrations of IN−8 between Tmax of 0 and −10°C at Jungfraujoch (calculated from a log-linear fit to the data, given in Fig. 7). In summary, we think that IN−8 transported with boundary layer air towards Jungfraujoch are frequently subject to microphysical processing, such as previously hypothesised by Phillips et al. (2008) for mineral dust during long-range transport.
Comparison with parameterisations
3.3.
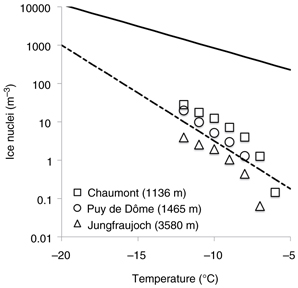
Summarised and put into context, data from Chaumont and Jungfraujoch show median values largely following the parameterisation by Fletcher (1962) (Fig. 8). It is interesting to see that the exponential fit (parameterisation) seems to miss the strong drop of IN at highest temperatures. Nevertheless, our data lend some support to the validity of this parameterisation for temperatures warmer than −12°C. Also very similar to our data are median values determined by Joly et al. (2014) from IN abundance in cloud water during 12 independent cloud events between June 2011 and October 2012 on Puy de Dôme (1465 m.a.s.l.). These data are comparable to ours because observations were also made over a full year and only about 350 km to the West of our sites, with a boundary layer influence larger than at Jungfraujoch, but slightly smaller than at Chaumont. The three stations together clearly show decreasing number concentrations of IN with altitude. A very first investigation of the vertical distribution of IN in the atmosphere was conducted by B. M. Cwilong in April 1947. He studied the threshold temperature for deposition mode freezing of ambient air at Oxford and at Jungfraujoch and concluded that IN ‘effective in the lower air are usually absent from air at the height of Jungfraujoch’ (Cwilong, 1947). Our results do not go as far as suggesting absence, but they indicate over the course of a year about an order of magnitude smaller numbers of IN at Jungfraujoch than in boundary layer air (at Chaumont).
Fig 8.
Median concentrations of IN active at −12°C or warmer at different heights above sea level. Data for Puy de Dôme are from Joly et al. (2014). Lines indicate temperature dependent parameterisations by Fletcher (1962; dashed line) and by Meyers et al. (1992; continuous line).
Conclusions
4.
Glaciation of a cloud not colder than −8°C may often be limited by a low abundance of IN. This is the case even in the boundary layer above a landscape with abundant potential sources of biological particles. The single largest source of dust on Earth, the Sahara desert, seems to generate only a negligible number concentration of IN−8 in the atmosphere. To appraise whether IN−8 abundance is sufficient for initiating ice multiplication in a supercooled cloud requires, first and foremost, information on the origin of particles it contains (desert or vegetated land) and the likelihood of previous IN activation in the air mass under consideration.
5. Acknowledgements
We thank the International Foundation High Altitude Research Stations Jungfraujoch and Gornergrat (HFSJG), 3012 Bern, Switzerland, for providing the infrastructure and making it possible for NABEL (Empa and BAFU) to operate a PM10 sampler and other instruments at the High Altitude Research Station at Jungfraujoch. We are grateful to Claudia Zellweger and Martin Steinbacher for the PM10 filters from Jungfraujoch and from Chaumont. MeteoSwiss provided meteorological data for Jungfraujoch, NABEL (Empa and BAFU) for Chaumont. OPC data were acquired by Paul Scherrer Institute in the framework of the Global Atmosphere Watch (GAW) programme funded by MeteoSwiss with further support provided by FP7 project BACCHUS (grant agreement no. 603445). Measurements at Izaña are part of the Global Atmospheric Watch program funded by AEMET and the Minister of Economy and Competitiveness of Spain (project POLLINDUST, CGL2011-26259).We are grateful to Claude Schneider for making the tools used to cut out small circles from PM10 filters and to Daniela Gurtner for support with IN analysis. FC and CA are grateful to the Swiss National Science Foundation for financial support to their work on atmospheric ice nuclei through project number 200021_140228.