Fig 1.
Map showing the station locations in the western coastal Bay of Bengal during 1991 (blue plus) and 2011 (red plus). The circles show time-series observation sites – Visakhapatnam (VSP) and Paradip (PRP).
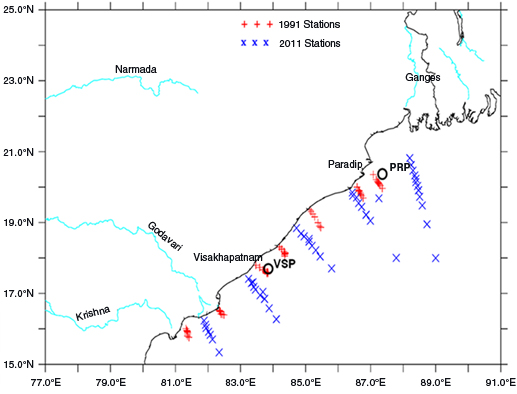
Fig 2.
Distribution of surface temperature and salinity in the western coastal Bay of Bengal during 1991 (top panel) and 2011 (bottom panel).
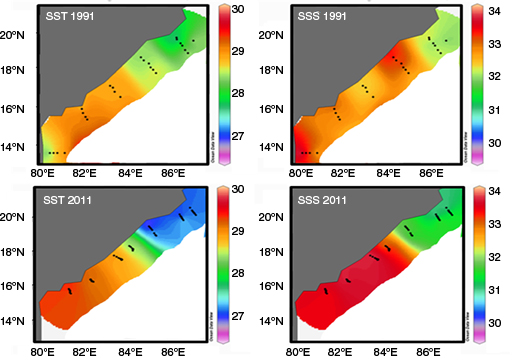
Fig 3.
Spatial variations in monthly mean climatological SST differences between 2002–2012 and 1982–1991 for different months from December to April.
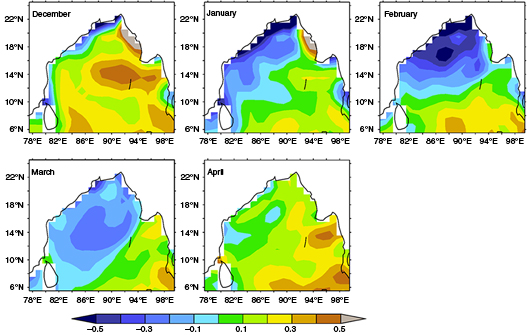
Fig 4.
Decadal variations in the seasonal cycles of air temperature (AT) and sea surface temperature (SST) in the northwestern coastal Bay of Bengal (18–22° N; 84–91°E) (top panel) and the seasonal cycles in the differences of AT and SST from 2002–2012 to 1982–1991 (bottom panel).
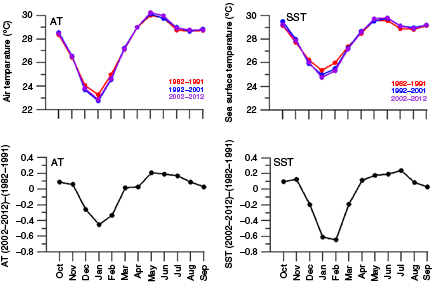
Fig 5.
Distributions of surface DIC (μM), pH and pCO2 (μatm) in the western coastal Bay of Bengal during 1991 (top panel) and 2011 (bottom panel).
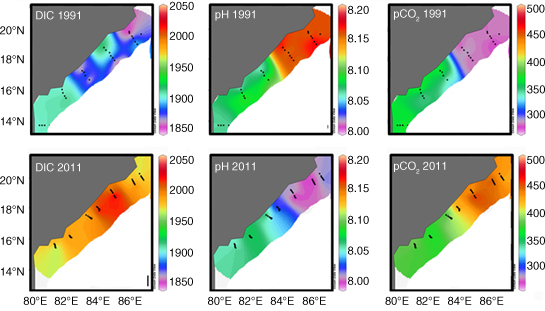
Table 1.
The rates of change in DIC, pH and pCO2 in different parts of the world ocean
Fig 6.
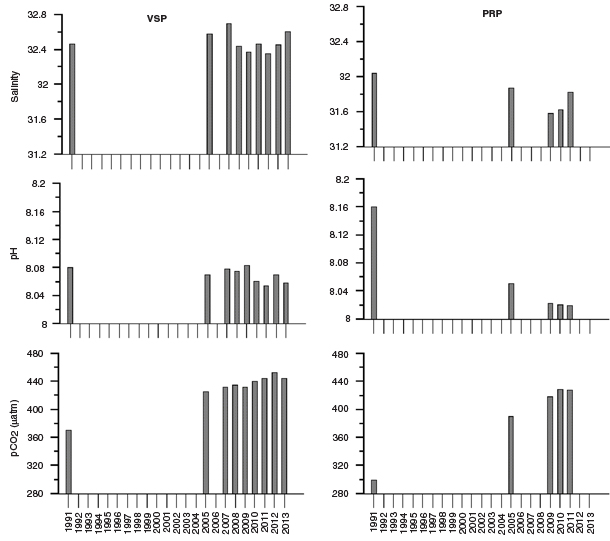
Time-series variations mean (February–March) salinity, pH and pCO2 (μatm) at time-series stations off Visakhapatnam (VSP; left panel) and Paradip (PRP; right panel).