
Introduction
1.
Anthropogenic activities have caused increased inputs of nitrogen and sulphur to the atmosphere that have resulted in large fluxes of ammonia, NOx, and sulphur dioxide (ca., 4, 2 and 2 Tmol y−1, respectively) to the atmosphere (IPCC, 2001). Fossil fuel combustion and biomass burning have increased nitrogen and sulphur to above natural fluxes and constitute the core of anthropogenic activity (Mackenzie, 1995; Schlesinger, 1997). These gases are transformed chemically to nitrate and sulphate aerosols in the atmosphere that eventually deposit to the ocean and decrease the pH of the surface waters. Since the lifetime of these species in the atmosphere is quite short (few days to a week), they will be deposited close to their source(s), primarily the surrounding land and coastal ocean (NAPAP, 1991; Howarth et al., 1996; Rodhe et al., 2002; Dentener et al., 2006), and are therefore considered to be an environmental problem for both terrestrial and marine ecosystems (Likens et al., 1981; Driscoll et al., 2001; Galloway, 2001, 2003). Based on numerical models, Doney et al. (2007) suggested that the impact of atmospheric inputs of HNO3, H2SO4 and NH3 is substantial in the coastal waters and enhances coastal acidification in addition to large-scale climate changes.
The emission of sulphur dioxide (SO2) from India steadily increases at the rate of ~0.12 TgSy−1 (Smith et al., 2001). Similarly, black carbon emissions in South Asia increased from about 170 Gg y−1 in 1950 to about 550 Gg y−1 in 2000 (Bond et al., 2007). Such increases in pollution over the Indian Ocean between December and April were reported as anthropogenic haze (Indo-Asian haze or Brown clouds; Ramanathan et al., 2001, 2007). The Indo-Asian aerosols impact the radiative forcing through a complex set of heating (positive forcing) and cooling (negative forcing) processes (Ramanathan et al., 2001). Ultimately, the effect of haze is the large negative forcing (−20 W m−2) at the surface and comparably large atmospheric heating at higher altitudes.
Kumar et al. (2008b) estimated higher non-sea salt sulphate (nss-SO4) in the marine atmosphere boundary layer over the Bay of Bengal (mean: 5.7 μg m−3) compared to fluxes in the Arabian Sea (mean: 2.9 μg m−3), indicating that the former receives more pollutants than the latter region during January to April when air flow from land to sea (continental flow) is dominant. Recently, Srinivas and Sarin (2013) observed high dry-deposition fluxes of nitrogen (0.5–4.8 μmol m−2 d−1), phosphorus (2–167 μmol m−2 d−1) and iron (0.02–1.2 μmol m−2 d−1) over the northern Bay of Bengal. Excess fertilisers utilised on land ends up either in the ground water or on the land surface. Soil dust uplifted from the agricultural fields contributes urea and ammonia to the atmospheric aerosols. Srinivas et al. (2011) concluded that biomass burning and the large-scale use of fertilisers (urea) are the most likely sources of atmospheric aerosols over the northern Indian Ocean. Industrial activities are also on the increase in recent years on the Indian subcontinent (Ministry of Commerce and Industry, Government of India; www.dipp.nic.in). In addition, India is the second-largest consumer of agricultural fertilisers in the world (Fertilizer Association of India; www.faidelhi.org). The bulk of fertiliser consumption (>78%) is along the east coast of India, and in this, about 67% is used in northeastern India. This fertiliser use correlates with an atmospheric input of nitrogen to the Bay of Bengal that is an order-of-magnitude greater than in the Arabian Sea (Srinivas et al., 2011).
Zhang and Reid (2010) observed an increasing trend of Aerosol Optical Depth (AOD) between 2000 and 2009 over the northwestern Bay of Bengal (0.07 per decade), the east coast of Asia (0.06 per decade) and the Arabian Sea (0.06 per decade). These trends reflect increases in the optical intensity of aerosol events, suggesting increased anthropogenic aerosols in the Bay of Bengal and the east coast of China, as well as stronger dust events over the Arabian Sea. However, the impact of the recent increase in aerosol loading on ocean acidification in the coastal Bay of Bengal is unknown.
Kumar et al. (1996) suggested that the western coastal Bay of Bengal is a strong sink for atmospheric CO2 during March–April 1991. The low surface ocean pCO2 levels were attributed to high biological production driven by nutrients sourced from atmosphere and rivers and a subsequent increase in scavenging of this organic matter (OM) to depth by river-borne mineral particles (Ittekkot et al., 1991; Kumar et al., 1996). Considering the increased industrial and agricultural activity along the east coast of India, it is important to understand the influence of atmospheric aerosols on pH and CO2 fluxes in the coastal Bay of Bengal. In order to examine the recent changes in the inorganic carbon system in the coastal Bay of Bengal and the impact of anthropogenic activities, a study was conducted during March–April 2011 in the Bay of Bengal, and the results were synthesised with previous data from a 1991 study and recent time-series observations.
Materials and methods
2.
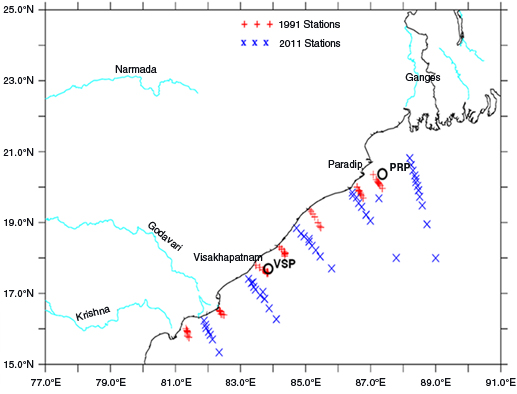
Surface samples were collected on board RV Sindhu Sankalp (#SSK 12) during 11–27 March 2011 in the coastal Bay of Bengal from 56 stations occupied during seven transects (eight stations in each transect) (Fig. 1). All transects were perpendicular to the coast from as close as ~2 km from the coast to the continental slope. Water sampling was carried out using a Sea Bird Conductivity–Temperature–Depth–rosette system fitted with 10 L Niskin bottles. The pH and total alkalinity (TA) were measured by potentiometric (Metrohm, Zofingen, Switzerland) Gran titration method following standard operating procedures suggested by the Department of Energy (DOE, 1998). DIC was measured using a coulometer (model CM 5014; UIC Inc., Joliet, Il, USA) attached to an automated subsampling system (Sarma, 1998). The precisions for pH, TA and DIC were ±0.002, ±2.0 and ±1.8 μmol l−1, respectively. Samples were collected during March–April 1991 by Kumar et al. (1996) along the coastal Bay of Bengal (Fig. 1). pH was measured spectrophotometrically following Byrne and Breland (1989) and the DIC was determined using a coulometer (model 5011, U.I.C. Inc., USA). The analytical precision was ±4 μmol l−1 for DIC and ±0.001 for pH (Kumar et al., 1996). The pCO2 was computed using measured salinity, temperature, nutrients (phosphate and silicate), pH and DIC using the CO2 SYS programme (Lewis and Wallace, 1998). The CO2 dissociation constants given by Millero et al. (2006) in the 0–40 salinity range were used. The air–water flux of CO2 was estimated using formulations given by Wanninkhof (1992) based on surface pCO2 levels and wind speeds from TropFlux (Praveen Kumar et al., 2012) at 10 m above sea level and atmospheric pCO2 values of 355 and 391 μatm for 1991 and 2011, respectively (http://cdiac.esd.ornl.gov/pns/current_ghg.html).
Fig 1.
Map showing the station locations in the western coastal Bay of Bengal during 1991 (blue plus) and 2011 (red plus). The circles show time-series observation sites – Visakhapatnam (VSP) and Paradip (PRP).
Results and discussion
3.
Variations in hydrographic properties in the western coastal Bay of Bengal during 1991 and 2011
3.1.
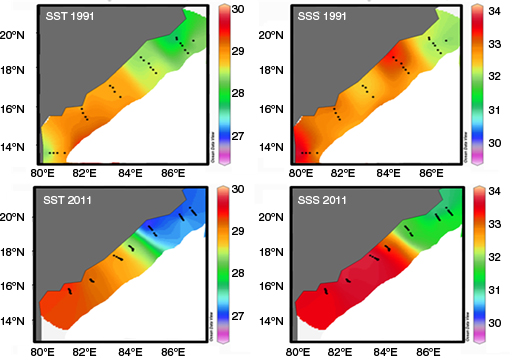
Relatively cooler and fresher waters were observed in the NW coastal Bay of Bengal, while warmer and higher salinity waters were observed in the SW coastal Bay of Bengal in both 1991 and 2011 (Fig. 2). The spatial difference in temperature and salinity along the coast arises from the circulation driven by the poleward flowing East India Coastal Current (EICC; Shetye et al., 1996), a well-developed western boundary current (of the seasonal subtropical gyre) that delivers high salinity waters from south to north, whereas the persistent discharge from the Ganges–Brahmaputra (GB) riverine system decreases the salinity in the north during our study period (Shetye, 1993). Between 1991 and 2011, significant differences in sea surface salinity (SSS) and sea surface temperature (SST) were observed with an increase of 0.68±0.2 and 0.04±0.02°C in the southwest (south of 18°N) and a considerable decrease of 0.74±0.3 and 1.30±0.5°C in the northwest (north of 18°N) coastal Bay of Bengal. The GB discharge accounts for ~25% of the total amount of freshwater received by the Bay of Bengal. Recently Papa et al. (2010) observed that river discharge during the pre-monsoon season (March–May) showed a slight increasing trend in discharge from 1993 to 2008. The observed change in SSS by ~0.70 along the northwestern coastal Bay of Bengal resulted from variations in GB river discharge and changes in the intensity of EICC during 1991–2011. The observed decrease in SST by 1.3°C over two decades in the northwestern Bay of Bengal could be attributed to either an increase in the vertical mixing or a considerable increase in aerosol loadings resulting in decrease in incoming solar radiation (Ramanathan et al., 2001). The increase in vertical mixing would increase salinity as well; however, the concurrent decreases in both SSS and SST suggest that vertical mixing is not responsible for such changes. On the other hand, Ramanathan et al. (2001, 2007) observed that anthropogenic haze (Indo-Asian haze or brown clouds) spreads over most of the Indian Ocean between December and April and impacts the radiative forcing, leading to decreases in temperature in the lower atmosphere and subsequently the SST.
Fig 2.
Distribution of surface temperature and salinity in the western coastal Bay of Bengal during 1991 (top panel) and 2011 (bottom panel).
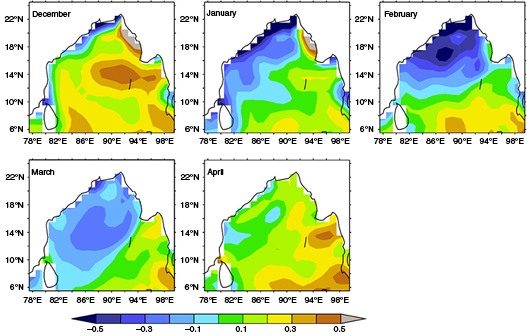
In order to examine the influence of Indo-Asian haze on the Bay of Bengal, decadal monthly mean SST climatologies were prepared for 1982–1991, 1992–2001 and 2002–2012 using TropFlux data set (Praveen Kumar et al., 2012). To understand the recent variations in SST in the Bay of Bengal, the mean SST during 1982–1991 was subtracted from the mean SST during 2002–2012, and these differences were plotted by month for January to April (Fig. 3). SSTs in the recent decade are seen to decrease by up to 0.8°C in the northwestern Bay of Bengal in February; this 20-yr difference in SST diminished by April, indicating that the Indo-Asian haze influence over SST is greatest during winter months.
Fig 3.
Spatial variations in monthly mean climatological SST differences between 2002–2012 and 1982–1991 for different months from December to April.
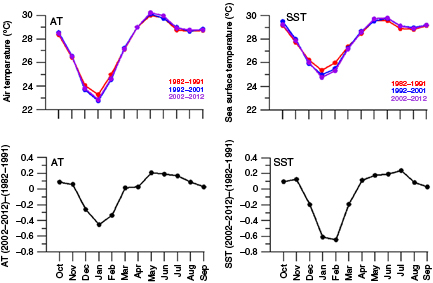
To further investigate the influence of Indo-Asian haze on the surface water and in the atmospheric boundary layer, monthly mean variations in air temperature (AT) and SST in the northwestern Bay of Bengal (18–22° N; 84–91°E) were analysed using TropFlux data. Decadal mean annual cycles of AT and SST during 1982–1991, 1992–2001 and 2002–2012 were plotted in Fig. 4. In January–February in the northwest Bay of Bengal, the AT decreased by 0.33–0.45°C from 1982–1991 to 2002–2012, and the SST decreased by 0.61–0.64°C. The decrease in TropFlux SST's between 1991 and 2011 by 1.1°C is consistent with the measured decrease of 1.3°C during the same time period. The AOD increased by ~0.07 (Zhang and Reid, 2010) over the northern coastal Bay of Bengal since the last decade, further confirming that the decrease in SST was caused by enhanced aerosol loading.
Fig 4.
Decadal variations in the seasonal cycles of air temperature (AT) and sea surface temperature (SST) in the northwestern coastal Bay of Bengal (18–22° N; 84–91°E) (top panel) and the seasonal cycles in the differences of AT and SST from 2002–2012 to 1982–1991 (bottom panel).
Variations in inorganic carbon properties in the western coastal Bay of Bengal during 1991 and 2011
3.2.
The distribution of DIC in the surface waters followed the salinity pattern and ranged from 1840 to 1930 μmol kg−1 in 1991 and 1936 to 2086 μmol kg−1 in 2011 (Fig. 5). Since salinity changed between 1991 and 2011, the DIC data was normalised to salinity 35. The mean salinity normalised DIC concentration was lower in the southwestern (2036 μmol kg−1) than in the northwestern coastal Bay of Bengal (2034 μmol kg−1) during 1991 and increased to 2067 and 2198 μmol kg−1 respectively during 2011. In addition to this, the difference in salinity normalised DIC between the northern and southwestern coastal Bay of Bengal was less during 1991 (2 μmol kg−1) than in 2011 (131 μmol kg−1). This indicates that DIC increased in the surface waters from 1991 to 2011 at the rate of 1.6 μmol kg−1y−1 in the north and 8.2 μmol kg−1y−1 in the southwest Bay of Bengal.
Fig 5.
Distributions of surface DIC (μM), pH and pCO2 (μatm) in the western coastal Bay of Bengal during 1991 (top panel) and 2011 (bottom panel).
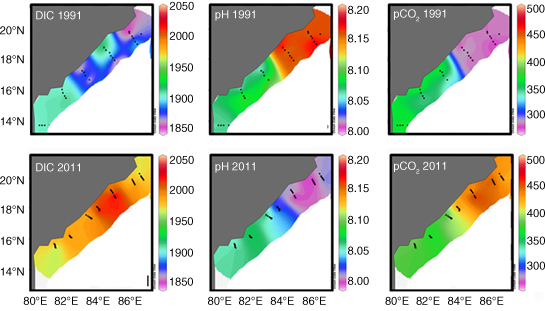
Similarly, the pH of the surface waters in 1991 showed significant north–south variations, with relatively basic values in the northwestern coastal Bay of Bengal associated with low salinity, and vice versa in the southwest during 1991; interestingly, this pattern reversed during 2011 in the coastal Bay of Bengal (Fig. 5). The pH of the Ganges waters was relatively basic (8.13±0.24; Mukhopadhyay et al., 2003), also confirmed by the recent observations of Sarma et al. (2012) who reported high pH and low pCO2 in the northern coastal Bay of Bengal during peak discharge period. The source water (Ganges River) is formed through the melting of Himalayan glaciers, (a degassing process) which picks up atmospheric gases en route and may be undersaturated (Chen et al., 2012). Hence, low concentrations of trace gases are observed with low pH (Sarma et al., 2012; Rao et al., 2013). Nevertheless, the pH of the surface water decreased from 1991 to 2011 by 0.02 in the south and 0.14 in the northwestern coastal Bay of Bengal, equivalent to a rate of decrease of 0.001 and 0.007 units y−1, respectively.
Kumar et al. (1996) reported lower-than-atmospheric pCO2 levels (275–400 μatm) in the coastal Bay of Bengal during the pre-monsoon seasons in both the southwest and northeast regions. Since the difference between the pCO2 levels in the Bay of Bengal were less than atmospheric value (355 μatm) by 50–100 μatm, the Bay of Bengal was reported to be a strong sink for atmospheric CO2 during 1991. The pCO2 levels in 2011 were significantly higher (342–504 μatm) than those in 1991, with the rates of increase of 1.5 μatm y−1 in the south and 6.7 μatm y−1 in the northwestern coastal Bay of Bengal.
Interestingly, the rates of increase in salinity-normalised DIC and pCO2, concurrent with the decrease in pH in the southwestern coastal Bay of Bengal, are similar to the global rates, whereas the pH is an order of magnitude higher in the northwestern coastal Bay of Bengal (Table 1). Such a dramatic decrease in pH could be due to either inter-annual variations or increased aerosol loading. We now look to long-term trends in pCO2 levels from the monthly time-series to examine the effects of acidification on inorganic carbon cycling in the Bay of Bengal.
Table 1.
The rates of change in DIC, pH and pCO2 in different parts of the world ocean
Long-term variations of salinity, pH and pCO2 at the coastal stations
3.3.
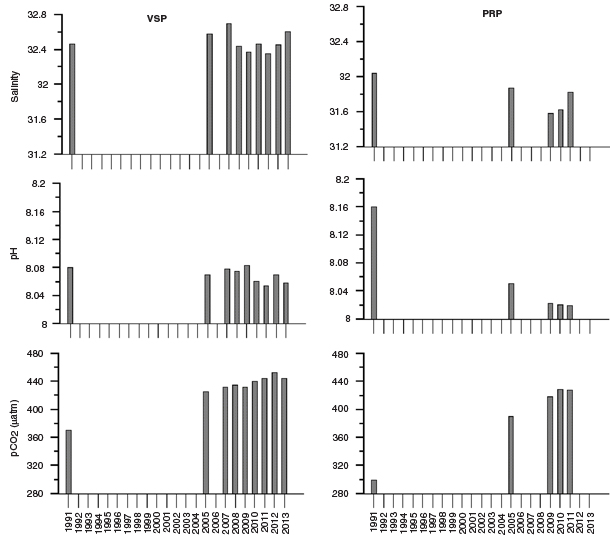
To examine the long-term trends in pCO2 in the coastal Bay of Bengal, two sets of time-series data were analysed. Since 2007, systematic monthly observations have been made in the southwest coastal Bay of Bengal (off Visakhapatnam, henceforth called VSP) and the northwestern coastal Bay of Bengal (off Paradip, henceforth called PRP) between 2007 and 2013 (Fig. 1). In addition, samples were collected at 10 stations along the coastal Bay of Bengal during December 2004–January 2005 as part of the Bay of Bengal Process Studies (Sardessai et al., 2010) that included observations at the VSP and PRP time-series locations. Variations in mean (February–March) salinity, pH and pCO2 at VSP and PRP are plotted in Fig. 6. During the time-series observations, the surface salinity increased from 32.36 to 32.69 at VSP and 31.58 to 31.87 at PRP while the pH of the surface waters decreased by 0.012 at VSP and 0.031 units at PRP. At the same time, pCO2 increased from 426 μatm to 453 μatm at VSP and from 388 μatm to 429 μatm at PRP. The pH decreased at a rate of 0.0015 units y−1 at VSP (2005–2013) and at a higher rate of 0.005 units y−1 at PRP (2009–2011), while the pCO2 increased by 2.2 μatm y−1 at VSP and 5.4 μatm y−1 at PRP over the same time periods. Though the rates of change in pH and pCO2 in the recent years are slightly different from that of long-term trends (1991–2011), trends in both parameters change at higher rates in the northwest compared to the southwest coastal region (Table 1). These trends further suggest that the decrease in pH and increase in pCO2 in the recent years were not due to inter-annual variations between 1991 and 2011. Therefore, the recent changes in the inorganic carbon system likely result from the enhanced aerosol loading over the northern Bay of Bengal.
Fig 6.
Time-series variations mean (February–March) salinity, pH and pCO2 (μatm) at time-series stations off Visakhapatnam (VSP; left panel) and Paradip (PRP; right panel).
Several studies were carried out in 2006 to examine the chemical composition of aerosols and its impact on coastal ecosystem in the northern Indian Ocean. These experiments were conducted in winter (December–February) and spring (March–April), when surface winds are predominantly northwesterly (from Indo-Gangetic Plain) and northeasterly (from south-east Asia) that favour the continental outflow to the marine atmospheric boundary layer, transporting aerosols from land to sea (Srinivas et al., 2011). The continental outflow of aerosols during the dry period has a significant impact on the decrease in radiative forcing over the Bay of Bengal (Jayaraman et al., 1998; Ramanathan et al., 2001; Satheesh, 2002), and studies on the chemical characteristics of aerosols over the Bay of Bengal demonstrated significant anthropogenic sources (Lelieveld et al., 2001; Kumar et al., 2008a, 2008b; Sudheer and Sarin, 2008). The sea-salt corrected component of SO4 (nss-SO4) was higher in the marine atmosphere boundary layer over the Bay of Bengal (2.5–10.2 μg m−3, mean: 5.7 μg m−3; constituting 92% of total SO4) than over the Arabian Sea (1.3–5.7 μg m−3, mean: 2.9 μg m−3; constituting 86% of total SO4; Kumar et al., 2008a). The relatively higher abundance of nss-SO4 over the Bay of Bengal suggests the greater influence of anthropogenic sources over aerosol loading. Similarly higher concentrations of soluble reactive nitrogen (organic +inorganic) were observed over the northwest coastal Bay of Bengal than over the southwest coastal Bay of Bengal (Srinivas et al., 2011). These studies indicate that high loads of sulphate and nitrogen aerosols were delivered to the northwest Bay of Bengal during winter and spring seasons. The increasing trend in AOD over the northwestern coastal Bay of Bengal further indicates that this region received high pollutants (Zhang and Reid, 2010). Although the long-term trend in the composition of aerosols is unknown in this region due to the lack of time-series observations, it is possible that an increase in such fluxes result from increased industrialisation and fertiliser use in this part of world (UNEP, 2008). The consumption rate of nitrogen and phosphorus fertilisers in India more than doubled, from 8000 and 3700 Mt (metric tons) y−1, respectively, to 17 000 and 8000 Mty−1, respectively, from 1991 to 2011with the greatest increase in fertiliser use occurring during the most recent decade (Fertilizer Association of India; www.faidelhi.org). The increased fertiliser consumption on the Indian sub-continent may increase ammonia in the atmosphere through saltation of soil from agricultural fields and its deposition on sea surface waters triggers nitrification that can lead to a decrease in pH (Doney et al., 2007). Therefore, this study suggests that increased fluxes of sulphate and nitrogen aerosols over the northwestern coastal Bay of Bengal lead to a decrease in the pH of the surface waters in the region, driving the inorganic carbon system towards the formation of pCO2.
The pCO2 levels in the coastal Bay of Bengal were, in general, greater than the atmospheric value of ~391 μatm and significantly higher in the northwestern region while undersaturated in the southwestern Bay of Bengal. The fluxes of CO2 to the atmosphere in 2011 ranged from −3.1 to 7.0 (mean 1.3) mmol C m−2 d−1, which were significantly higher than the 1991 fluxes of −4.6–3.0 (mean −1.6) mmol C m−2 d−1 (Kumar et al., 1996). The difference in fluxes between 1991 and 2011 did not result from variations in wind speeds, as the difference was <0.5 m/s during these two periods (Praveen Kumar et al., 2012). The decrease of pH in surface waters due to aerosol loading changes the pCO2 flux from sink to source during non-monsoon periods. On the other hand, Sarma et al. (2012) estimated that the sea-to-air fluxes of CO2 during the SW monsoon season (peak discharge period) to be −13.8–18.8 (mean 0.2) mmol C m−2 d−1 in the coastal Bay of Bengal. This study, thus, suggests that the northwest coastal Bay of Bengal is changed to a perennial source of atmospheric CO2 due to the increased air pollution. The further impacts on the ecosystem are to be investigated in the future.
Conclusion
4.
The present study evaluated the recent (2011) decrease in pH and increase in pCO2 levels along the coastal Bay of Bengal, as compared to 1991 levels. The rates of change in the inorganic carbon components in the southwest coastal Bay of Bengal were similar to those reported elsewhere in the world (Astor et al., 2013; Church et al., 2013). In contrast, a significantly higher increase in pCO2 (by an order of magnitude) was observed in the northwest coastal Bay of Bengal in 2011 and was closely associated with recent increases in sulphate and nitrogen aerosol loadings in this region during winter and spring, leading to the decrease in the pH of surface waters. These changes were also associated with recent increases in satellite-derived AOD and decreases in AT and SST. The corresponding observed changes in AT and SST from 2001–2012 to 1982–1991 are at a maximum in January (−0.5°C) and February (−0.6°C). Our study shows the recent increases in aerosol loading over northwestern Bay of Bengal enhanced coastal acidity and transformed this region from a sink of atmospheric CO2 to a source. These changes would have significant impacts on ecosystem functioning in this sensitive region, which requires more careful evaluation in future studies.
5. Acknowledgements
We thank the Director, CSIR-NIO, for his encouragement and support. The technical support provided by ship's officers of RV Sindhu Sankalp, ship cell personnel and Mr. NSN Raju, Chief Scientist, of Leg 2 of SSK-12 are highly appreciated. We highly appreciate Dr. M. Dileep Kumar for providing hydrographic and inorganic carbon data collected during 1991. We would like to thank Mr. I. Naveen Kumar for the collection of samples at off Paradip. We would like to thank the anonymous reviewer and editor for their constructive comments to improve the clarity of the manuscript. This has NIO contribution number 5694.