
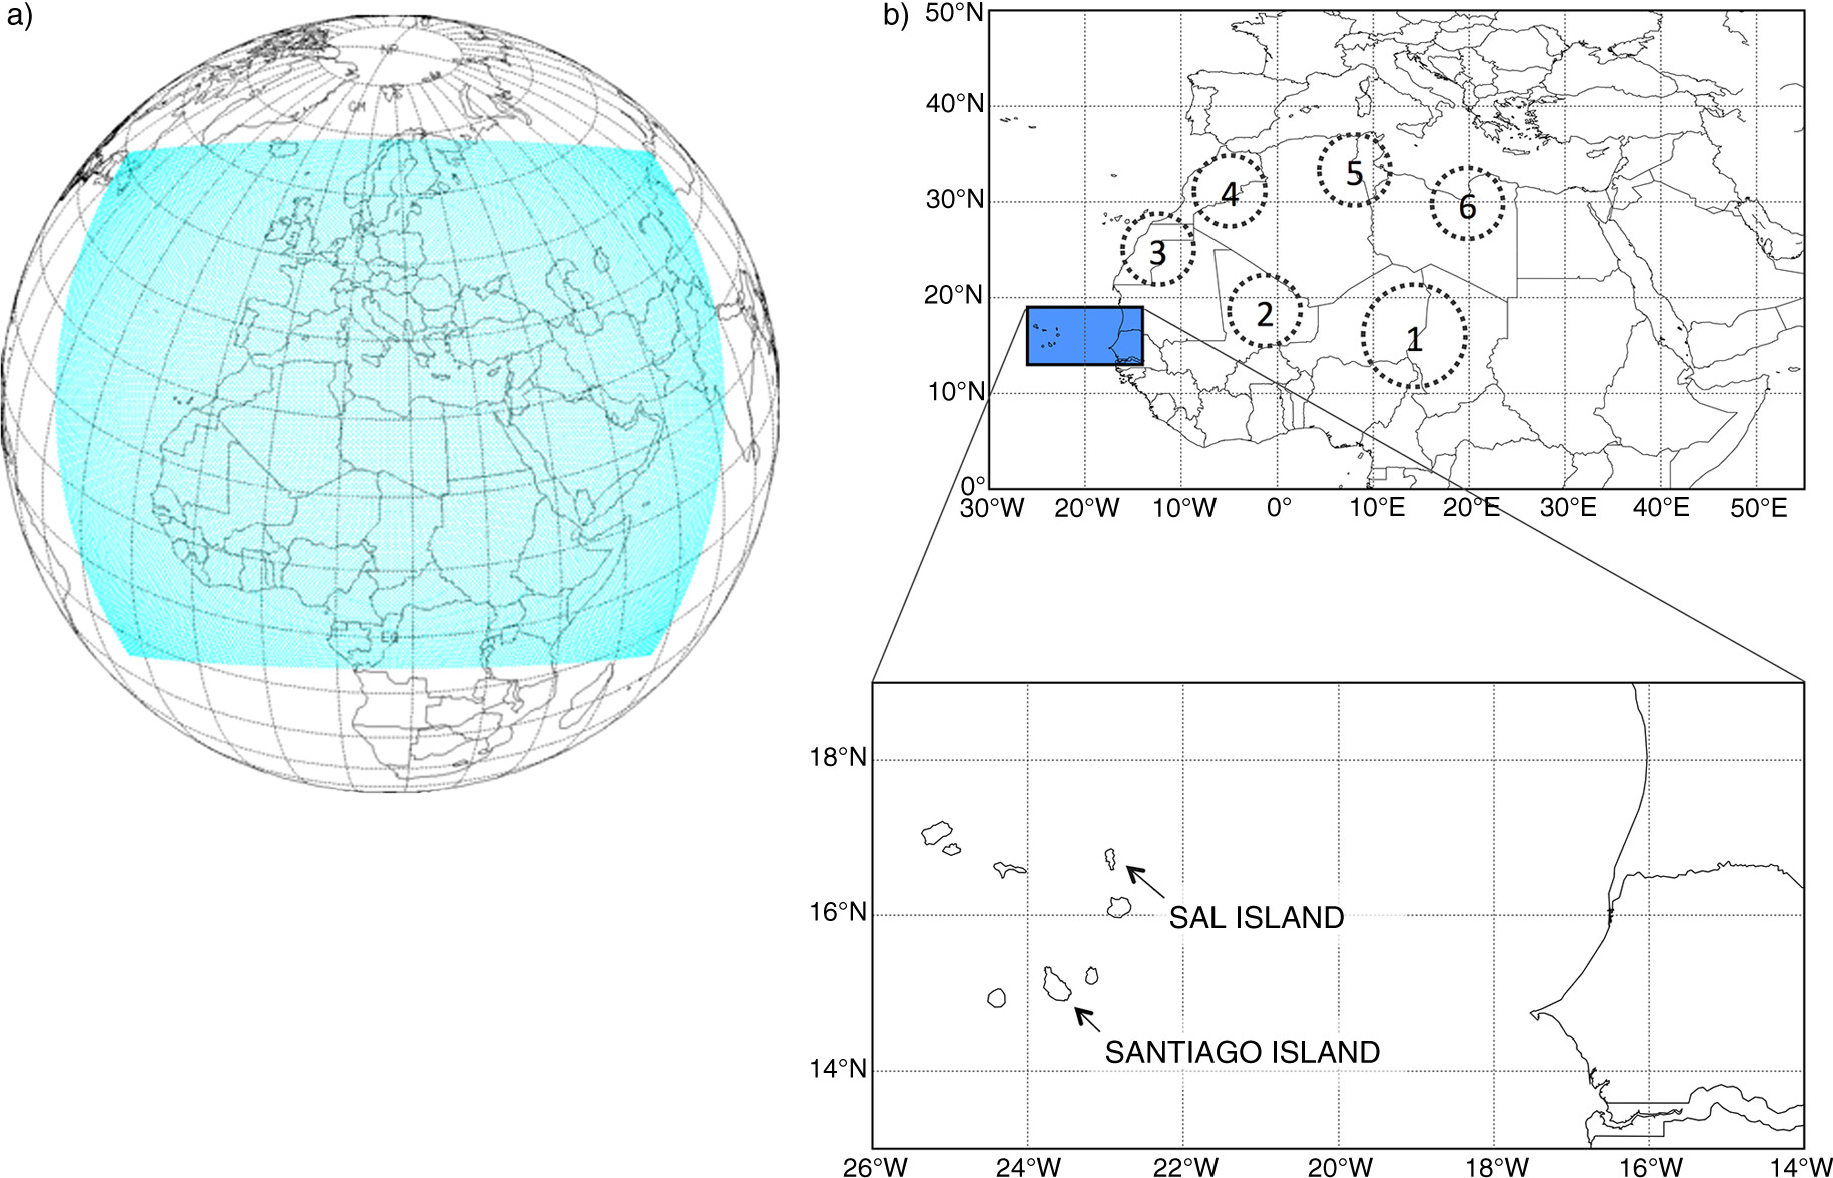
Fig. 1
(a) Model simulation domain and (b) location of the measurement points Praia (Santiago Island) and Espargos (Sal Island) in Cape Verde. In the map, the dotted circles indicate dust emission source areas: (1) Bodélé, (2) Algeria–Mali, (3) West Sahara–Mauritania, (4) Algeria–Morocco, (5) Algeria–Tunisia and (6) Libya Desert.

Fig. 2
(Top) Measured and modelled PM10 and PM2.5 hourly concentrations in Praia, Cape Verde, and (bottom) monthly analysis of the same datasets. The bottom and top of the box represent the first and third quartiles and the band inside the box represents the median. The ends of the whiskers represent the 10th and the 90th percentiles. White diamonds represent the mean value. Outliers are not shown.
Table 1. Statistical parameters computed for daily average surface concentrations
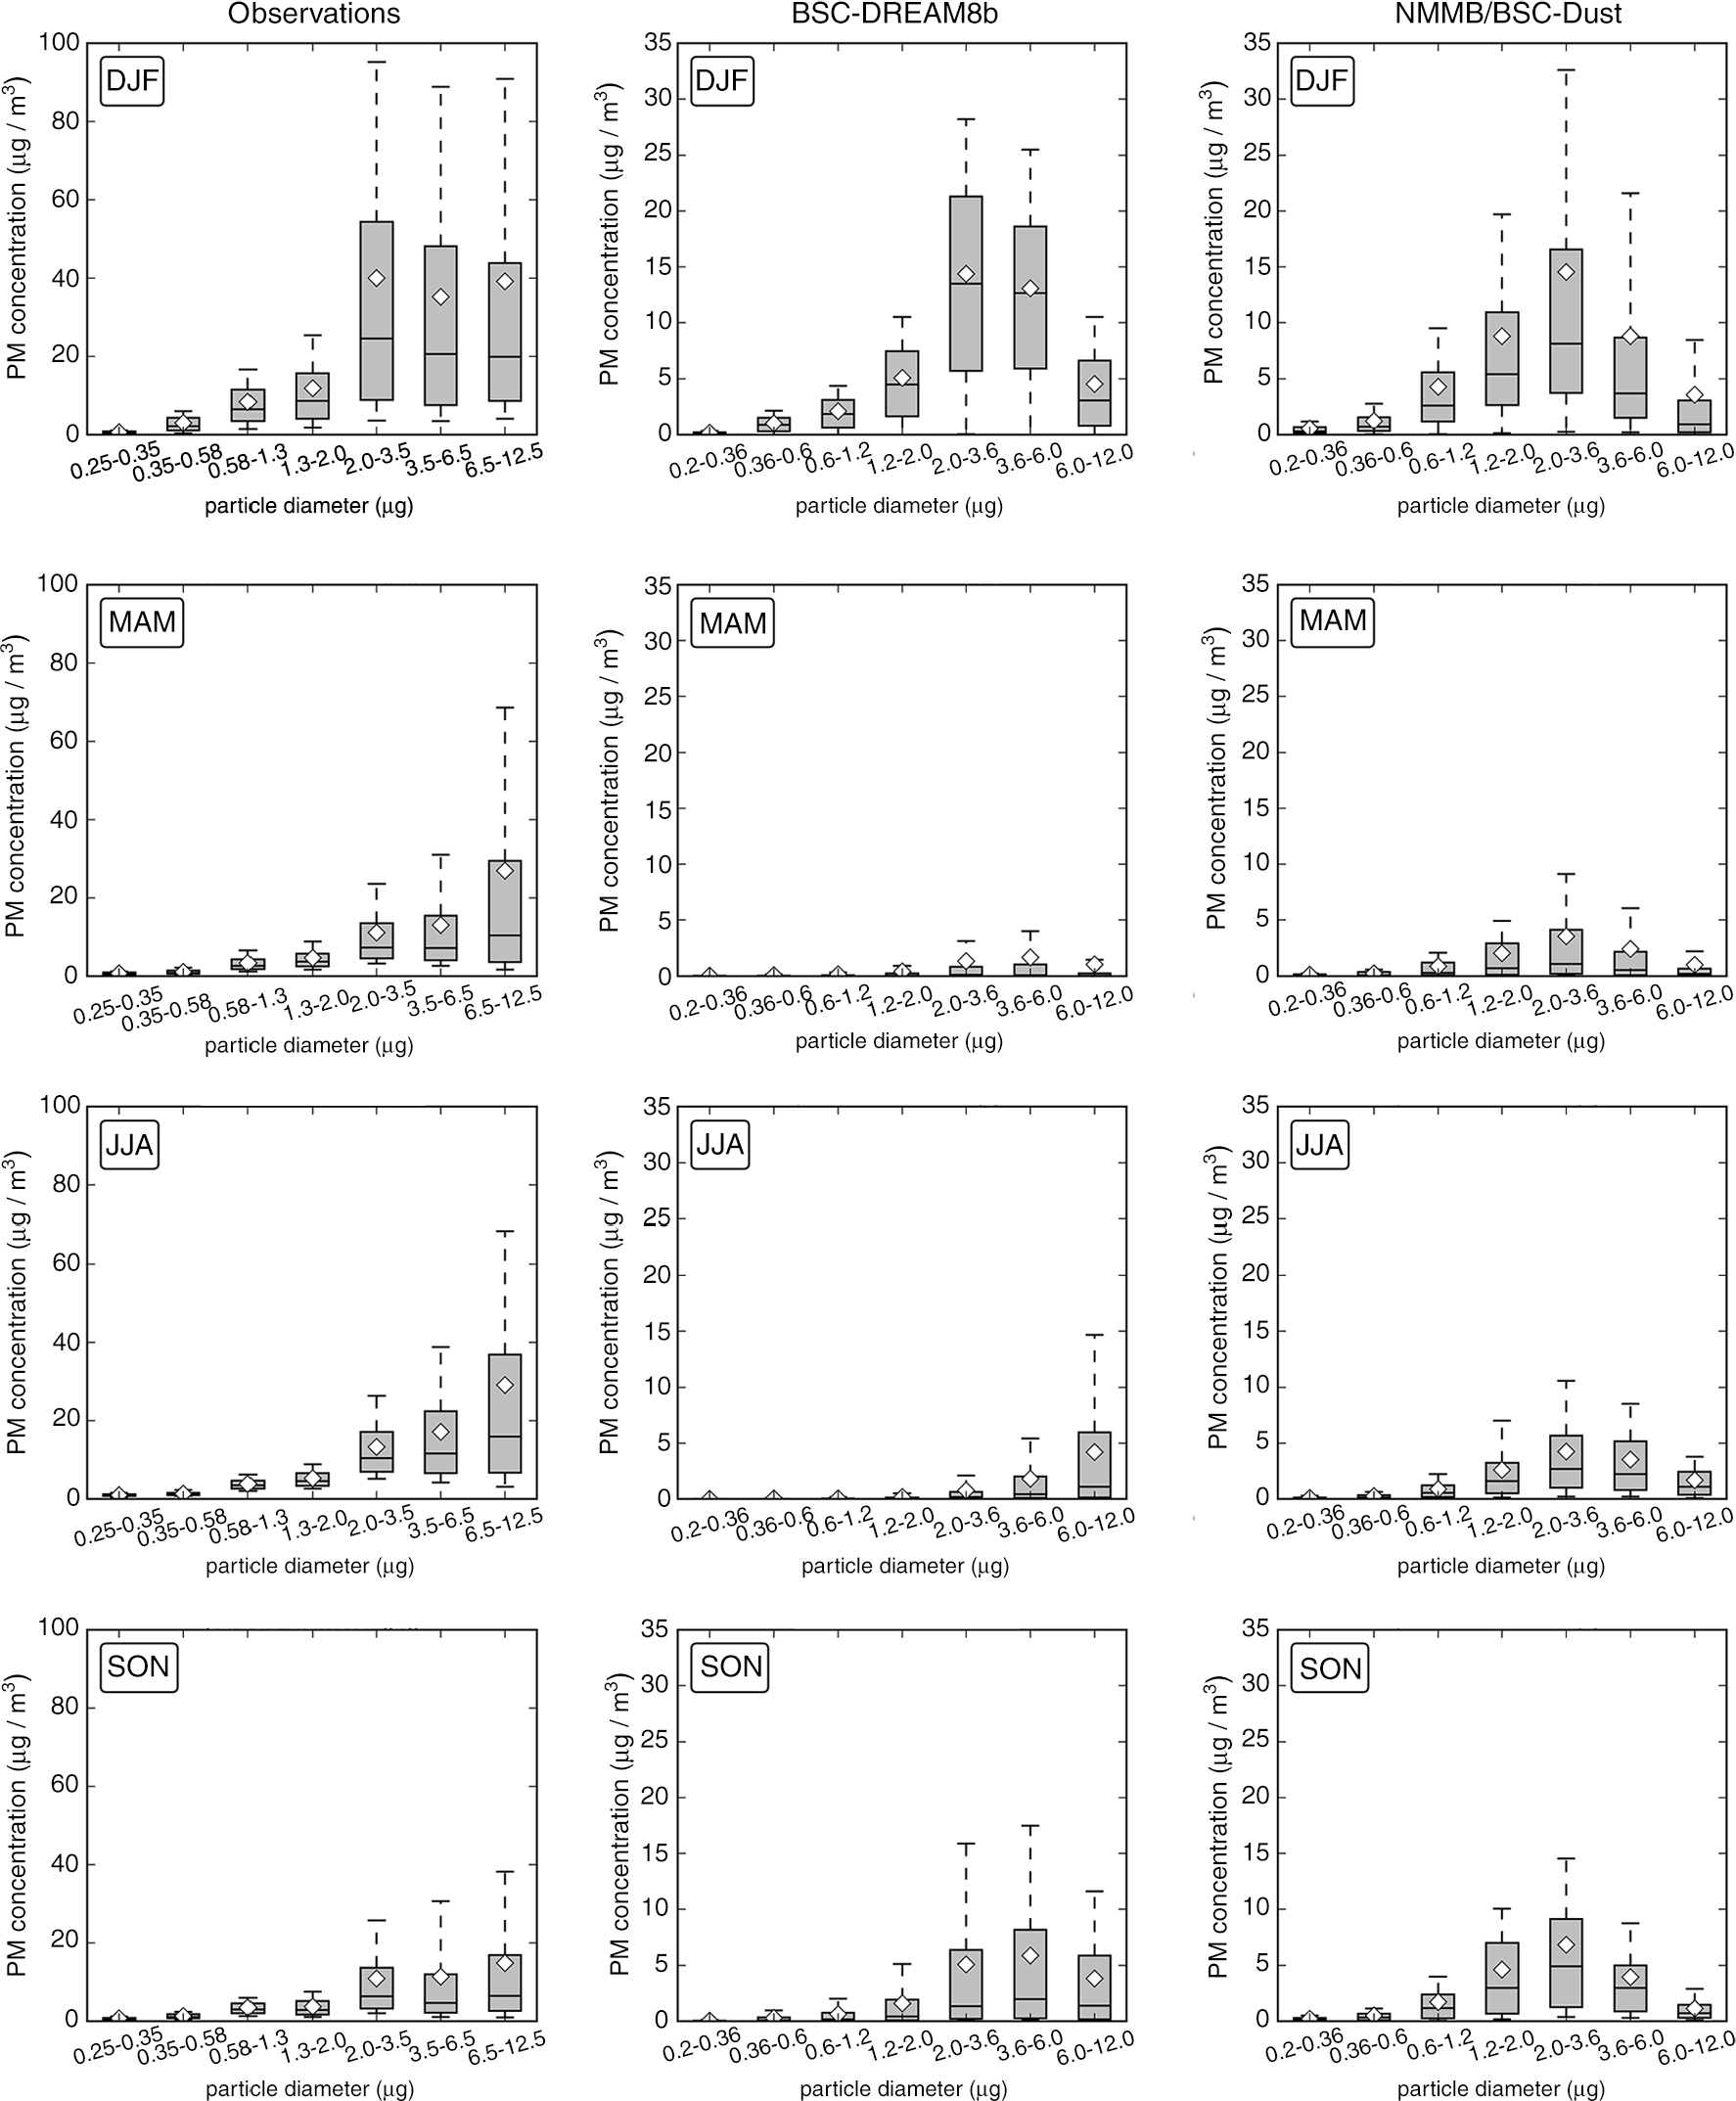
Fig. 3
Seasonal analysis of the observed (left panels) and modelled (centre and right panels) size distribution surface PM concentrations, for Praia, Cape Verde, 2011. DJF corresponds to December, January and February, MAM to March, April and May, JJA to June, July and August and SON to September, October and November. The bottom and top of the box represent the first and third quartiles and the band inside the box represents the median. The ends of the whiskers represent the 10th and the 90th percentiles. White diamonds represent the mean value. Outliers are not shown.
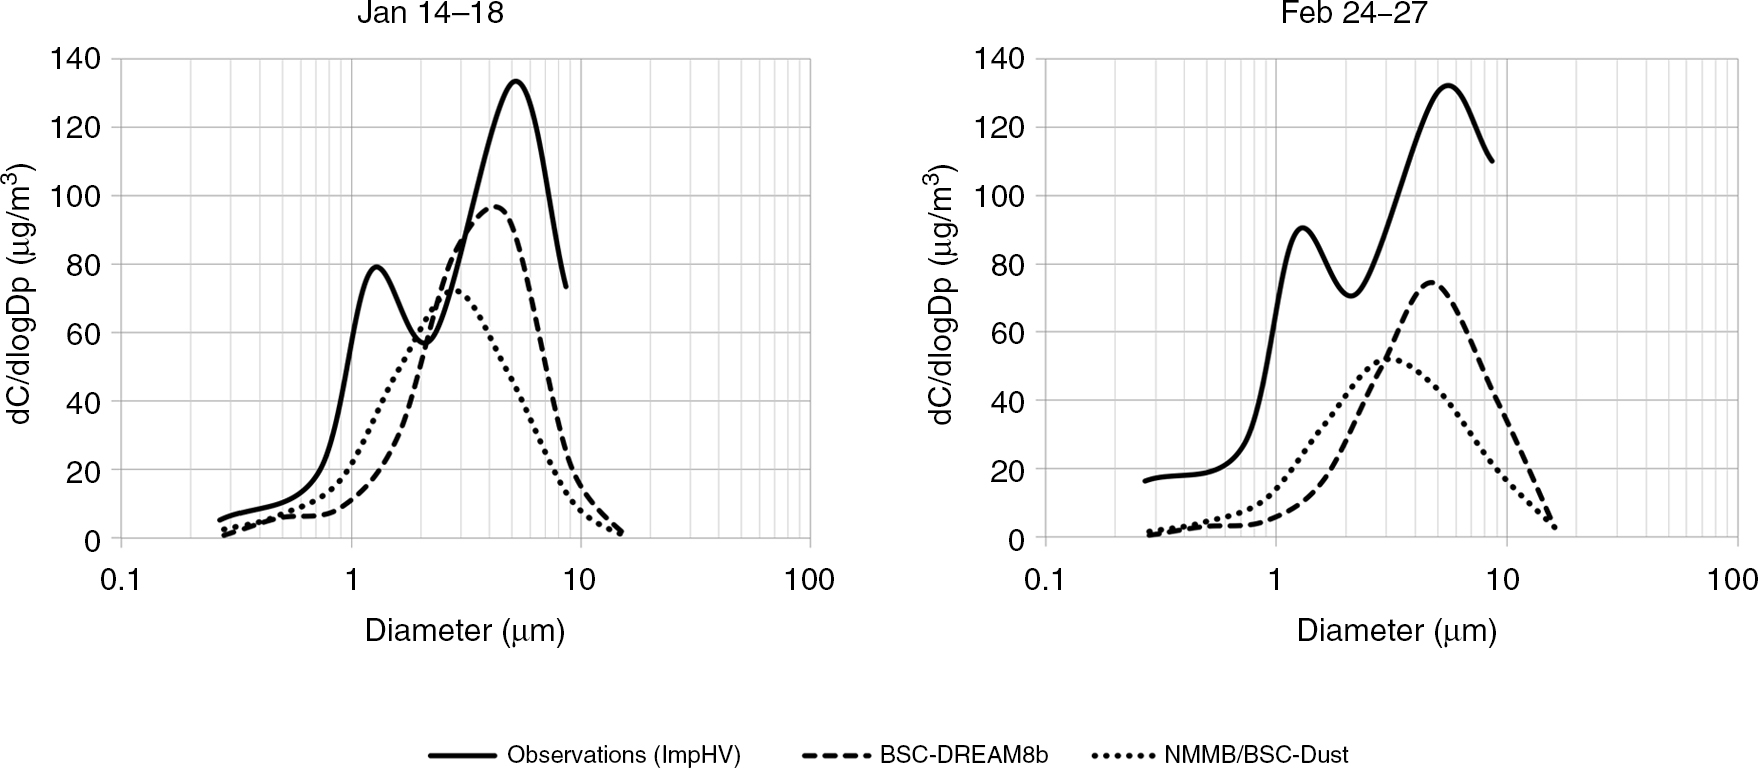
Fig. 4
PM measured and modelled size distribution for (left) Jan 14–18 and (right) Feb 24–27.
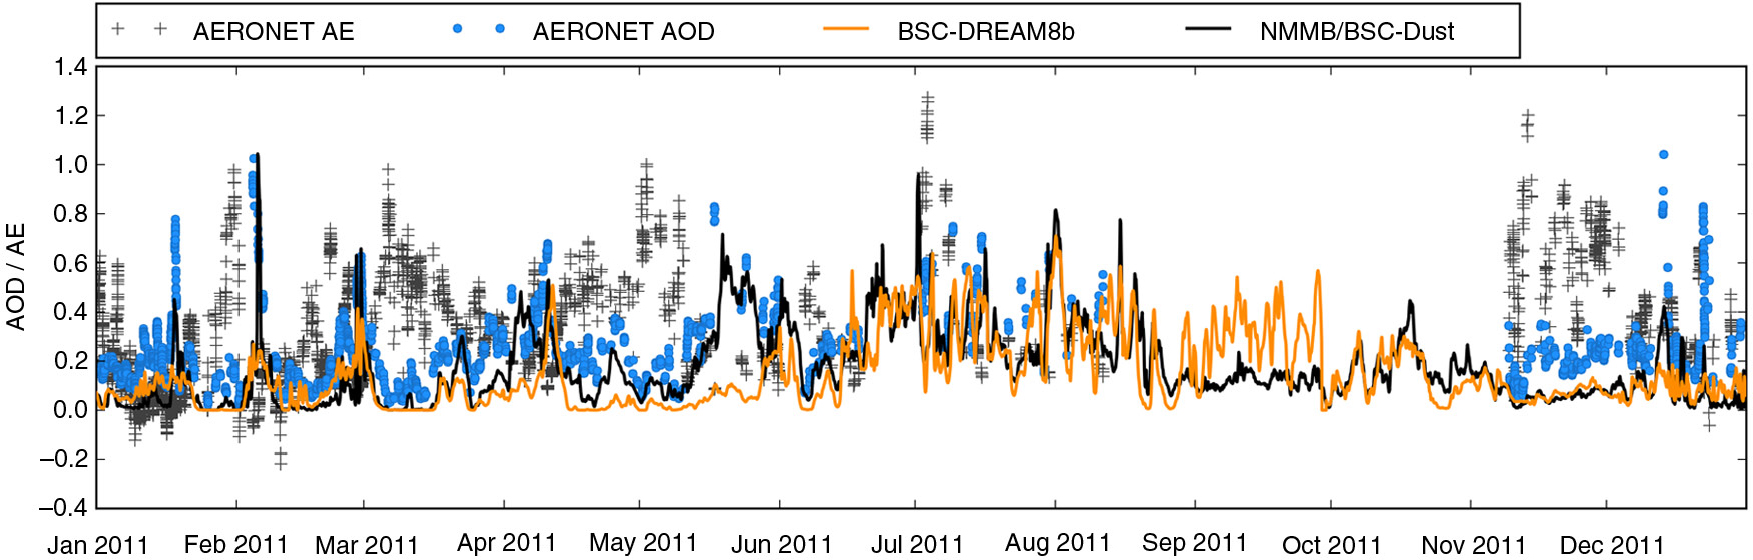
Fig. 5
Measured and modelled aerosol optical depth (AOD at 550 nm) and Ångström Exponent (AE; calculated between 440 and 870 nm) in Espargos, Cape Verde.
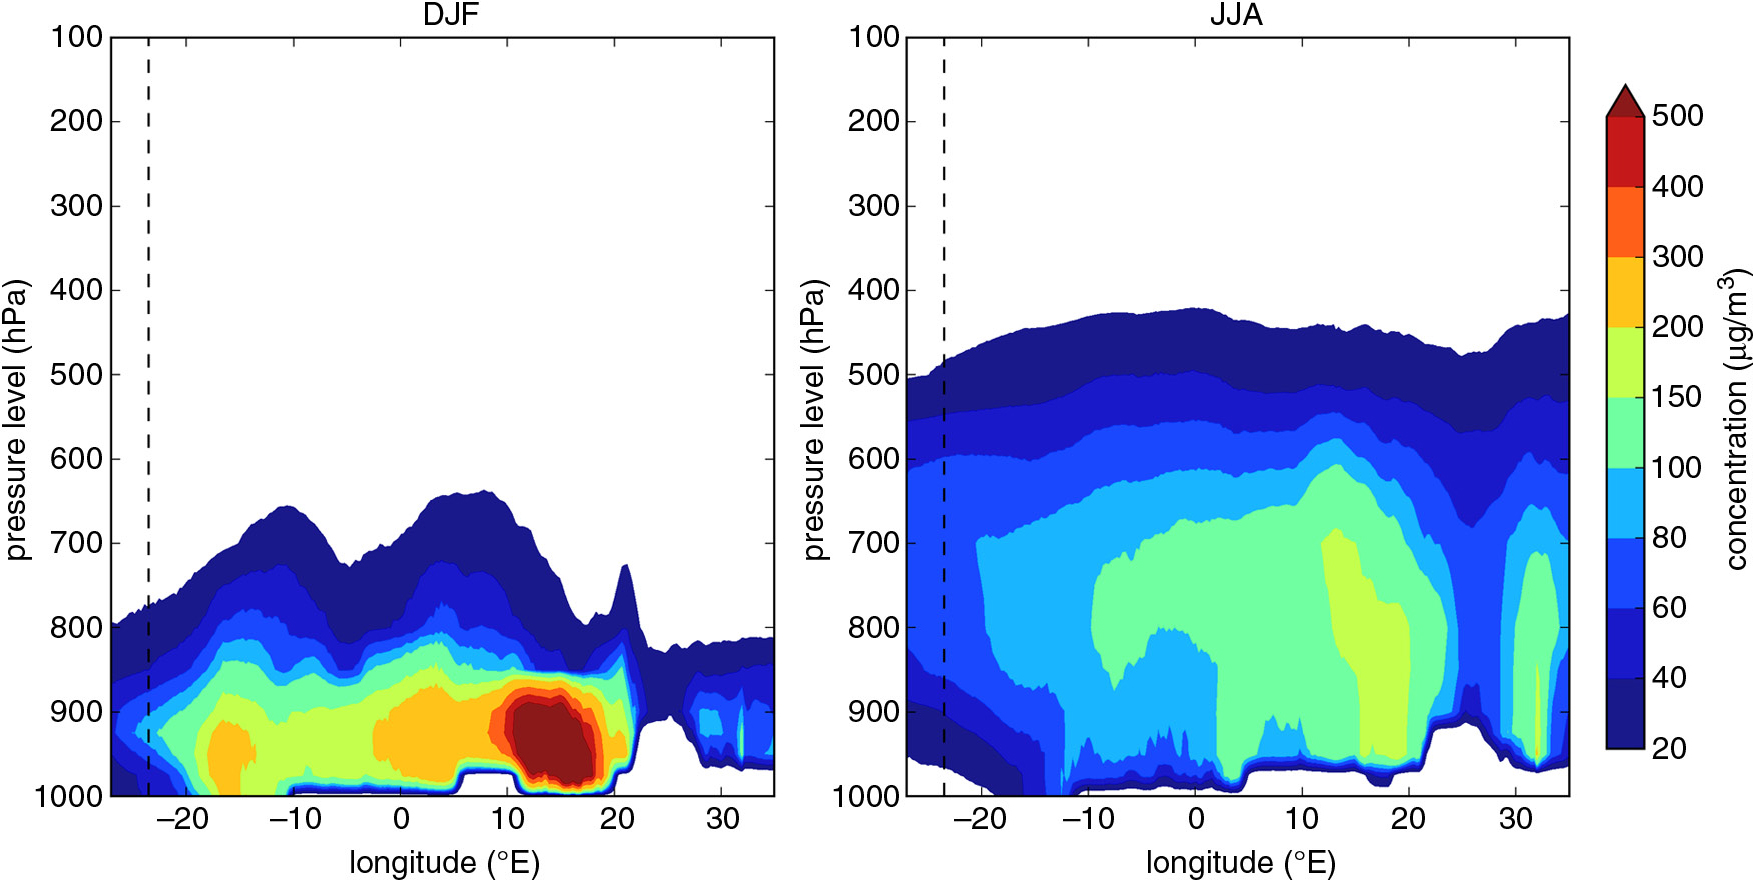
Fig. 6
Vertical distribution of desert dust concentrations at a fixed latitude of 15°N, for (left) average winter (December, January and February) and (right) average summer (June, July and August), modelled with NMMB/BSC-Dust. The dashed line represents the longitude of Cape Verde.
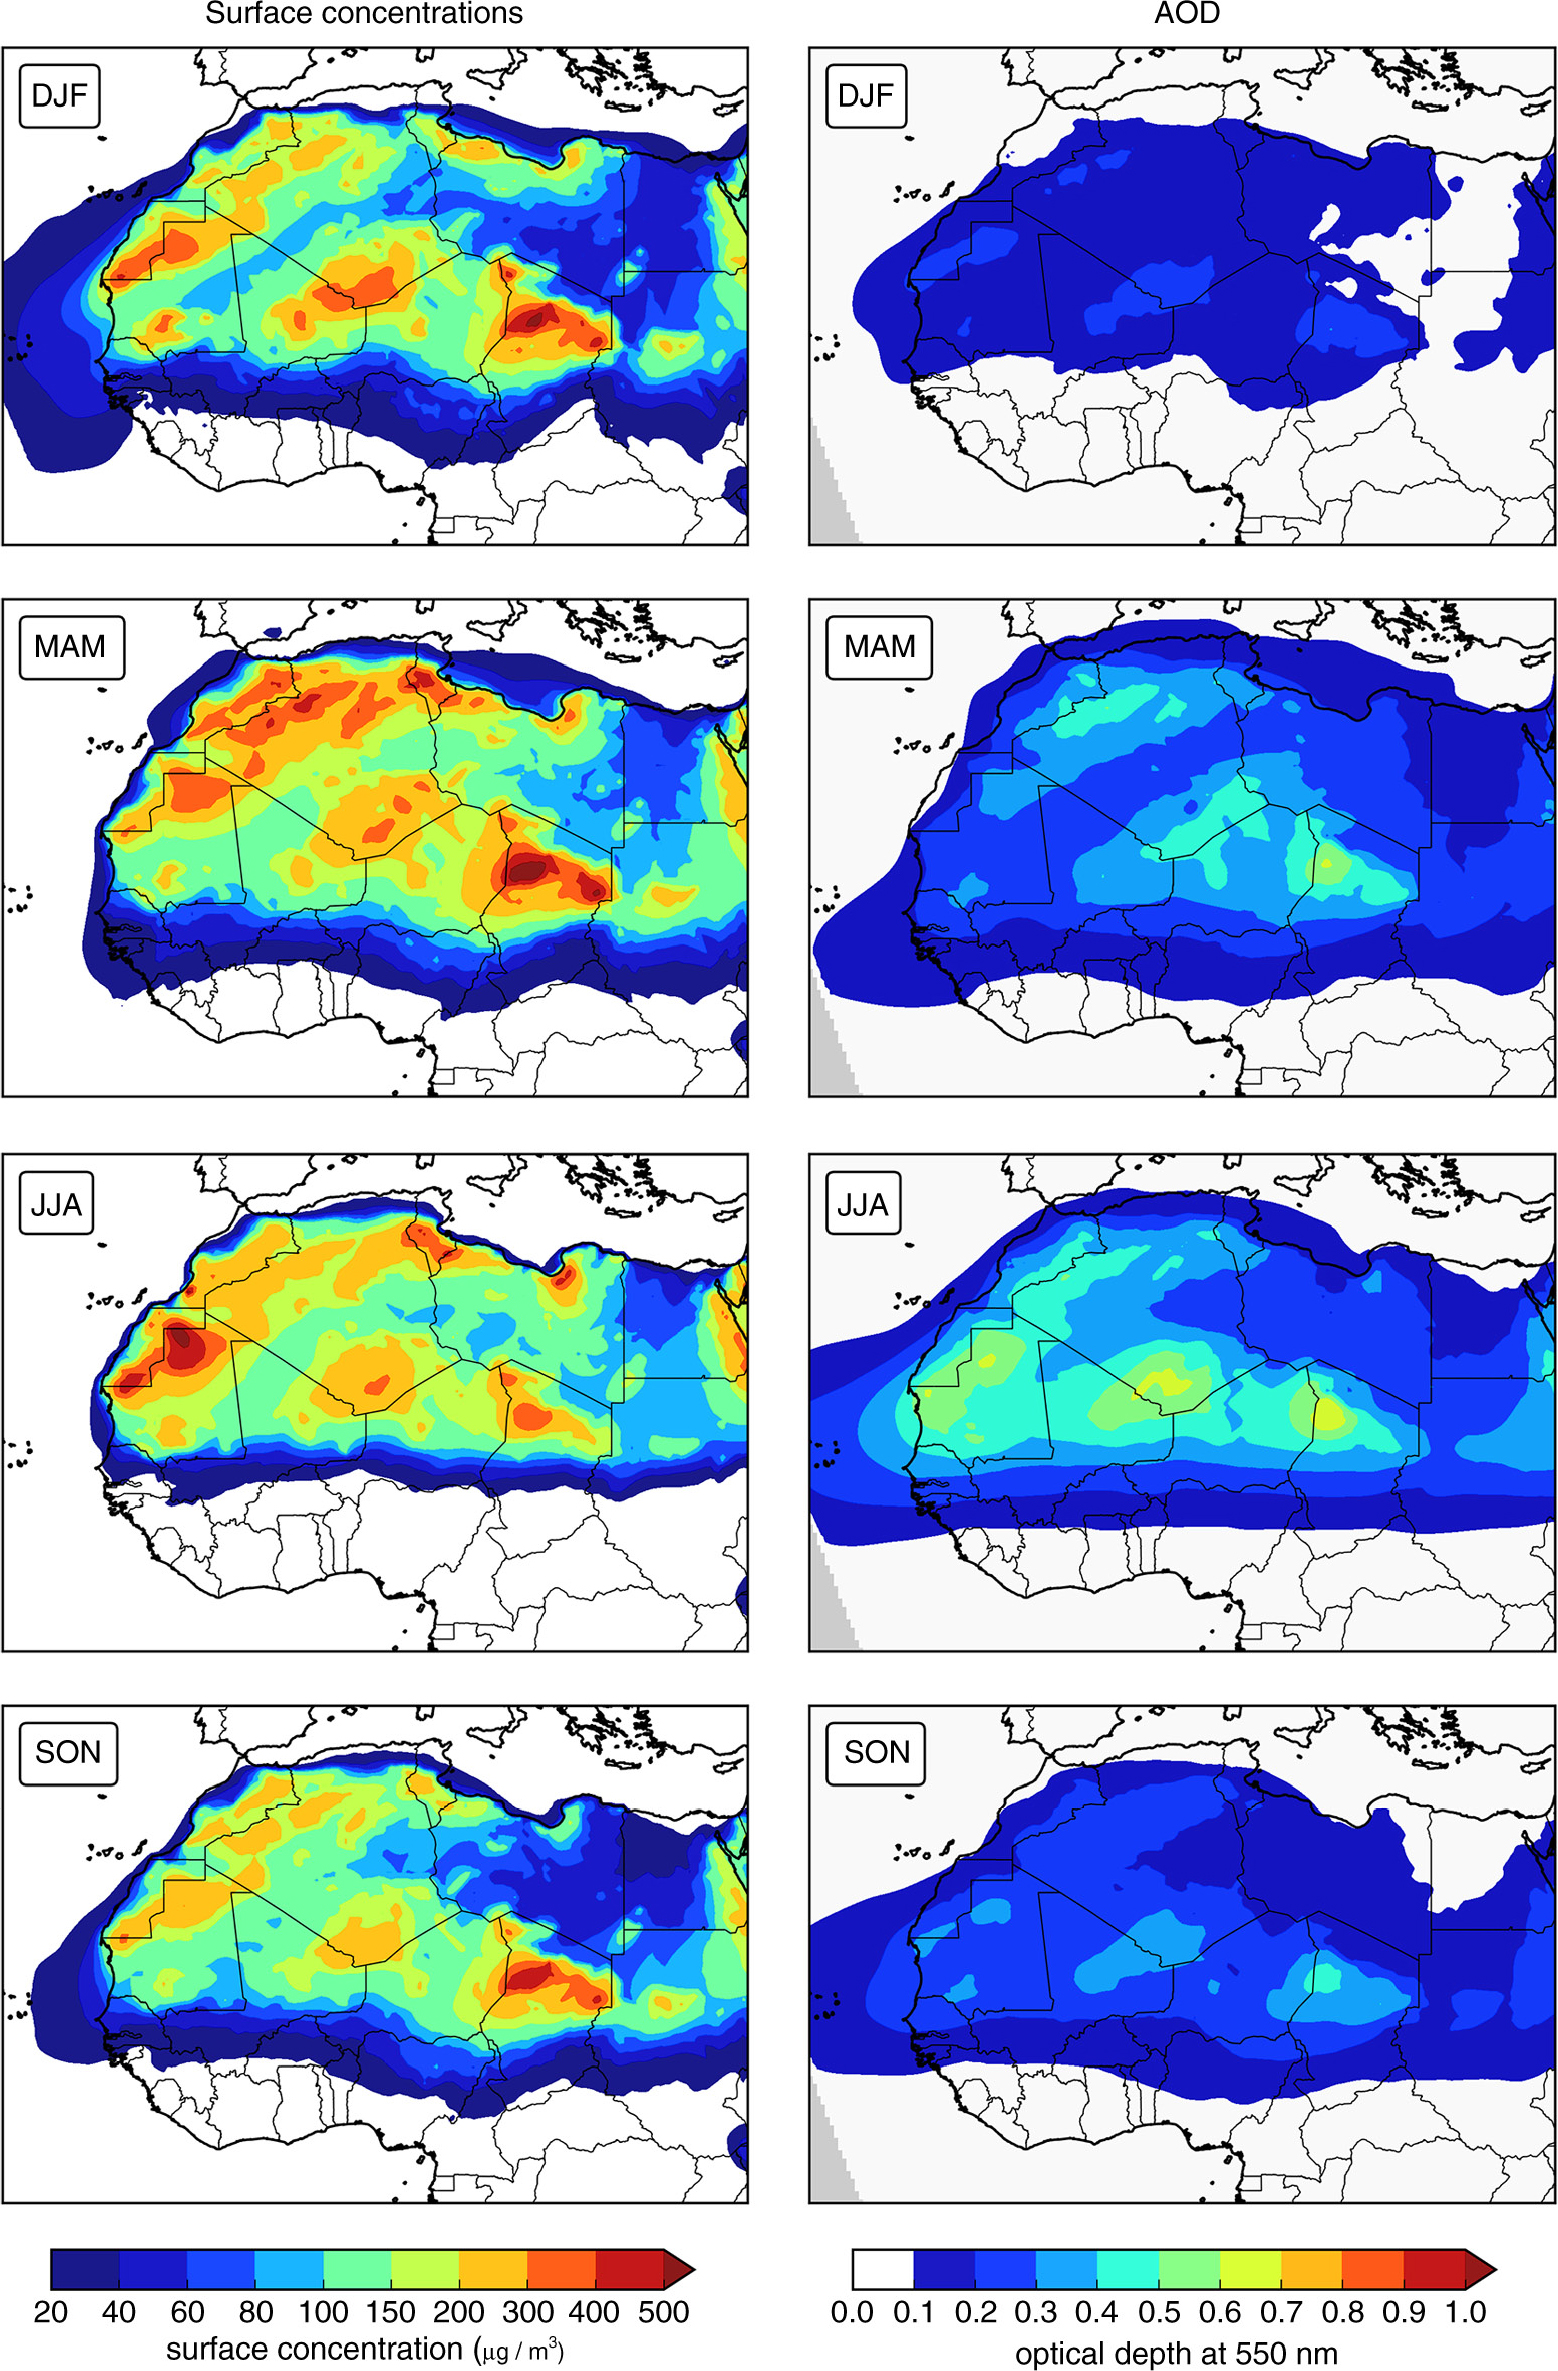
Fig. 7
Seasonal average of desert dust surface concentrations (left panels) and dust optical depth (right panels), for 2011, modelled with BSC-DREAM8b. DJF corresponds to December, January and February, MAM to March, April and May, JJA to June, July and August and SON to September, October and November.
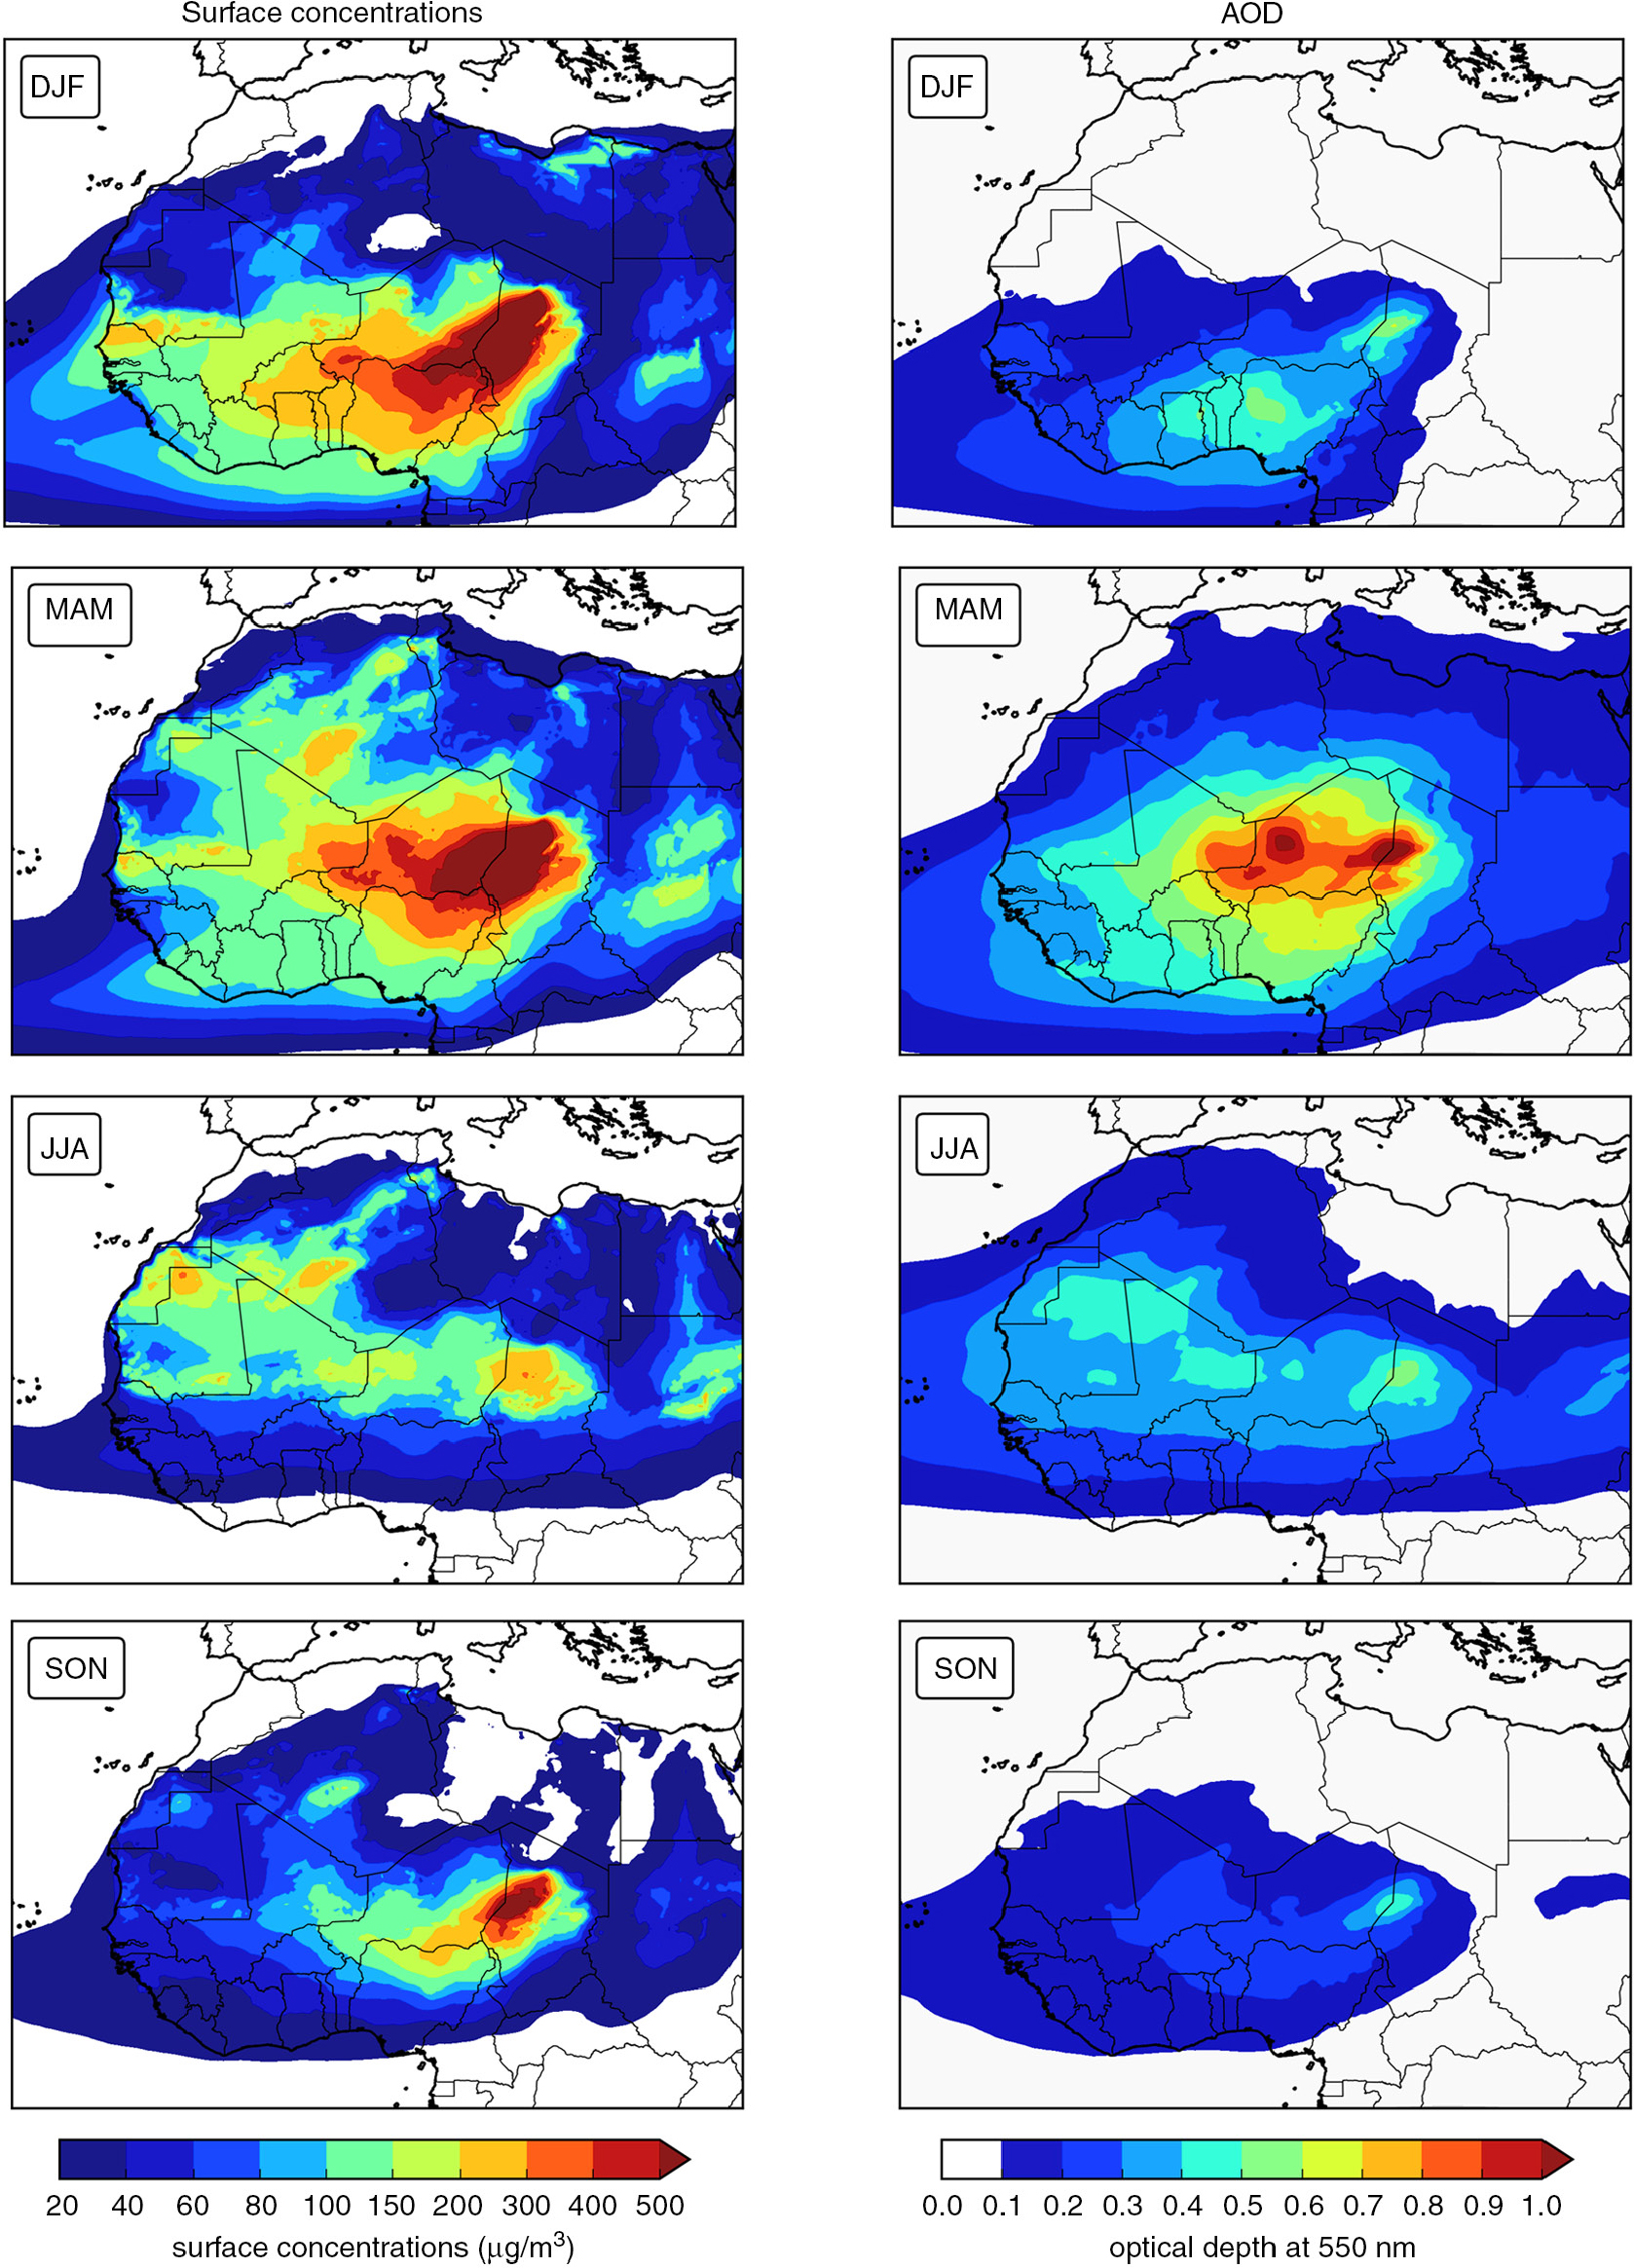
Fig. 8
Seasonal average of desert dust surface concentrations (left panels) and dust optical depth (right panels), for 2011, modelled with NMMB/BSC-Dust. DJF corresponds to December, January and February, MAM to March, April and May, JJA to June, July and August and SON to September, October and November.
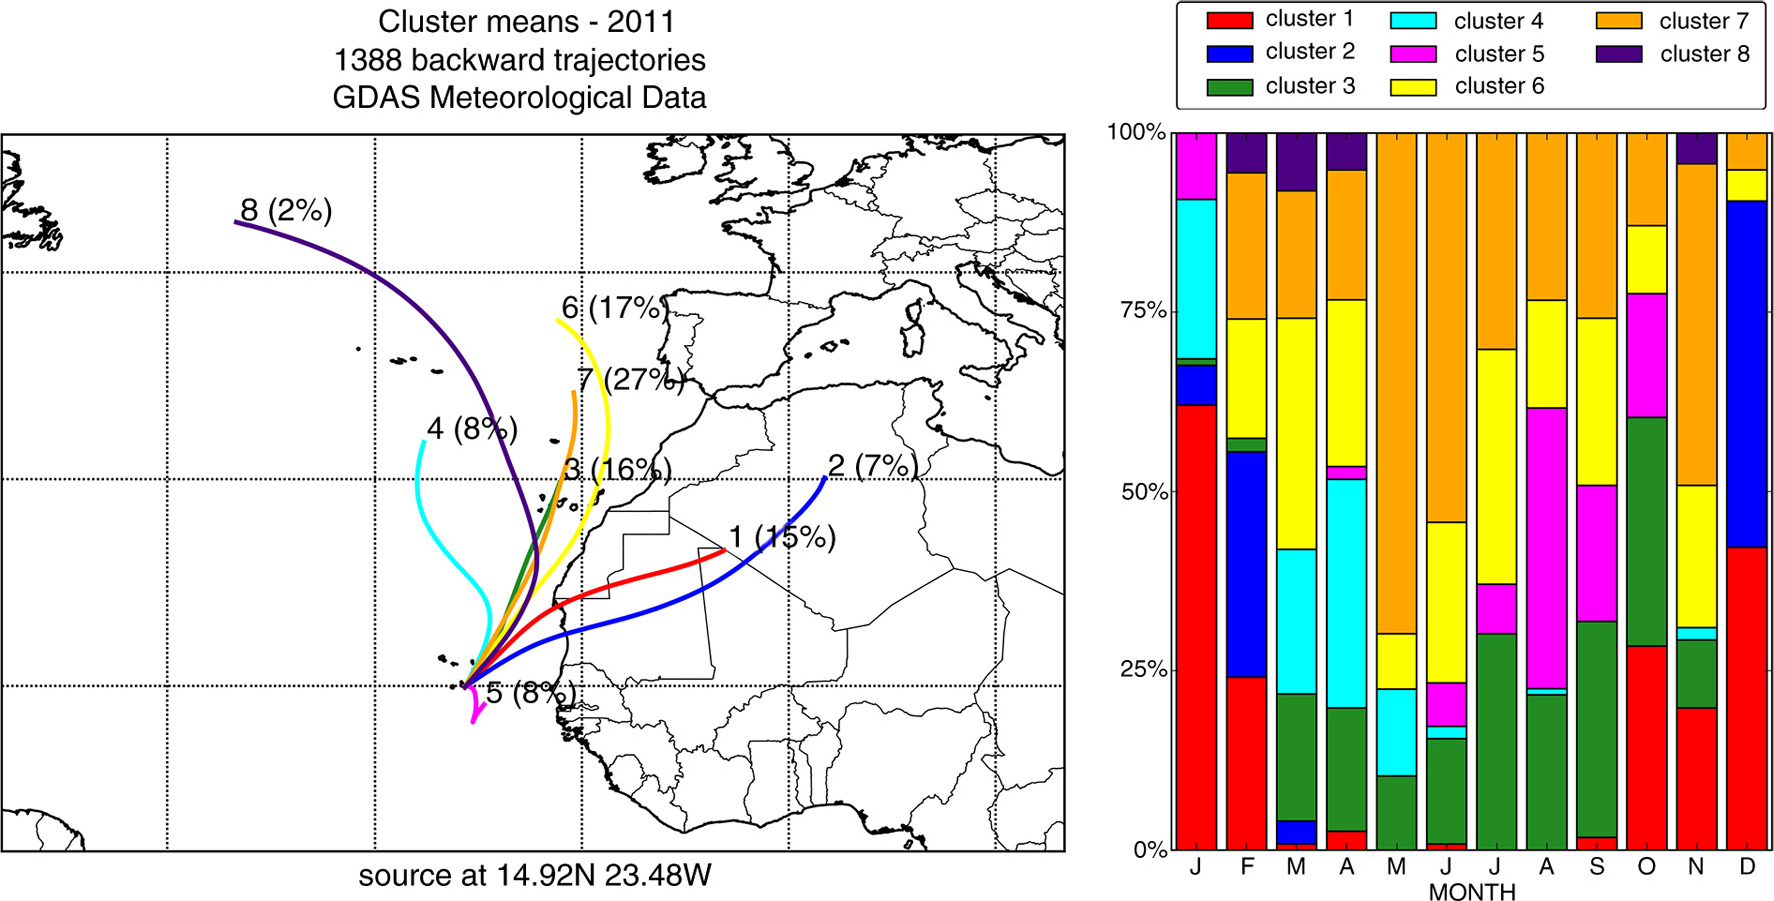
Fig. 9
(Left) Ninety-six-hour average back-trajectories for the eight clusters at Praia, Santiago Island (latitude: 14.92 N, longitude: 23.48 W), for 2011, with starting height at 250 m above sea level (percentages in parentheses reflect percentage of total 6-hour periods contributing to the averaged trajectory), and (right) their monthly distribution.
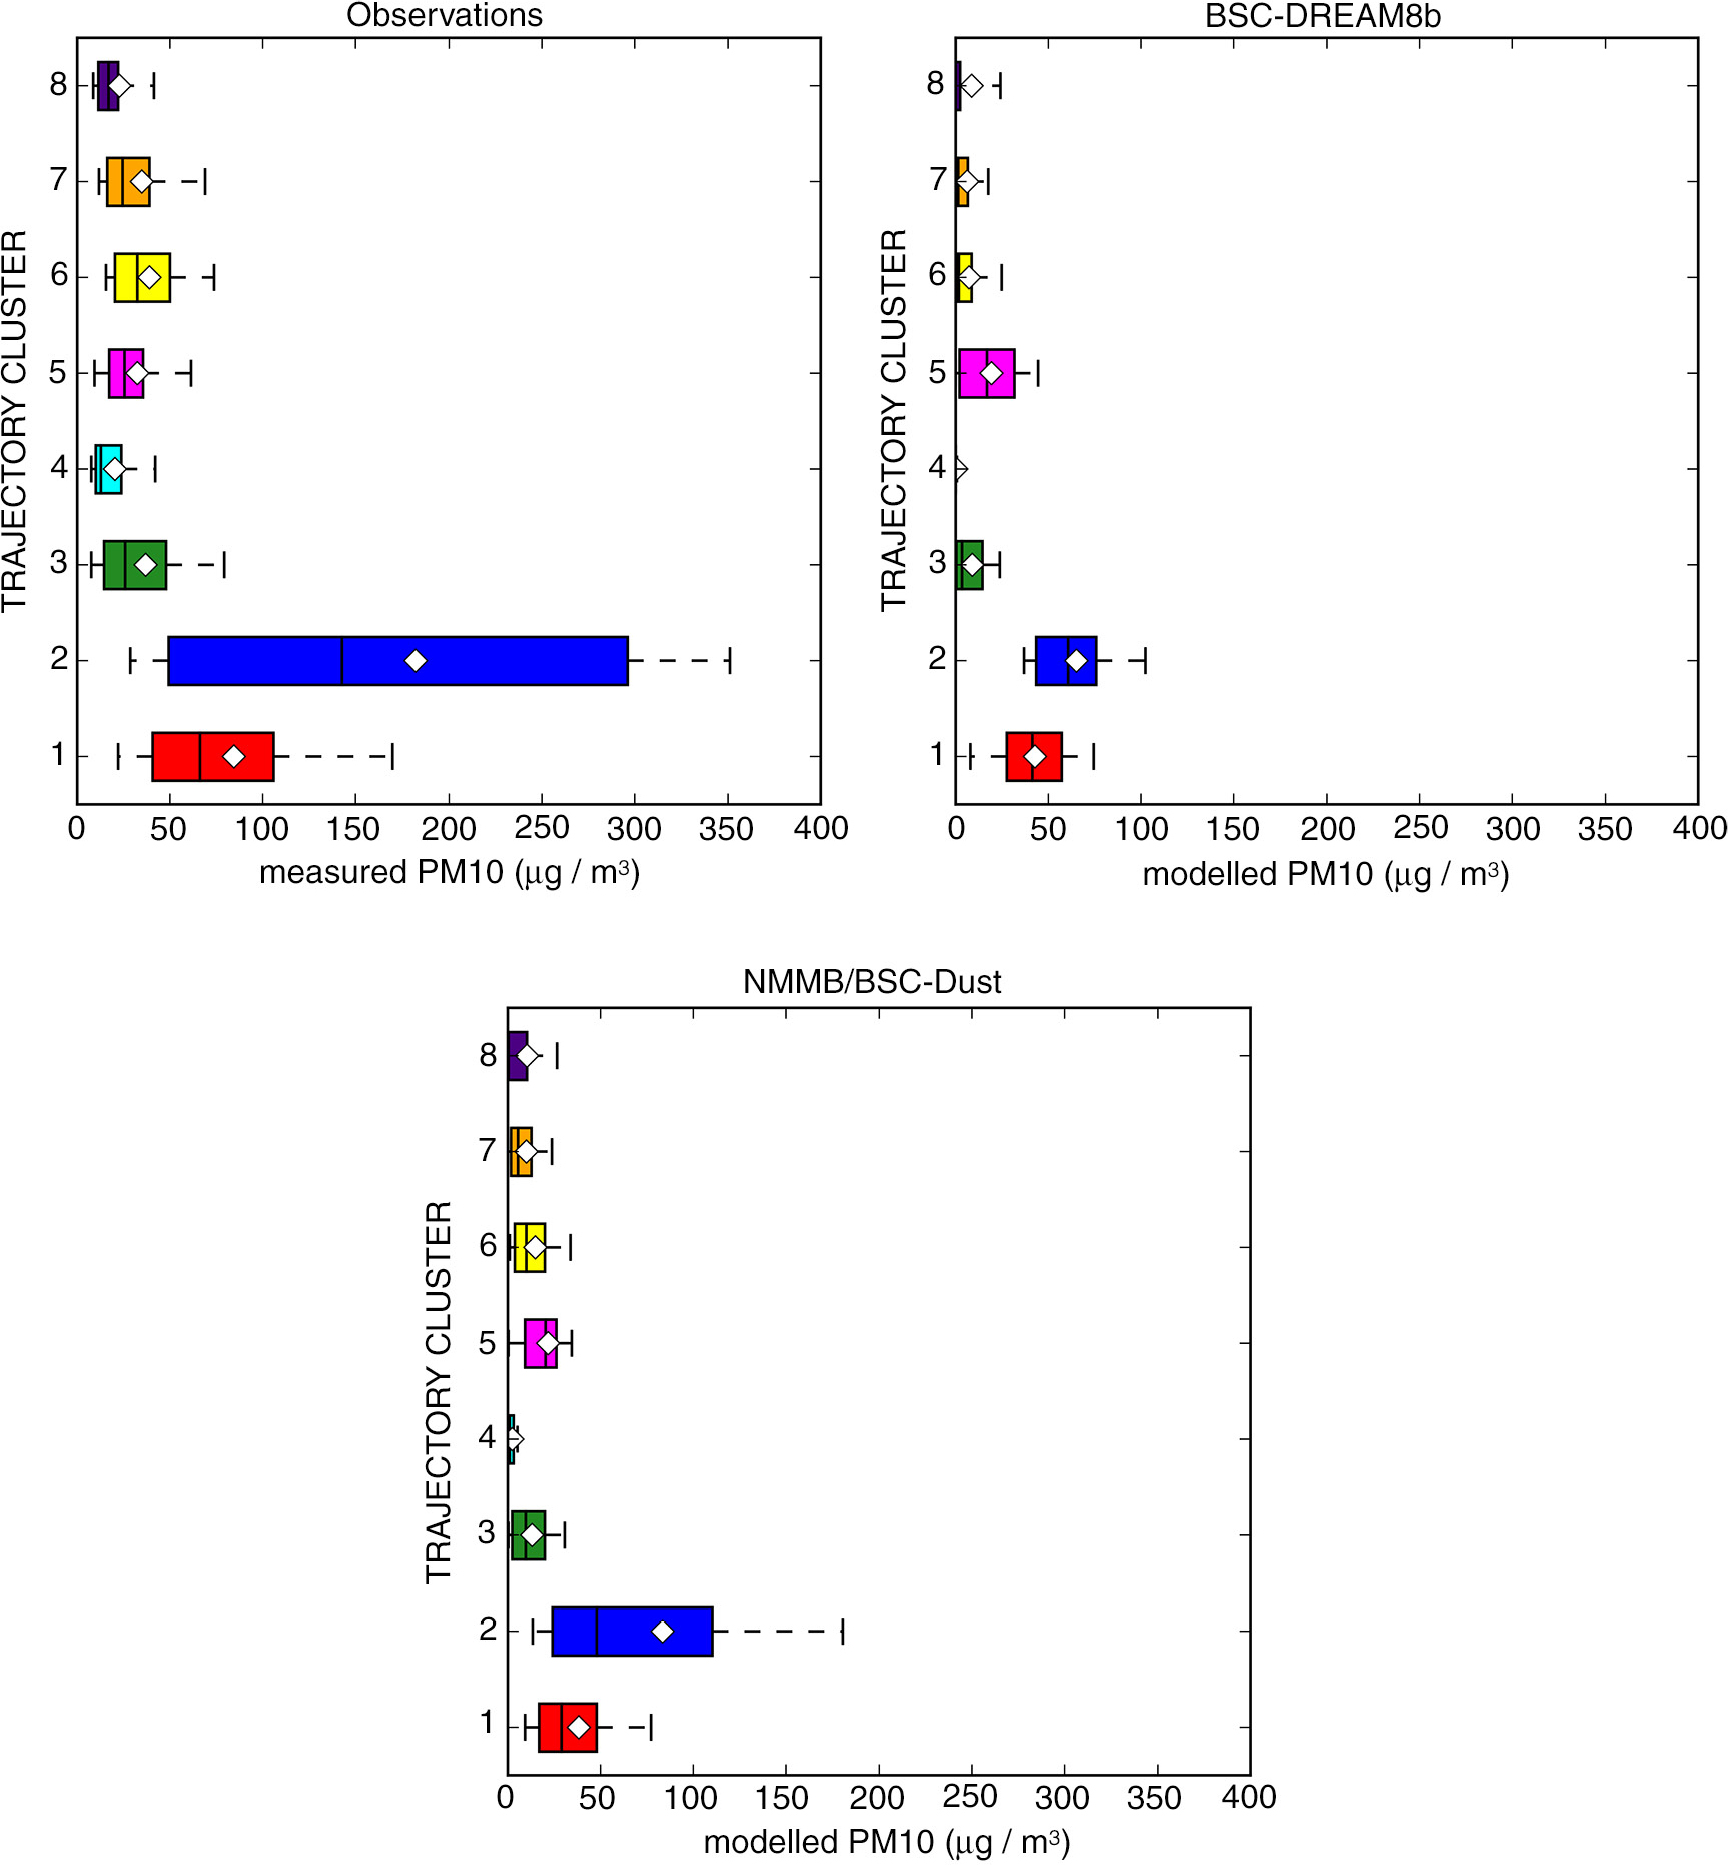
Fig. 10
PM10 (top) measured and BSC-DREAM8b and (bottom) NMMB/BSC-Dust modelled PM10 concentrations in Praia, during 2011, according to trajectory clusters. The left and right limits of the box represent the first and third quartiles and the band inside the box represents the median. The ends of the whiskers represent the 10th and the 90th percentiles. White diamonds represent the mean value. Outliers are not shown.
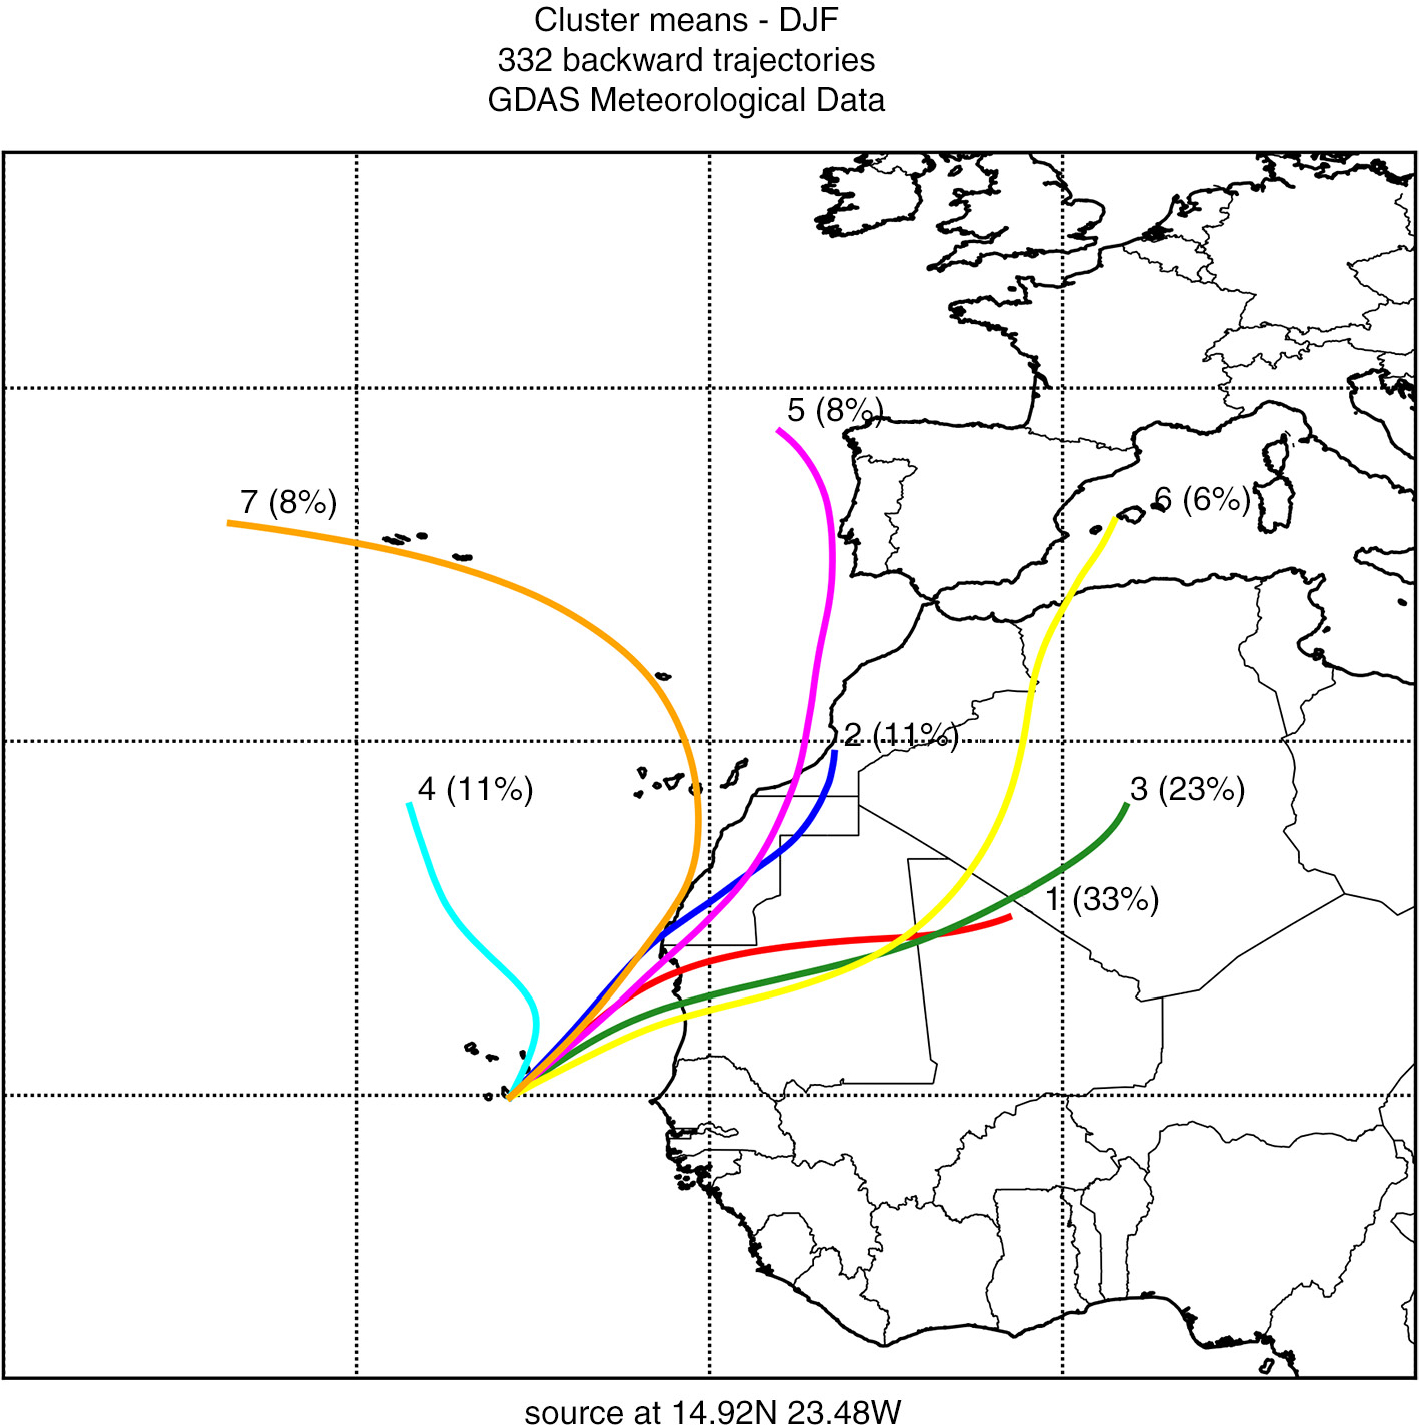
Fig. 11
Ninety-six-hour average back-trajectories for the seven clusters at Praia, Santiago Island (latitude: 14.92 N, longitude: 23.48 W), for December, January and February, with starting height at 250 m above sea level (percentages in parentheses reflect percentage of total 6-hour periods contributing to the averaged trajectory).
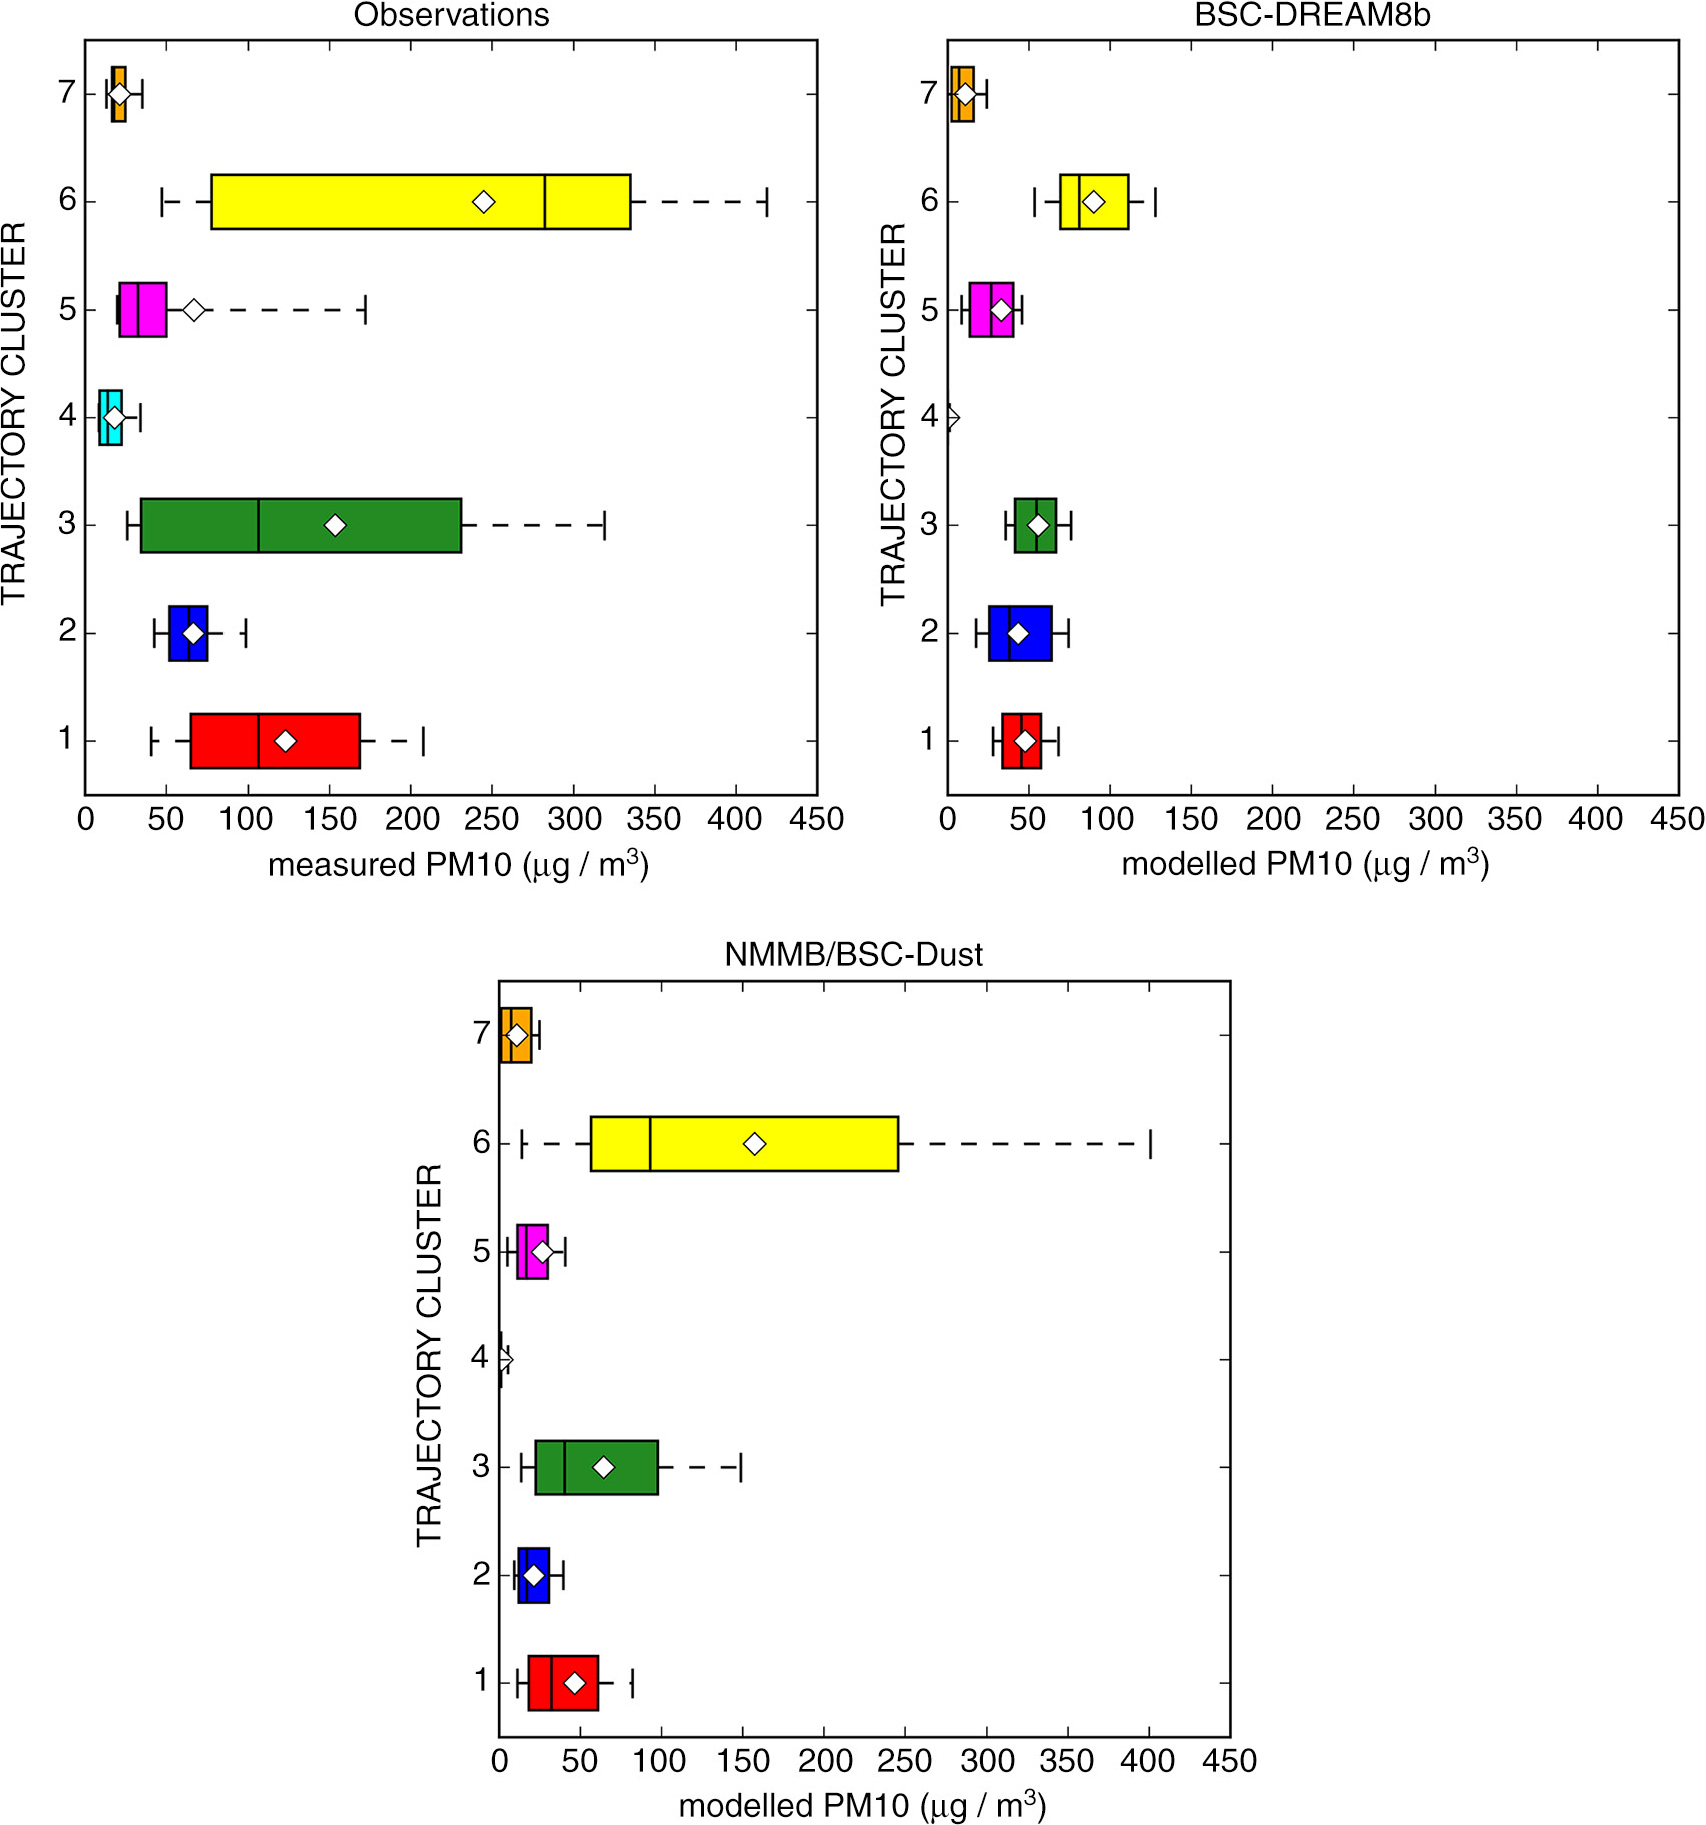
Fig. 12
PM10 (top) measured and BSC-DREAM8b and (bottom) NMMB/BSC-Dust modelled PM10 concentrations in Praia, for December, January and February, according to trajectory clusters. The left and right limits of the box represent the first and third quartiles and the band inside the box represents the median. The ends of the whiskers represent the 10th and the 90th percentiles. White diamonds represent the mean value. Outliers are not shown.