
1. Introduction
Mineral dust from deserts contributes largely to the content of tropospheric aerosols and impacts air quality in several regions across the globe (Fairlie et al., 2007; Bouchlaghem et al., 2009; Pey et al., 2013; Salvador et al., 2013). Apart from air quality issues, airborne dust particles affect the Earth's radiative budget by scattering and absorbing solar and infrared radiation (Liao and Seinfeld, 1998; Pérez et al., 2006b) and modify cloud properties (Yin et al., 2002; Pósfai et al., 2013) and photolysis rates (Jeong and Sokolik, 2007). When deposited into the ocean, mineral dust acts as a nutrient supplier, which may affect the primary production of phytoplankton and eventual carbon export to the deep ocean (Mahowald et al., 2005; Moxim et al., 2011; Gallisai et al., 2014).
The largest dust sources are located in the northern hemisphere (Prospero et al., 2002; Ginoux et al., 2012), being millions of tons of eroded mineral soils carried every year from the Sahara and Sahel regions to the Americas (including the Caribbean and the Amazon basin), Europe and Middle East. To characterise and quantify the dust transported from North Africa through the tropical Eastern North Atlantic Ocean region, the Cape Verde Islands, located 570 km off the coast of Western Africa in an area of massive dust transport from land to ocean, are one of the best places to set up experimental campaigns. Examples of previous campaigns in Cape Verde worth mention within the scope of this work are the Saharan Dust Experiment (SHADE) in September 2000 (Formenti et al., 2003; Tanré et al., 2003), the African Monsoon Multidisciplinary Analysis (AMMA) between August and September 2006 (Jeong et al., 2008; Chen et al., 2011), the Reactive Halogens in the Marine Boundary Layer (RHaMBLe) intensive study during summer 2007 (Müller et al., 2010), the Saharan Mineral Dust Experiment (SAMUM-2) between January and February 2008 (Ansmann et al., 2011; Kandler et al., 2011; Knippertz et al., 2011) and, more recently, between January 2011 and January 2012, the CV-DUST Project (Pio et al., 2014). Moreover, the Cape Verde Atmospheric Observatory (CVAO) was established in 2006 and is undertaking long-term ground- and ocean-based observations (Fomba et al., 2014).
Assessment of the atmospheric life cycle of the eroded desert dust cannot be done based only on scarce measurements. Atmospheric modelling is an important tool capable of providing information on the spatial and temporal variability of dust emissions, transport and deposition, its composition and size distribution. In addition, dispersion models are used as valuable tools to establish a relationship between emission sources and observed pollution levels. Schepanski et al. (2009) applied the regional dust model LM-MUSCAT (Heinold et al., 2007) to characterise Saharan dust transport and deposition towards the tropical North Atlantic, which was described in terms of horizontal and vertical distribution of dust concentration, optical thickness and dry and wet deposition rates over three typical months in different seasons. In SAMUM-2, the regional dust model COSMO–MUSCAT (Multi-Scale Chemistry Aerosol Transport Model; Heinold et al., 2011) was used to study the mixed plume of Saharan dust and biomass-burning aerosol transported off the West African coast towards the Cape Verde area during January and February 2008. Several other regional numerical models were developed to simulate the desert dust cycle in the atmosphere for operational purposes, such as SKIRON (Nickovic and Dobricic, 1996; Kallos et al., 1997; Nickovic et al., 1997), BSC-DREAM8b (Nickovic et al., 2001; Pérez et al., 2006a, 2006b; Basart et al., 2012b), CHIMERE (Menut et al., 2009; Schmechtig et al., 2011), MOCAGE (Martet andPeuch, 2009) and NMMB/BSC-Dust (Pérez et al., 2011; Haustein et al., 2012), among others. It is notable that in 2007, the World Meteorological Organization (WMO) established the Sand and Dust Storm Warning Advisory and Assessment System to enhance the ability of countries to deliver timely and quality sand and dust forecasts, observations, information, and knowledge to users. Within this programme, the North Africa, Middle East and Europe Regional Center (http://sds-was.aemet.es/), hosted by the Spanish Meteorological Agency (AEMET) and the Barcelona Supercomputing Center – Centro Nacional de Supercomputación (BSC-CNS), aims to lead the development and implementation of a system for dust observation and forecast. Currently, this regional centre distributes forecasts over North Africa from nine (regional and global) models that are evaluated in near-real-time.
In this study, we aim to characterise a complete annual cycle of the aerosol over Cape Verde using ground-based observations and model outputs. Surface aerosol measurements performed within the scope of the CV-DUST Project and data from one AERONET station were used, together with two dust models, BSC-DREAM8b and the NMMB/BSC-Dust, as well as a trajectory model, in order to characterise dust particle size distribution, concentrations and optical properties for the whole year 2011. This is the first attempt to compare dust models for surface concentration and size distribution in Northern Africa for an annual cycle. Model results will contribute to a better characterisation of the seasonality of the Saharan and Sahelian dust-source regions and of the long-range transport of the desert dust through North and West Africa, and through the Eastern North Atlantic Ocean.
The paper is organised as follows. Section 2 describes the main characteristics of the BSC-DREAM8b and NMMB/BSC-Dust models and the observational datasets. Section 3 shows the results of model evaluation against observations, discussing seasonal dust patterns in the region and their effect on the variability of dust concentrations over Cape Verde. Finally, main conclusions are provided in Section 4.
2. Methodology
2.1. The BSC-DREAM8b model
The BSC-DREAM8b v1.0 model (Nickovic et al., 2001; Pérez et al., 2006a, 2006b; Basart et al., 2012b) solves the Euler-type partial differential non-linear equation for dust mass continuity, which is fully embedded as one of the governing prognosis equations in the Eta/NCEP atmospheric model. Thus, the model is able to simulate and predict the 3-dimensional field of dust concentration in the troposphere by taking into account all major processes of the dust life cycle, such as dust emission (Shao et al., 1993) with an introduced viscous sublayer (Janjic, 1994), horizontal and vertical diffusion and advection, turbulent and lateral diffusion (Janjic, 1994), as well as dry deposition and gravitational settling (Giorgi, 1986) and a simple below-cloud scavenging scheme (Nickovic et al., 2001).
The main features of BSC-DREAM8b, described in detail by Pérez et al. (2006b), include a source function based on the aridity categories of a 1 km USGS land use dataset and the FAO 4 km global soil texture dataset, a dust size distribution profile described by eight size bins within a 0.1–10 µm radius range according to Tegen and Lacis (1996), a source distribution derived from D'Almeida (1987), and dust radiative feedback (Pérez et al., 2006b). The emission scheme implemented in BSC-DREAM8b, described in detail by Basart et al. (2012b), directly entrains dust-sized particles into the atmosphere and includes the influence of soil structure and particle size distribution, as well as atmospheric conditions – where the near-surface wind speed must exceed the local threshold velocity to force dust mobilisation.
In recent years, this model has been used for dust forecasting and as a dust research tool in North Africa and southern Europe (Jiménez-Guerrero et al., 2008; Amiridis et al., 2009, 2013; Klein et al., 2010; Pay et al., 2010; Alonso-Perez et al., 2011; Basart et al., 2012b; Kokkalis et al., 2012; Gallisai et al., 2014). The model has also been evaluated and tested for longer time periods over Europe (Basart et al., 2012a; Pay et al., 2012; Tchepel et al., 2013) and against measurements at source regions [SAMUM I (Haustein et al., 2009) and BoDEx (Todd et al., 2008)]. Moreover, the operational model predictions are near-real-time evaluated with satellites (MODIS and MSG) and AERONET data (http://www.bsc.es/earth-sciences/mineral-dust-forecast-system/bsc-dream8b-forecast/).
For the present analysis, the simulation domain (see Fig. 1) covered North Africa, Middle East and Europe (NA-ME-E) with a resolution set to 1/3° in the horizontal and to 24 Eta-layers extending up to approximately 15 km in the vertical. The simulated dust distributions consist of 365 daily runs for the year 2011. The initial state of the dust concentration was defined by the 24-h forecast of the previous-day model run. Only in the ‘cold start’ of the model, concentration is set to zero. The cold start of the model was initiated on 23 December 2010. The Final Analyses of the National Centers of Environmental Prediction (NCEP/FNL; at 1°×1°) at 0UTC were used every 24 hours as initial conditions and boundary conditions were updated every 6 hours.
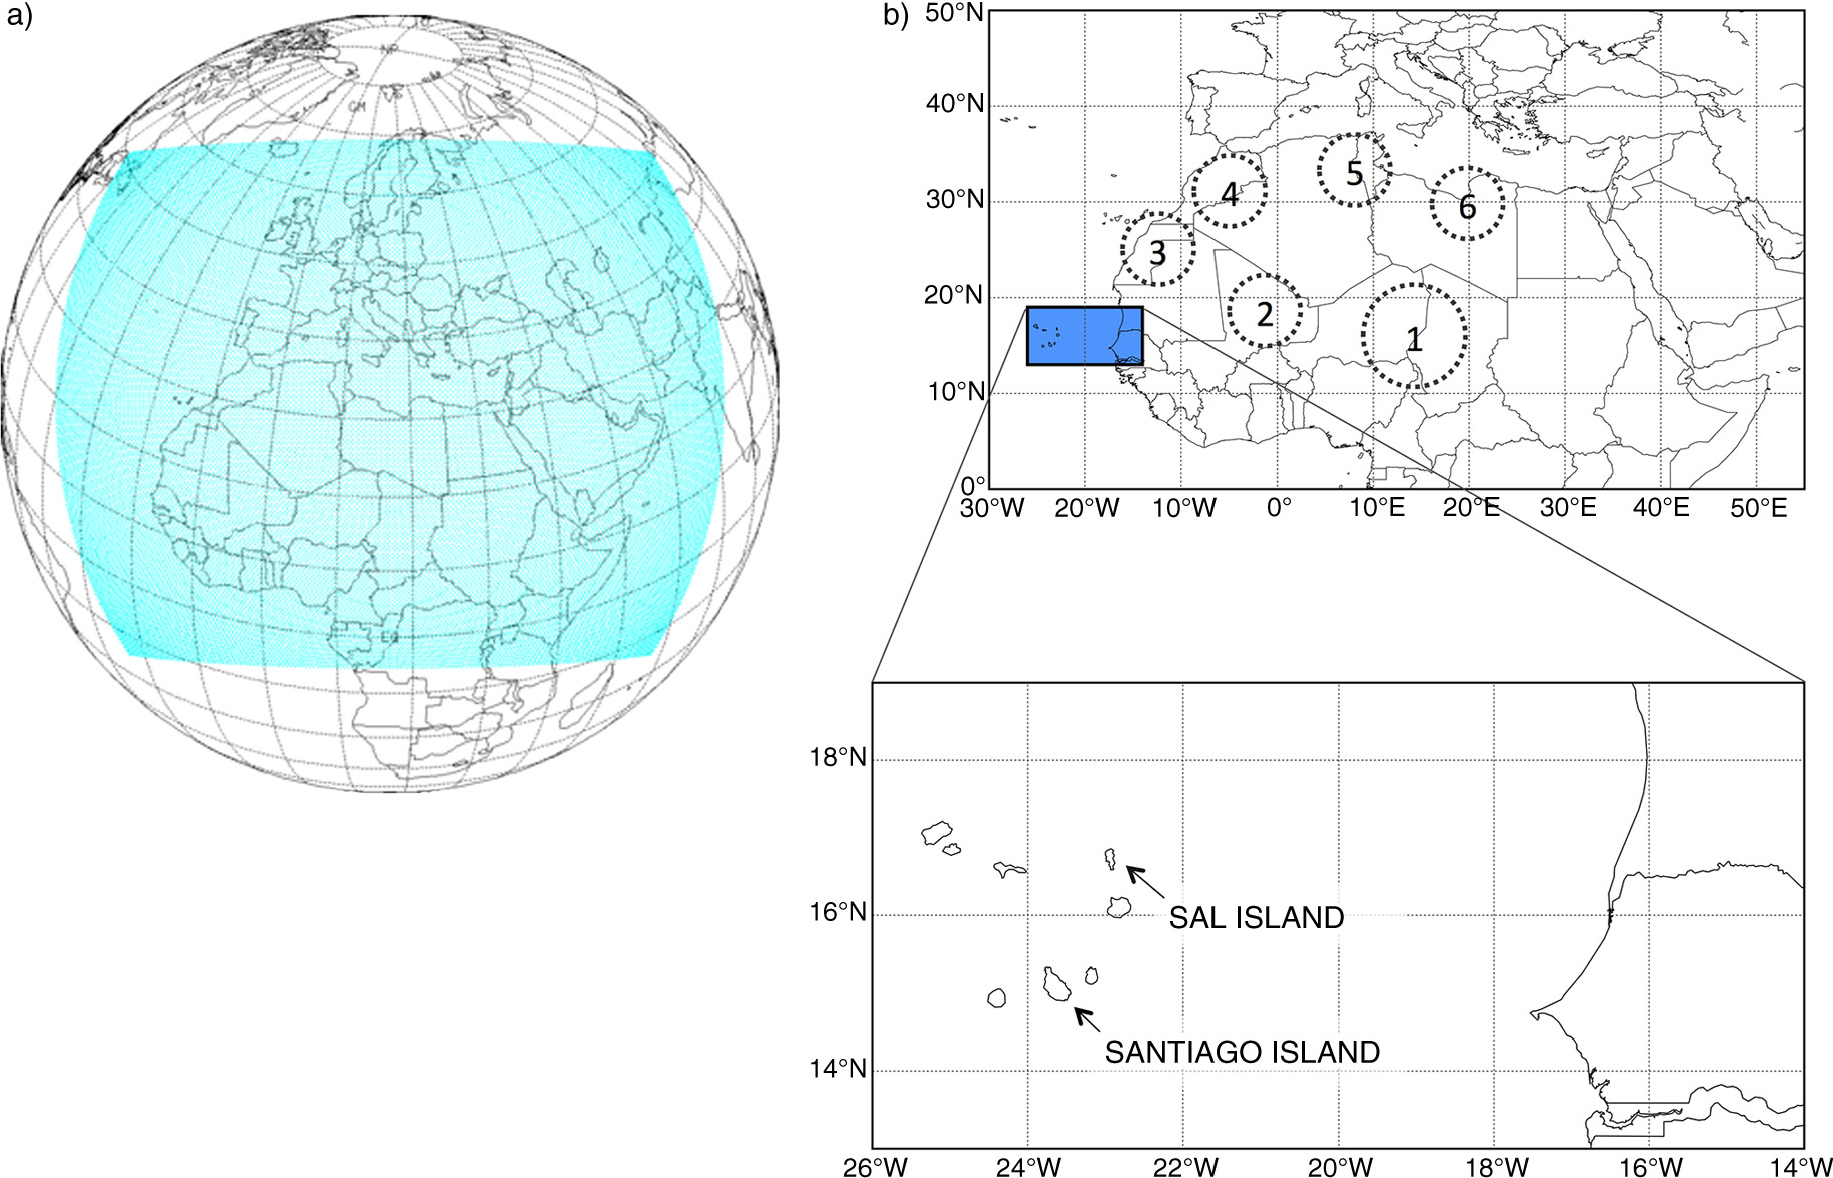
Fig. 1
(a) Model simulation domain and (b) location of the measurement points Praia (Santiago Island) and Espargos (Sal Island) in Cape Verde. In the map, the dotted circles indicate dust emission source areas: (1) Bodélé, (2) Algeria–Mali, (3) West Sahara–Mauritania, (4) Algeria–Morocco, (5) Algeria–Tunisia and (6) Libya Desert.
2.2. The NMMB/BSC-Dust model
The NMMB/BSC-Dust model (Pérez et al., 2011; Haustein et al., 2012) is the dust module of the NMMB/BSC-Chemical Transport Model (NMMB/BSC-CTM; Pérez et al., 2011; Haustein et al., 2012; Jorba et al., 2012; Spada et al., 2013; Badia and Jorba, in press) which is an online multiscale atmospheric model designed and developed at BSC-CNS in collaboration with NOAA/NCEP, NASA Goddard Institute for Space Studies and the International Research Institute for Climate and Society (IRI). The dust model is fully embedded into the Non-hydrostatic Multiscale Model (NMMB) developed at NCEP and is intended to provide short to medium-range dust forecasts for both regional and global domains.
This model, which is described in detail in Pérez et al. (2011), is a state-of-the-art dust model that includes a much more sophisticated meteorological driver than BSC-DREAM8b (NMMB meteorological model). The NMMB/BSC-Dust model solves the mass balance equation for dust by taking into account the following processes: (1) dust generation and uplift by surface wind and turbulence, (2) horizontal and vertical advection (Janjic et al., 2009), (3) horizontal diffusion and vertical transport by turbulence and convection (Janjic et al., 2009), (4) dry deposition and gravitational settling (Zhang et al., 2001) and (5) wet removal that includes in-cloud and below-cloud scavenging from convective and stratiform clouds (Betts, 1986; Betts and Miller, 1986; Janjic, 1994; Ferrier et al., 2002). Furthermore, in order to take into account the effects of aerosols and mineral dust interactively, the rapid radiative transfer model (RRTM) (Mlawer et al., 1997) is implemented in the model.
The NMMB/BSC-Dust model includes a physically-based dust emission scheme which explicitly takes account of saltation and sandblasting processes (White, 1979; Marticorena and Bergametti, 1995; Marticorena et al., 1997) and assumes a viscous sublayer between the smooth desert surface and the lowest model layer (Janjic, 1994; Nickovic et al., 2001) as in the case of the BSC-DREAM8b model. To specify the soil size distribution we use the soil textures of the hybrid STATSGO-FAO soil map. In this database, the FAO two-layer 5-minute global soil texture is remapped into a global 30-second regular latitude-longitude grid. Four soil populations are used in the model distinguishing among fine-medium sand and coarse sand according to the criteria used in Tegen et al. (2002). The dust vertical flux is distributed according to D'Almeida (1987) and then distributed over each eight dust size transport bins with intervals taken from Tegen and Lacis (1996) and Pérez et al. (2006a) as in the case of the BSC-DREAM8b model. For the source function, the model uses the topographic preferential source approach after Ginoux et al. (2001) and the National Environmental Satellite, Data, and Information Service (NESDIS) vegetation fraction climatology (Ignatov and Gutman, 1998).
The NMMB/BSC-Dust model has been evaluated at regional and global scales (Pérez et al., 2011; Haustein et al., 2012). Pérez et al. (2011) provides daily to annual evaluations of the model for its global and regional configurations. At the global scale, the model lies within the top range of AEROCOM dust models in terms of performance statistics for surface concentration, deposition and aerosol optical depth (AOD). At regional scale, the model reproduces significantly well the daily variability and seasonal spatial distribution of the dust optical depth over Northern Africa, the Middle East and Europe. In Haustein et al. (2012), the model was evaluated at the regional scale against measurements at source regions from the Saharan Mineral Dust Experiment (SAMUM I) and the Bodélé Dust Experiment (BoDEx) campaigns. The operational model predictions are near-real-time evaluated with satellites (MODIS and MSG) and AERONET data (http://www.bsc.es/earth-sciences/mineral-dust/nmmbbsc-dust-forecast/).
For the present analysis, the regional domain covering North Africa, the Middle East and Europe (NA–ME–E) was selected, with a resolution set to 1/4° in the horizontal and to 40 σ-layers in the vertical. As in the case of the BSC-DREAM8b model, the simulated dust distributions consisted of 365 daily runs for the year 2011. The initial state of the dust concentration was defined by the 24-h forecast of the previous-day model run. Only in the ‘cold start’ of the model, concentration is set to zero. The cold start of the model was initiated on 23 December 2010. The Final Analyses of the National Centers of Environmental Prediction (NCEP/FNL; at 1°×1°) at 0UTC were used every 24 hours as initial conditions and boundary conditions were updated every 6 hours. In this contribution, simulations were carried with the operational GFDL radiation scheme, which does not allow feedback between dust and radiation.
2.3. In-situ particulate matter observations
Aerosol concentrations were measured in Cape Verde for 1 yr, from January 2011 to January 2012, in the scope of CV-DUST Project (Pio et al., 2014). The measuring instruments were installed at 98 m above sea level at the Cape Verde National Institute for Meteorology and Geophysics (INMG) located in the former Airport Francisco Mendes (14.92°N, 23.48°W), about 2 km away from central Praia (Cape Verde capital city) and 1700 m from the sea border. Measurements of particulate matter (PM) concentration were based on the optical particle counter (OPC) method and were carried out using a GRIMM EDM164 Environmental Dust Monitor. The equipment allowed the continuous counting of particles in real time (5 minute averages) with sizing from 0.25 up to 32 µm, using 31 size channels. A detailed description, with schematic diagrams of a similar instrument, can be found in Grimm and Eatough (2009). A density of 2.5 g/cm3 was used to convert the aerosol volume deduced from the particle number and size measurements to mass concentrations and mass size distribution. This density was adopted based on two main features: Cape Verde aerosol is composed predominantly of soil dust and seasalt (Müller et al., 2010; Almeida-Silva et al., 2013); dust particles measured previously at Cape Verde and in Morocco showed a specific dry mass between 2.45 and 2.7 g/cm3 (Haywood et al., 2001; Kaaden et al., 2009) and dry density of sodium chloride which is the major constituent of sea salt is approximately 2.16 g/cm3 (Schladitz et al., 2011). In order to achieve a more correct estimate of concentrations and size distribution, the particle size bin diameters were recalculated from the original factory calibration of the equipment, taking into account the refractive index characteristic of sampled dust, 1.53–0.005i [see Pio et al. (2014) for more details]. The recalculated diameter values give mass concentration estimations 11% below the gravimetric values. PM size distribution was also measured using a Tisch Environmental TE-236 High Volume Cascade Impactor with six collection stages (0.49<Dp<10 µm).
2.4. AERONET measurements
To complement the surface concentration observations obtained through the CV-DUST field campaign, column-integrated aerosol optical properties were used, routinely observed within the AErosol RObotic NETwork (AERONET; http://aeronet.gsfc.nasa.gov; Holben et al., 1998; Smirnov et al., 2000). These instruments rely on extinction measurements of direct and scattered solar radiation at several nominal wavelengths (between 340 and 1020 nm). In the present work, quality-assured direct-sun data (Level 2.0) from the Capo Verde station (16.733°N, 22.935°W) in the 440–870 nm wavelength range was used, as these channels are highly accurate.
To allow a comparison with model results, as the AOD is simulated by the BSC-DREAM8b and NMMB/BSC-Dust models at 550 nm, data from AERONET station were extrapolated for a wavelength of 550 nm through data between 440 and 870 nm following Ångström's law. The Ångström exponent (AE), which is available in the same AERONET database, is a measure of the dependency of the aerosol optical properties on wavelength, and is inversely related to the average size of the particles in the aerosol. Large particles such as mineral dust and sea salt have small AE (sometimes even<0), since their optical properties do not change much with wavelength, while AE values above 1.5 indicate a significant presence of fine-mode particles (mainly smoke and urban aerosols) (e.g., O'Neill et al., 2003; Gobbi et al., 2007; Basart et al., 2009).
3. Results and discussion
3.1. Desert dust characterisation in Cape Verde
3.1.1. Surface concentrations (Praia, Santiago Island)
Simulated desert dust concentrations at the surface level for Praia (Santiago Island) in 2011 were analysed and compared with OPC observations. It must be noted that both models take into account only aeolian mineral particles emitted from the deserts, whereas the measurement dataset may also reflect non-dust aerosols like sea salt or biomass-burning particles, secondary pollutants and local sources. As can be observed in Fig. 2, surface concentrations exhibit a strong seasonal trend, which is in accordance with Chiapello et al. (1995) and Fomba et al. (2014), with maximum concentrations in winter and lower values during spring and summer. Between January and March, it is possible to highlight three episodes where observed concentrations reached hourly average values between 490 and 710 µg/m3 of PM10, and between 160 and 240 µg/m3 of PM2.5. Both models are able to reproduce those episodes, although the magnitude of the BSC-DREAM8b predicted concentrations is much lower than the observed, reaching maximum values of 170 µg/m3 in the case of PM10, and 55 µg/m3 for the PM2.5 fraction. NMMB/BSC-Dust estimates were much closer to the observations, reaching values up to 550 µg/m3 of PM10 and up to 220 µg/m3 of PM2.5. Table 1 presents the statistical parameters computed for model evaluation. A good agreement between observations and models results was found for PM10 daily average concentrations with correlation coefficients of 0.63 (BSC-DREAM8b) and 0.77 (NMMB/BSC-Dust) for the 1-yr period, denoting the importance of mineral dust contribution for the total aerosol mass. The average difference between measured bulk PM10 and model dust<10 µm (‘bias’) was 32.9 µg/m3 for BSC-DREAM8b and 29.0 µg/m3 for NMMB/BSC-Dust (models under predict PM10 surface levels). The box-and-whisker plots of the PM10 and PM2.5 concentrations for every month (Fig. 2, bottom) allow a quantitative view of the differences between model and experimental data.
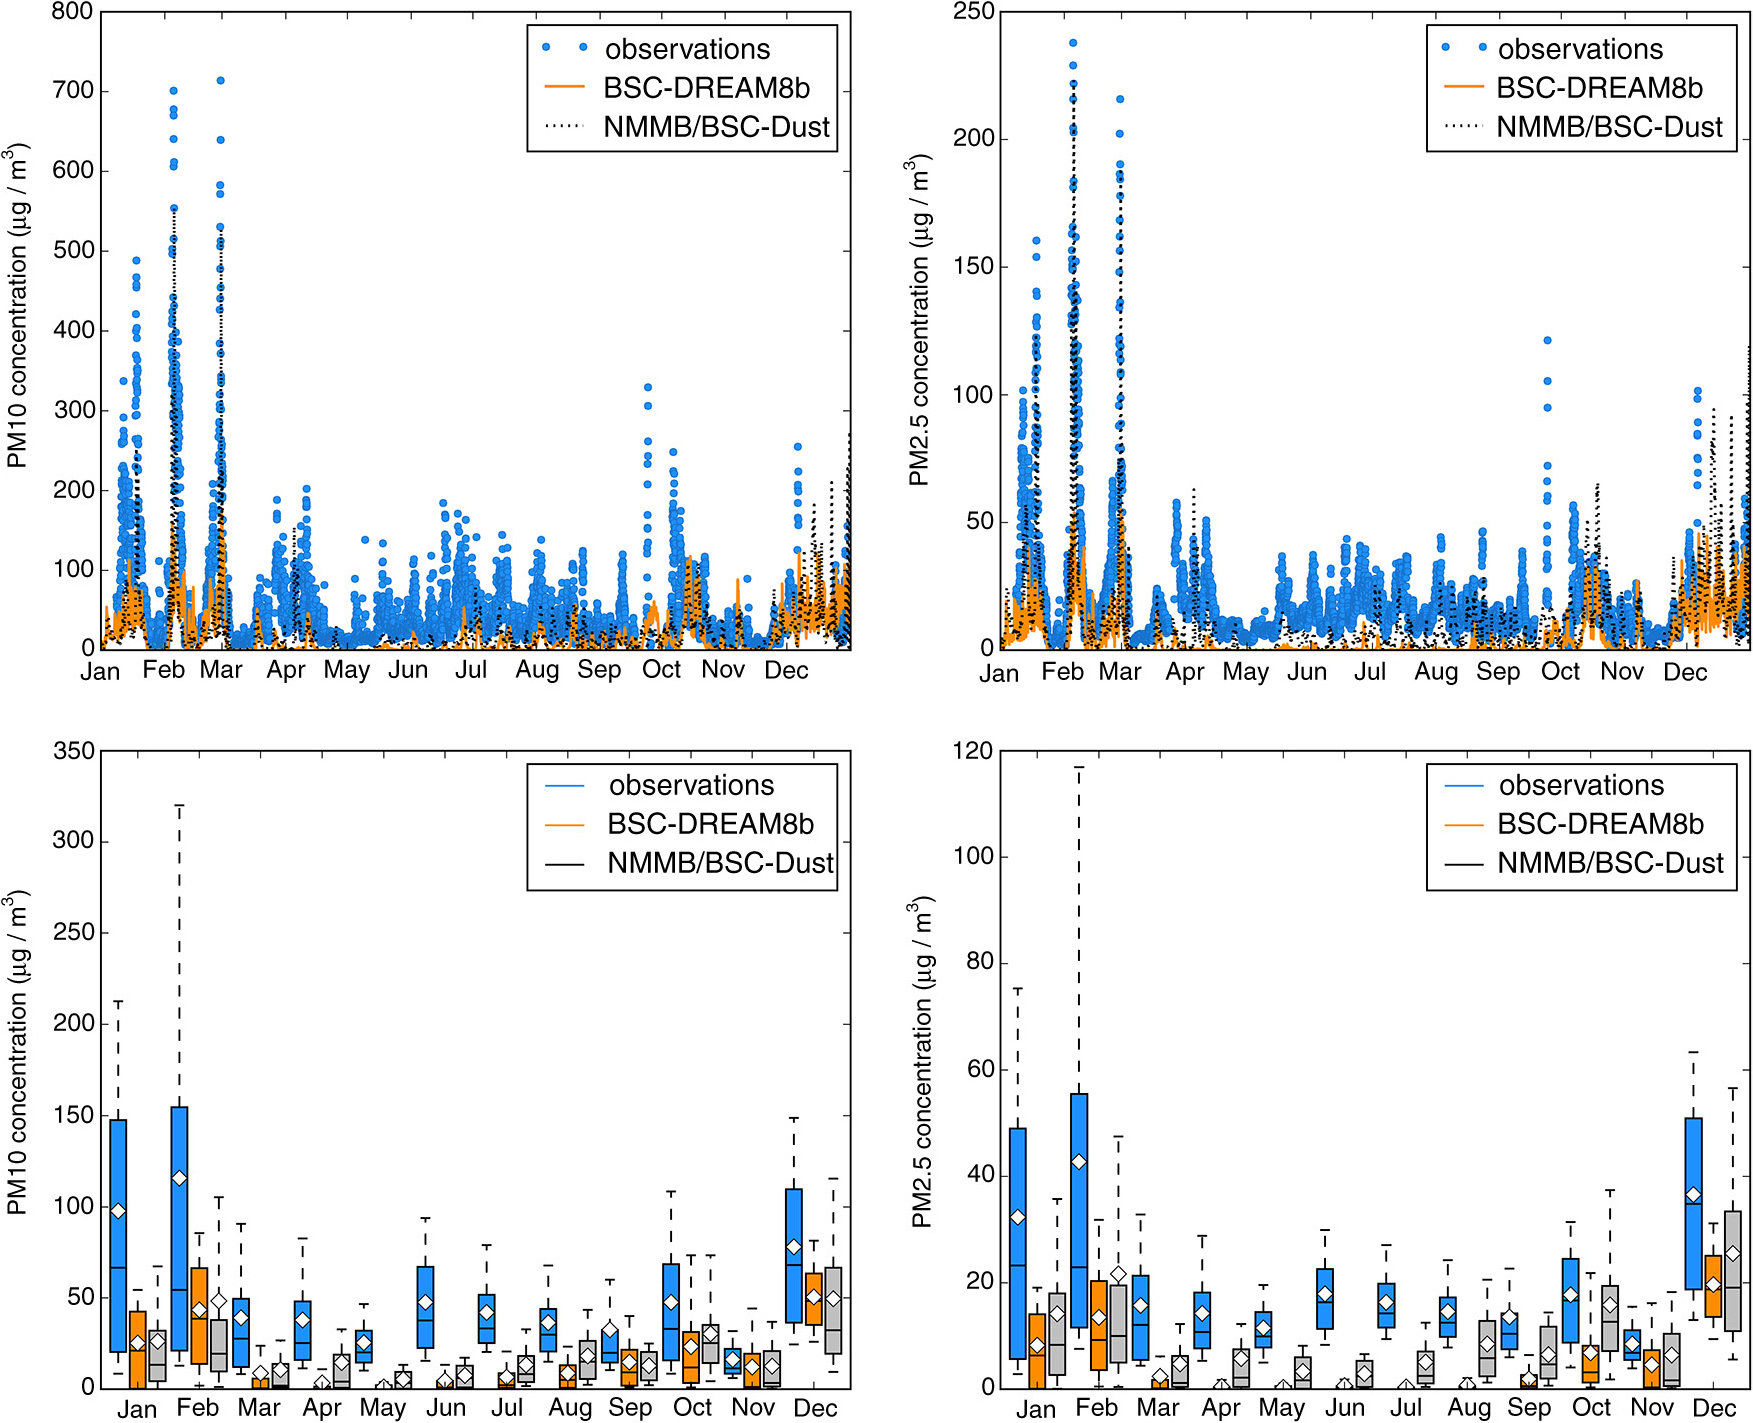
Fig. 2
(Top) Measured and modelled PM10 and PM2.5 hourly concentrations in Praia, Cape Verde, and (bottom) monthly analysis of the same datasets. The bottom and top of the box represent the first and third quartiles and the band inside the box represents the median. The ends of the whiskers represent the 10th and the 90th percentiles. White diamonds represent the mean value. Outliers are not shown.
Table 1. Statistical parameters computed for daily average surface concentrations
Annual average observed concentrations for PM10 and PM2.5 were 49.7±62.3 and 19.5±21.0 µg/m3, respectively, whereas annual average model dust concentrations were, for the<10 µm and<2.5 µm fractions, respectively, 16.8±24.7 and 5.0±8.6 using BSC-DREAM8b and 20.7±36.5 and 10.0±16.3 using NMMB/BSC-Dust. These values were in good agreement with the 5-yr means found by Fomba et al. (2014) at CVAO on São Vicente Island, which had a PM10 mean of 47.1±55.5 µg/m3 and mineral dust mean of 27.9±48.7 µg/m3. The SAMUM-2 intensive 1-month (January 2008) field campaign in Praia revealed PM10 values on the order of 29 µg/m3 during transport of maritime air masses, and 223 µg/m3 during dust events with air masses transported directly from Africa (Kandler et al., 2011). Their mass ratio of between PM10 and PM2.5 did not present a significant variation during the field experiment, with an average of 2.67, which is not very different from our annual average measured ratio of 2.55.
Due to the location of the CV-DUST measurement station, observed aerosol concentrations were expected to be affected not only by the transport of dust from Africa, but also by local dust, anthropogenic emissions and sea salt spray. The results obtained with the NMMB/BSC-Dust model and observations gave an averaged modelled dust concentration<10 µm equal to 20.7 µg/m3; and averaged measured bulk PM10 equal to 49.7 µg/m3. This allows rough estimation that on a yearly basis, 42% of the PM10 mass observed in Cape Verde is associated with dust transported from North African deserts. Indeed, Almeida et al. (2013) found on average for the same year 2011, a natural origin of 68% of the PM10 mass in Cape Verde, with 48% associated with soil and 20% associated with the sea. These values were lower than the 80% coupled contribution of sea salt and mineral dust for the aerosol mass (being about 55% associated with mineral dust only) found by Fomba et al. (2014) for a 5-yr period (2007–2011) at the CVAO (in a less anthropogenically influenced region). Nunes et al. (2012) analysed the water-soluble inorganic species present in the Cape Verde atmosphere and found a high correlation (R >0.95) among chloride, sodium and magnesium ions, which denotes the importance of sea salt contribution to the local observed aerosol. From the CV-DUST elemental analysis, an average sea salt concentration of 12–14 µg/m3 was observed during 2011 in PM10 particles, which represents nearly half of the unexplained PM10 bias. A sea salt 5-yr mean concentration of 11.1±5.5 µg/m3 was reported by Fomba et al. (2014). In addition, aerosols from the African continent carry not only Saharan dust, but also anthropogenic emissions from ship tracks near the African coast, African coastal cities and sometimes biomass-burning aerosols (Kaufman et al., 2005; Ansmann et al., 2009; Dall'Osto et al., 2010; Rodríguez et al., 2011). The chemical analysis of size-segregated samples performed under CV-DUST studies in Praia show a less than 20% contribution of submicron PM mass from carbonaceous constituents (EC+OC) and secondary aerosols species (non-sea salt sulphate, nitrate and ammonium).
The size distribution of desert dust is crucial to understanding how far particles can travel from source regions. Moreover, the size distribution of mineral dust aerosols partially determines their interactions with clouds, radiation, ecosystems, and other components of the Earth system (Mahowald et al., 2013). It is also one of the key modelling factors in order to correctly incorporate dust–radiation and dust–cloud interactions into regional dust models (Pérez et al., 2006a). Figure 3 shows the seasonal analysis of observed and modelled surface PM size distribution for Praia, Cape Verde. To plot this figure, data from the 31 size channels by the OPC were converted into the eight-bins model size channels. Only the first seven size ranges are presented, including particles up to 12 µm in diameter.
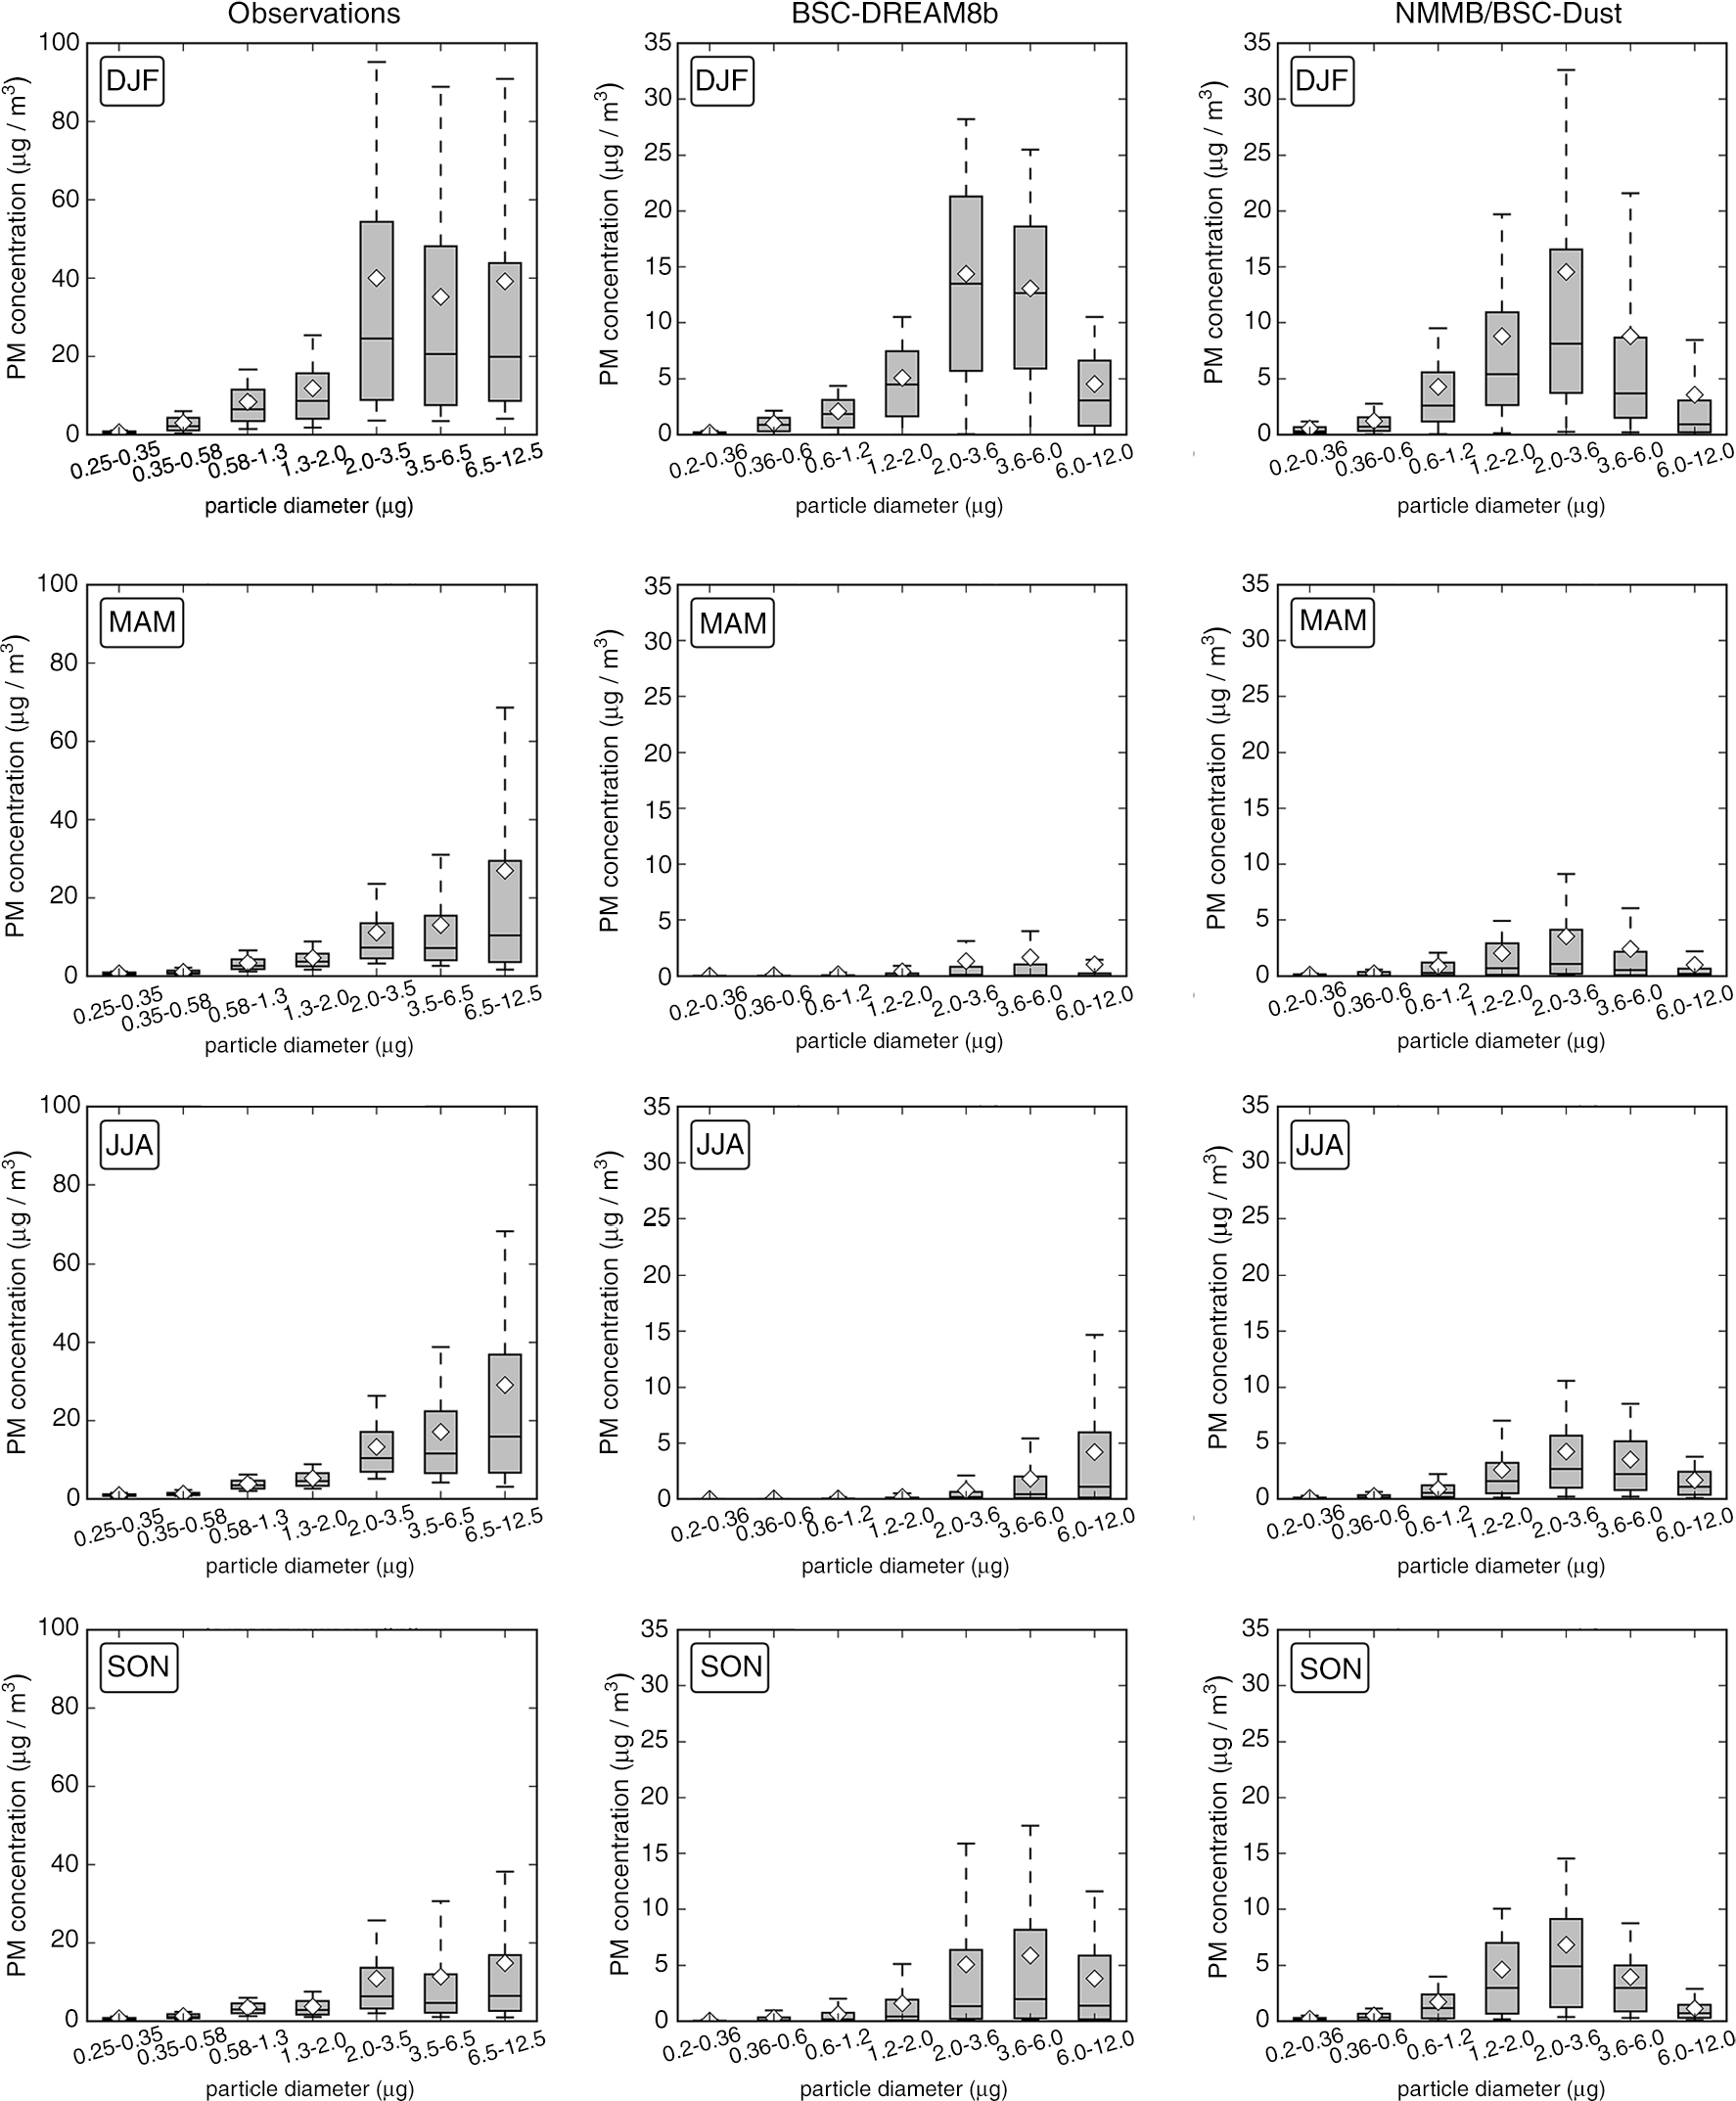
Fig. 3
Seasonal analysis of the observed (left panels) and modelled (centre and right panels) size distribution surface PM concentrations, for Praia, Cape Verde, 2011. DJF corresponds to December, January and February, MAM to March, April and May, JJA to June, July and August and SON to September, October and November. The bottom and top of the box represent the first and third quartiles and the band inside the box represents the median. The ends of the whiskers represent the 10th and the 90th percentiles. White diamonds represent the mean value. Outliers are not shown.
Different behaviours were obtained for the four seasons. During the dust season in winter (corresponding to December, January and February), the experimental data showed that most of the dust mass occurs at between 2 and 12 µm. Similar results were found during RHaMBLe intensive campaign, when days influenced by mineral dust presented a maximum PM concentration in the size fraction of 1.2–3.5 µm, followed by a coarse mode fraction of 3.5–10 µm (Müller et al., 2010). During spring and summer, particles within a range of 6–12 µm contribute the most to the aerosol mass. PM size distribution modelled with BSC-DREAM8b seems to be in greater agreement with observations than NMMB/BSC-Dust, since the estimated contribution of the larger particles for the total dust mass is higher. With the NMMB/BSC-Dust model, particles between 2.0 and 3.6 µm contribute to the higher aerosol mass throughout the year.
In addition to OPC measurements, PM size distribution was measured with a high-volume cascade impactor with six collection stages (0.49<Dp<10 µm). Figure 4 shows observations and BSC-DREAM8b and NMMB/BSC-Dust models results, for the periods between Jan 14 and 18 and between Feb 24 and 27. These two periods were selected among available samples, since they are associated with mineral dust episodes. Although none of the models display the bimodal shape obtained with gravimetric data (with maxima at 1–2 and 5–6 µm), observed PM size distribution was reproduced better by the BSC-DREAM8b, as it shows a mode at larger particle sizes (at 4–5 µm) than the one presented by NMMB/BSC-Dust (at 3 µm). Differences between both models are partly linked to the different dry deposition schemes implemented in each model. The origin of the first mode that is visible in the impactor results is unknown. However, this peak is as well exhibited by the Ca2+, but not by the Cl− analysis (not shown), which rejects the possibility of marine origin. This mode probably appears as a consequence of the rupture of dust agglomerates, as observed in Izana (Rodríguez et al., 2012). The modelled monomodal shape of an aerosol size distribution is related to the transport description in eight size bins (Tegen and Lacis, 1996), with the source size distribution derived from D'Almeida (1987) – which yields 81% of the dust emissions at the 2.0–12.0 µm size bins – and along with the fact that there was no consideration of exchange between size bins.
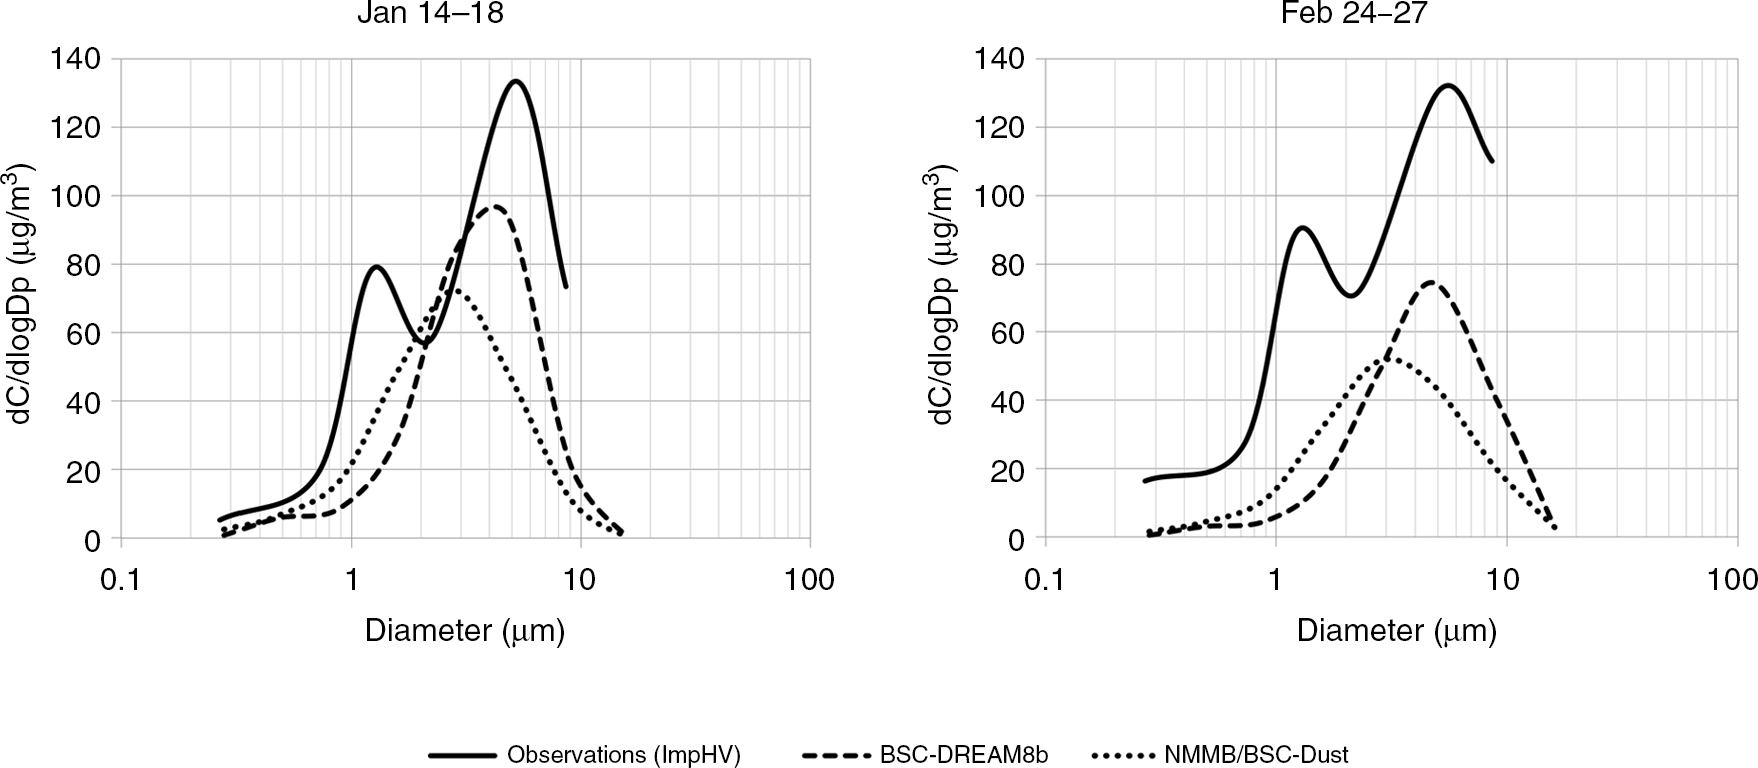
Fig. 4
PM measured and modelled size distribution for (left) Jan 14–18 and (right) Feb 24–27.
3.1.2. Aerosol optical depth (Espargos, Sal Island)
The data from the AERONET site in Cape Verde (located on Espargos, Sal Island) are shown in Fig. 5. In general, higher AOD values are present during summer months. During winter, AOD values are generally lower, reaching high values during specific events. The highest winter peaks occur in the same days as the peaks observed in surface concentration in Santiago Island, highlighting the extent of these episodes of desert dust and long-range transport from the African continent. High extinctions (AOD>0.15) and low Ångström exponent (AE<0.75) values point out that the aerosol regime in Cape Verde is dominated by mineral dust due to frequent Saharan dust outbreaks as indicated in the aerosol characterisation from Basart et al. (2009). Unlike the surface concentrations, the BSC-DREAM8b model reproduces the magnitude of the column-integrated load during summertime. Considering the 1-yr period, a correlation coefficient of 0.58 and a bias of 0.14 were computed from model (which considers only mineral dust transported from the African continent) and observations (which include non-dust aerosols as well). The results from the NMMB/BSC-Dust model are closer to the observations (correlation coefficient=0.74 and bias=0.12). AOD estimates are higher during specific dust events such as the ones between January and March. Moreover, the NMMB/BSC-Dust model is also able to describe the observed AOD during springtime (from middle April till the end of May), when the estimates from BSC-DREAM8b are nearly zero.
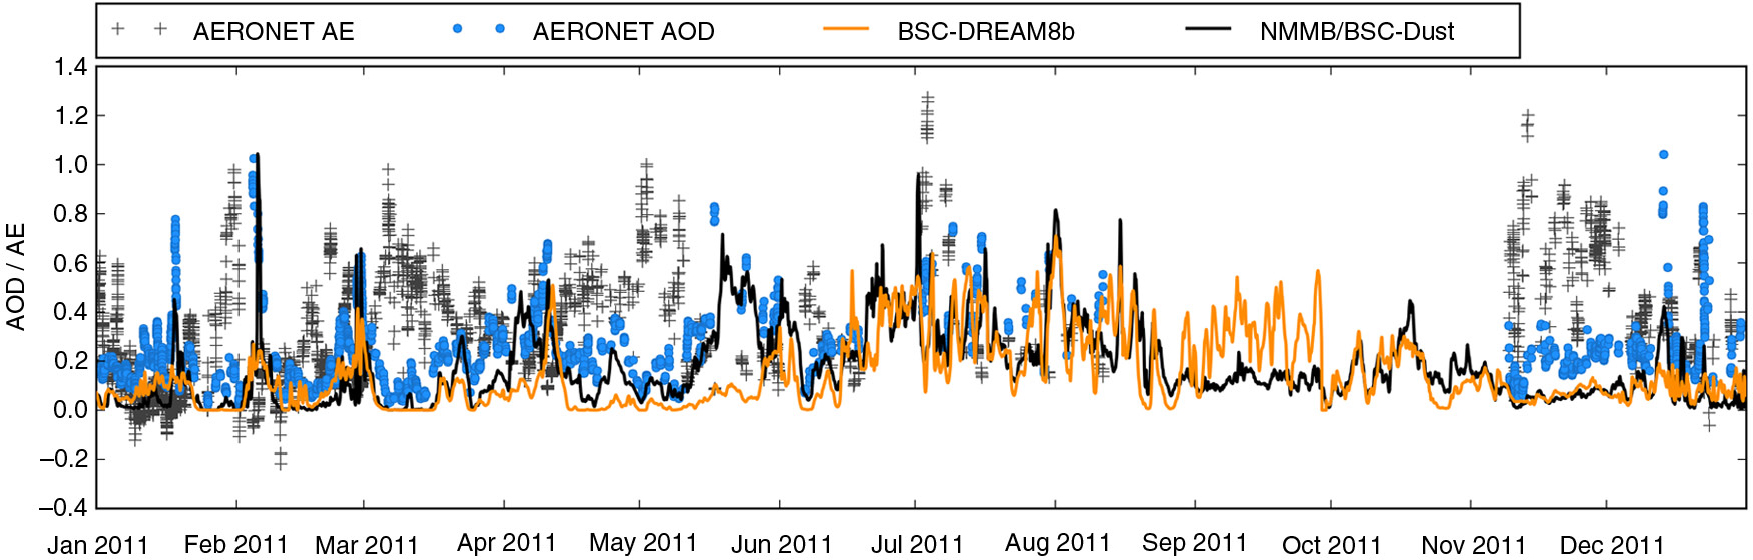
Fig. 5
Measured and modelled aerosol optical depth (AOD at 550 nm) and Ångström Exponent (AE; calculated between 440 and 870 nm) in Espargos, Cape Verde.
The fact that on average, the AOD values were higher during the summer period, in opposition to the lower surface concentrations recorded during this period, indicates the existence of aerosol layers at higher altitudes during summer, as indicated previously by Chiapello et al. (1995, 1997), Schepanski et al. (2009) and Tsamalis et al. (2013). Figure 6 depicts the averaged vertical distribution of desert dust concentrations at Cape Verde latitude (15°N), for winter and summer 2011, modelled by NMMB/BSC-Dust. Similar distributions were obtained with the BSC-DREAM8b model (not shown here). Indeed, during winter months, transport of Saharan dust occurs at near-surface layers, while in the summer the dust layer is extended to higher levels (up to 5km). These results give additional insights regarding the surface PM size distribution analysis done for Praia. During the summer period, it is probable that the coarser particles, having a higher sedimentation velocity, will fall from higher atmospheric layers to the surface, thus influencing aerosol distribution with peaks at sizes larger than those resulting from direct transport, as seen in the observations depicted in Fig. 3.
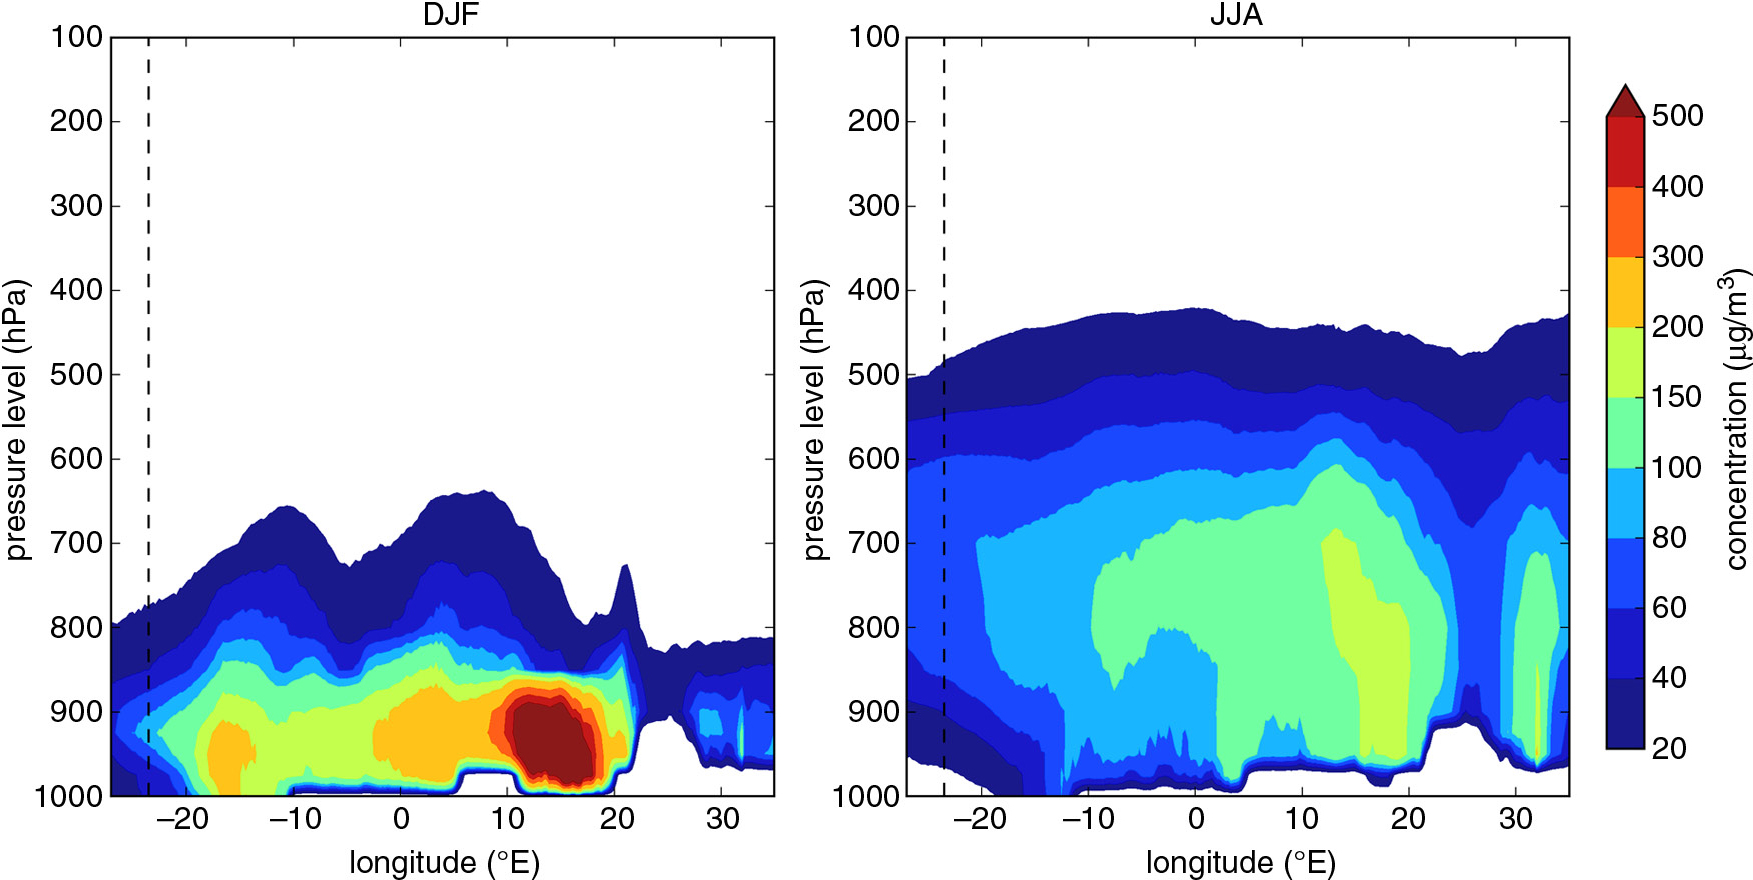
Fig. 6
Vertical distribution of desert dust concentrations at a fixed latitude of 15°N, for (left) average winter (December, January and February) and (right) average summer (June, July and August), modelled with NMMB/BSC-Dust. The dashed line represents the longitude of Cape Verde.
3.2. Dust regional variability: from sources and transport patterns to concentrations and AOD
Desert dust seasonal average surface concentrations and AOD, modelled with BSC-DREAM8b and with NMMB/BSC-Dust for 2011, are presented in Figs. 7 and 8, respectively. The surface concentrations and seasonal patterns are directly linked to dust emissions, meanwhile the AOD seasonal maps help to identify desert dust long-range transport. The Bodélé (in Chad) is the area with the highest dust concentrations, achieving maximum values during winter (DJF) and spring (MAM) months. According to Figs. 7 and 8, additional relevant sources include Algeria–Morocco, West Sahara–Mauritania, the Libya desert, Algeria–Tunisia and Algeria–Mali regions. These sources have been, in general, also mentioned in previous studies where satellite-based data were explored for the purpose of identifying dust-source regions (Goudie and Middleton, 2001; Prospero et al., 2002; Engelstaedter et al., 2006; Schepanski et al., 2012; Ginoux et al., 2012). Both models reproduce the typical seasonal cycle of dust emissions in North Africa, which is linked to the latitudinal shift of the intertropical convergence zone (ITCZ). The dust sources located in the Sahel are mostly active during winter and spring, while those located in northern subtropical Saharan latitudes are more active during spring and summer (e.g., Prospero et al., 2002; Ginoux et al., 2004). As shown by Basart et al. (2012b), the BSC-DREAM8b model tends to overestimate the emissions over Morocco, North Algeria and Tunisia during springtime when dust events are usually driven by low-pressure systems. In contrast, during summer the model tends to reproduce lower surface concentrations than in spring over the main source in the Sahara. Furthermore, the BSC-DREAM8b model underestimates the dust emission from the Southern Saharan sources with a strongly underestimation of the dust transport over the Sahel particularly in wintertime in comparison with NMMB/BSC-Dust. As pointed out in the model evaluation performed by Basart et al. (2012b), this is a problem in the low-level dust transport over the region partly linked to the dry deposition scheme. The updated version of the BSC-DREAM8b model (version 2.0) includes a topographical approach from Ginoux et al. (2001) in its emission scheme, which improves the realism of the model dust load in the vicinity of sources, as well as a new dry deposition and sedimentation scheme based on Zhang et al. (2001) (see Basart et al., 2012b).
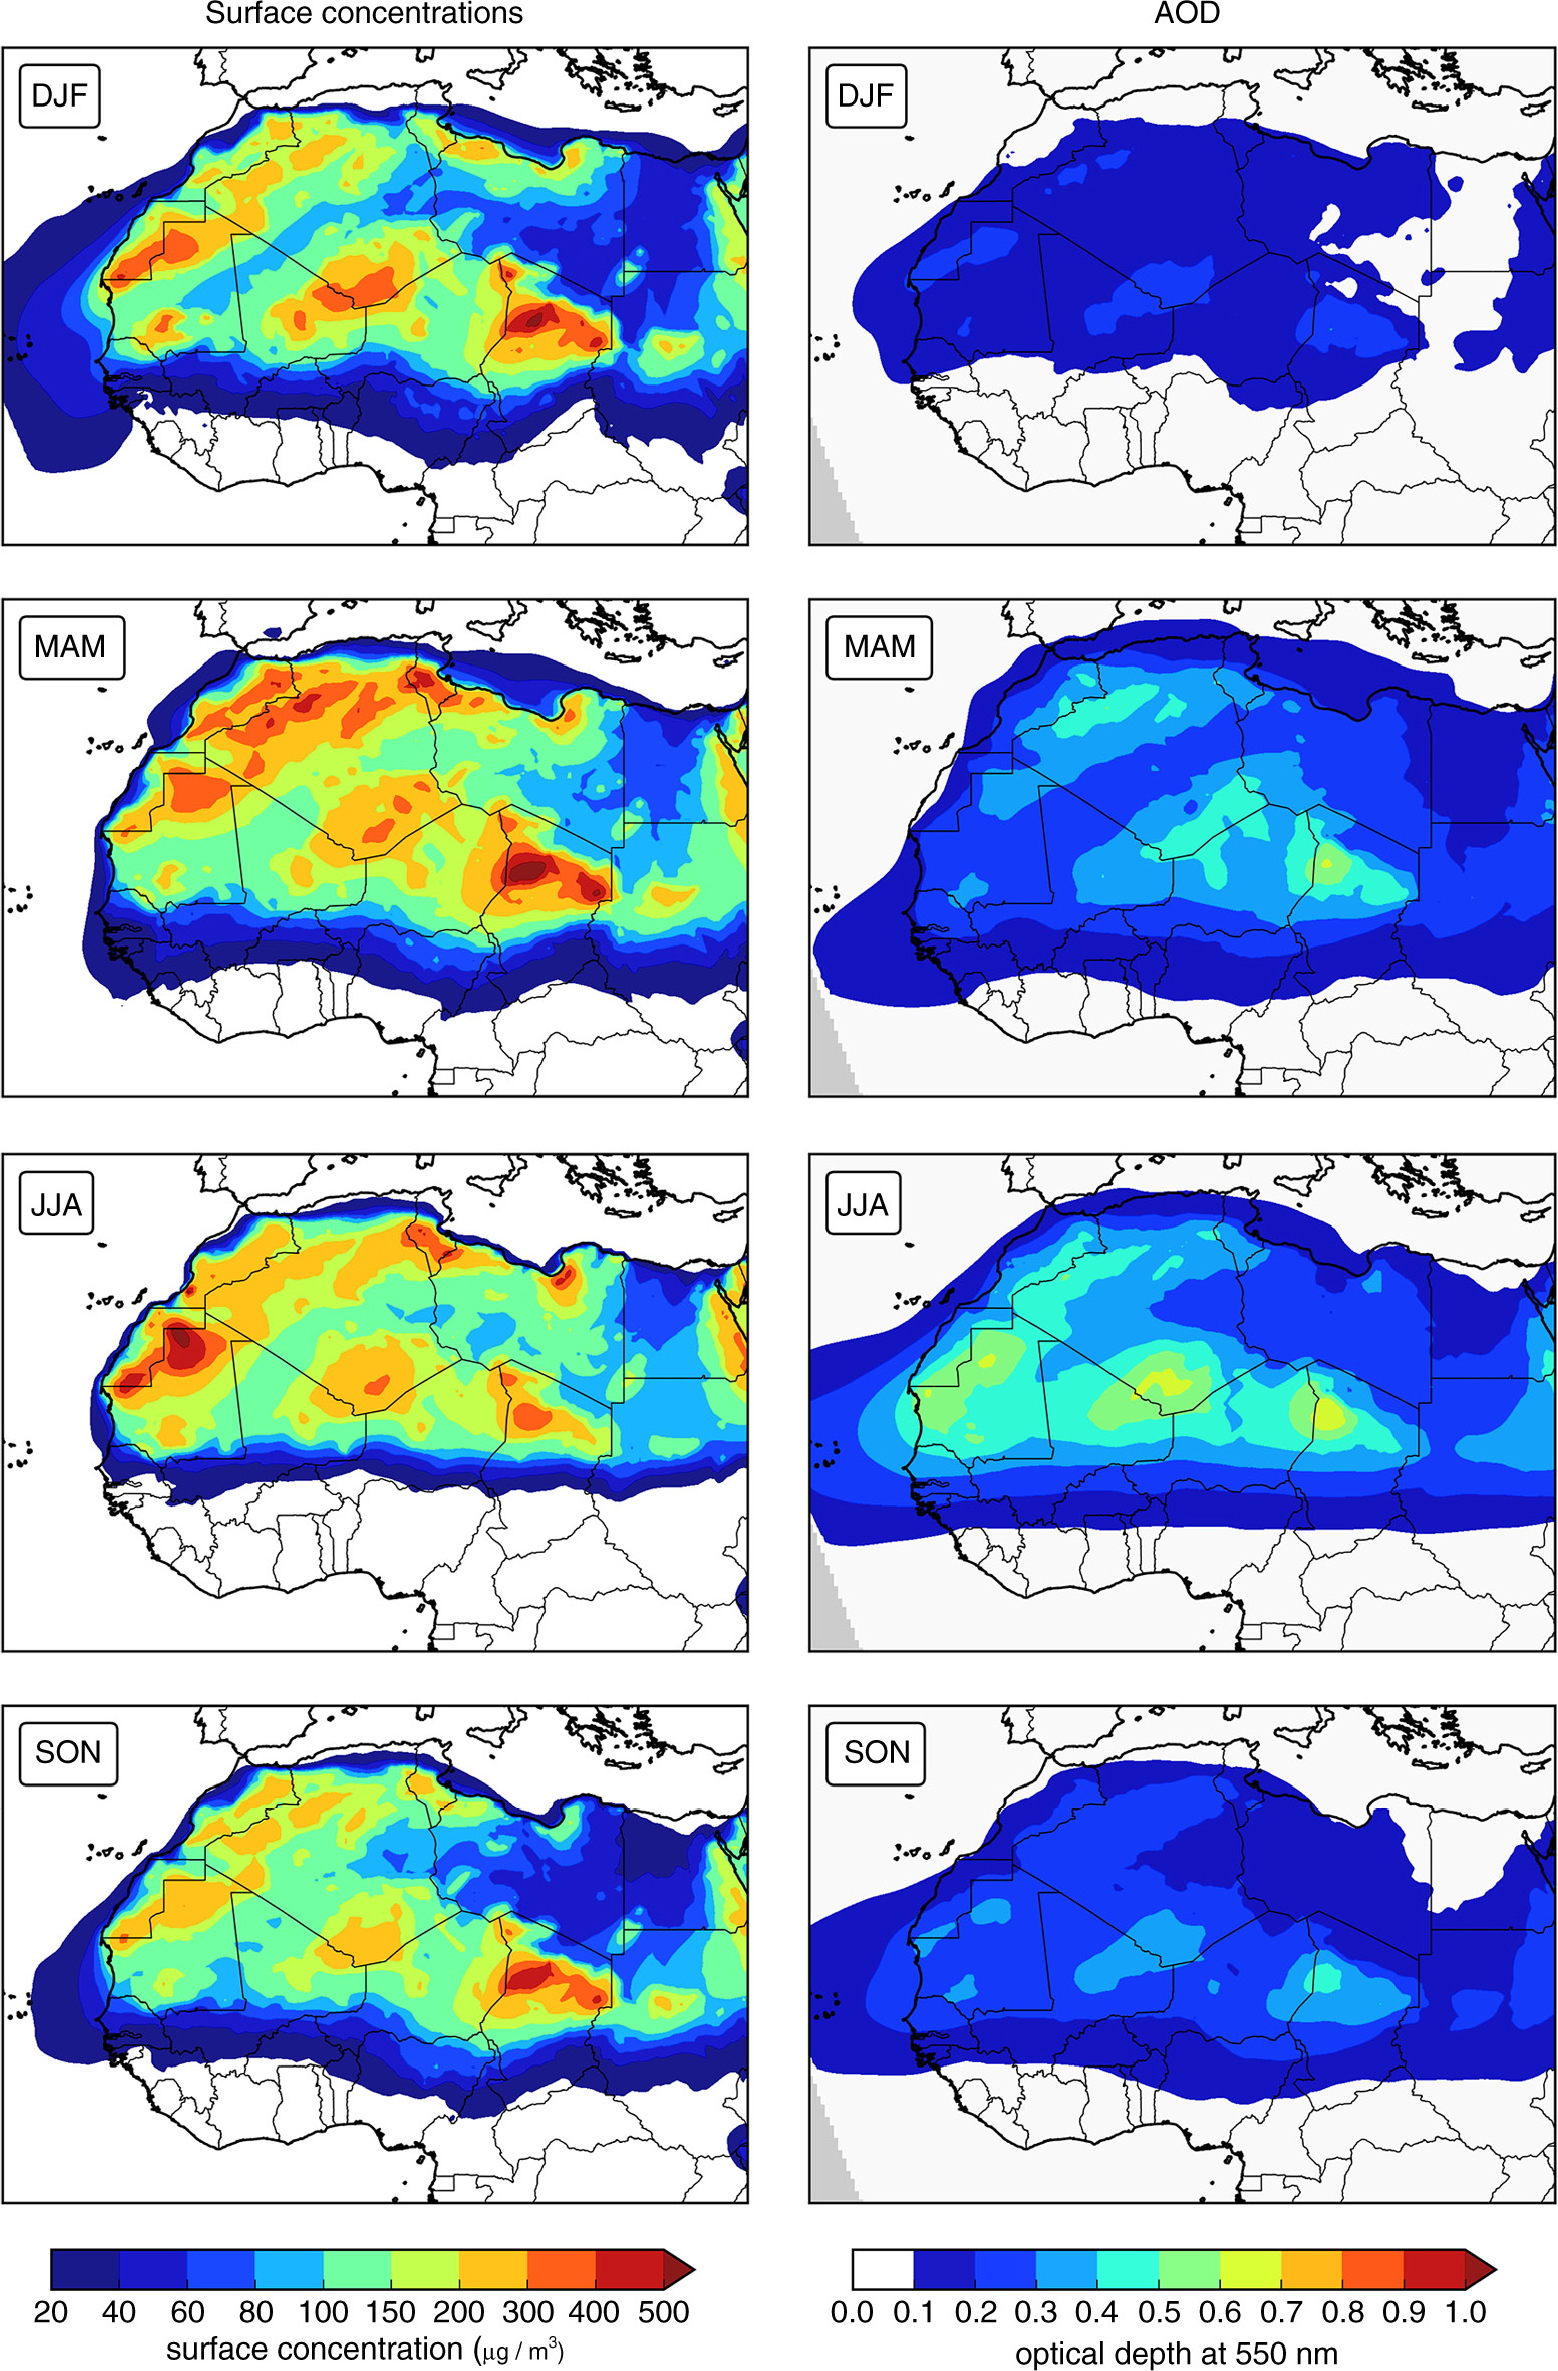
Fig. 7
Seasonal average of desert dust surface concentrations (left panels) and dust optical depth (right panels), for 2011, modelled with BSC-DREAM8b. DJF corresponds to December, January and February, MAM to March, April and May, JJA to June, July and August and SON to September, October and November.
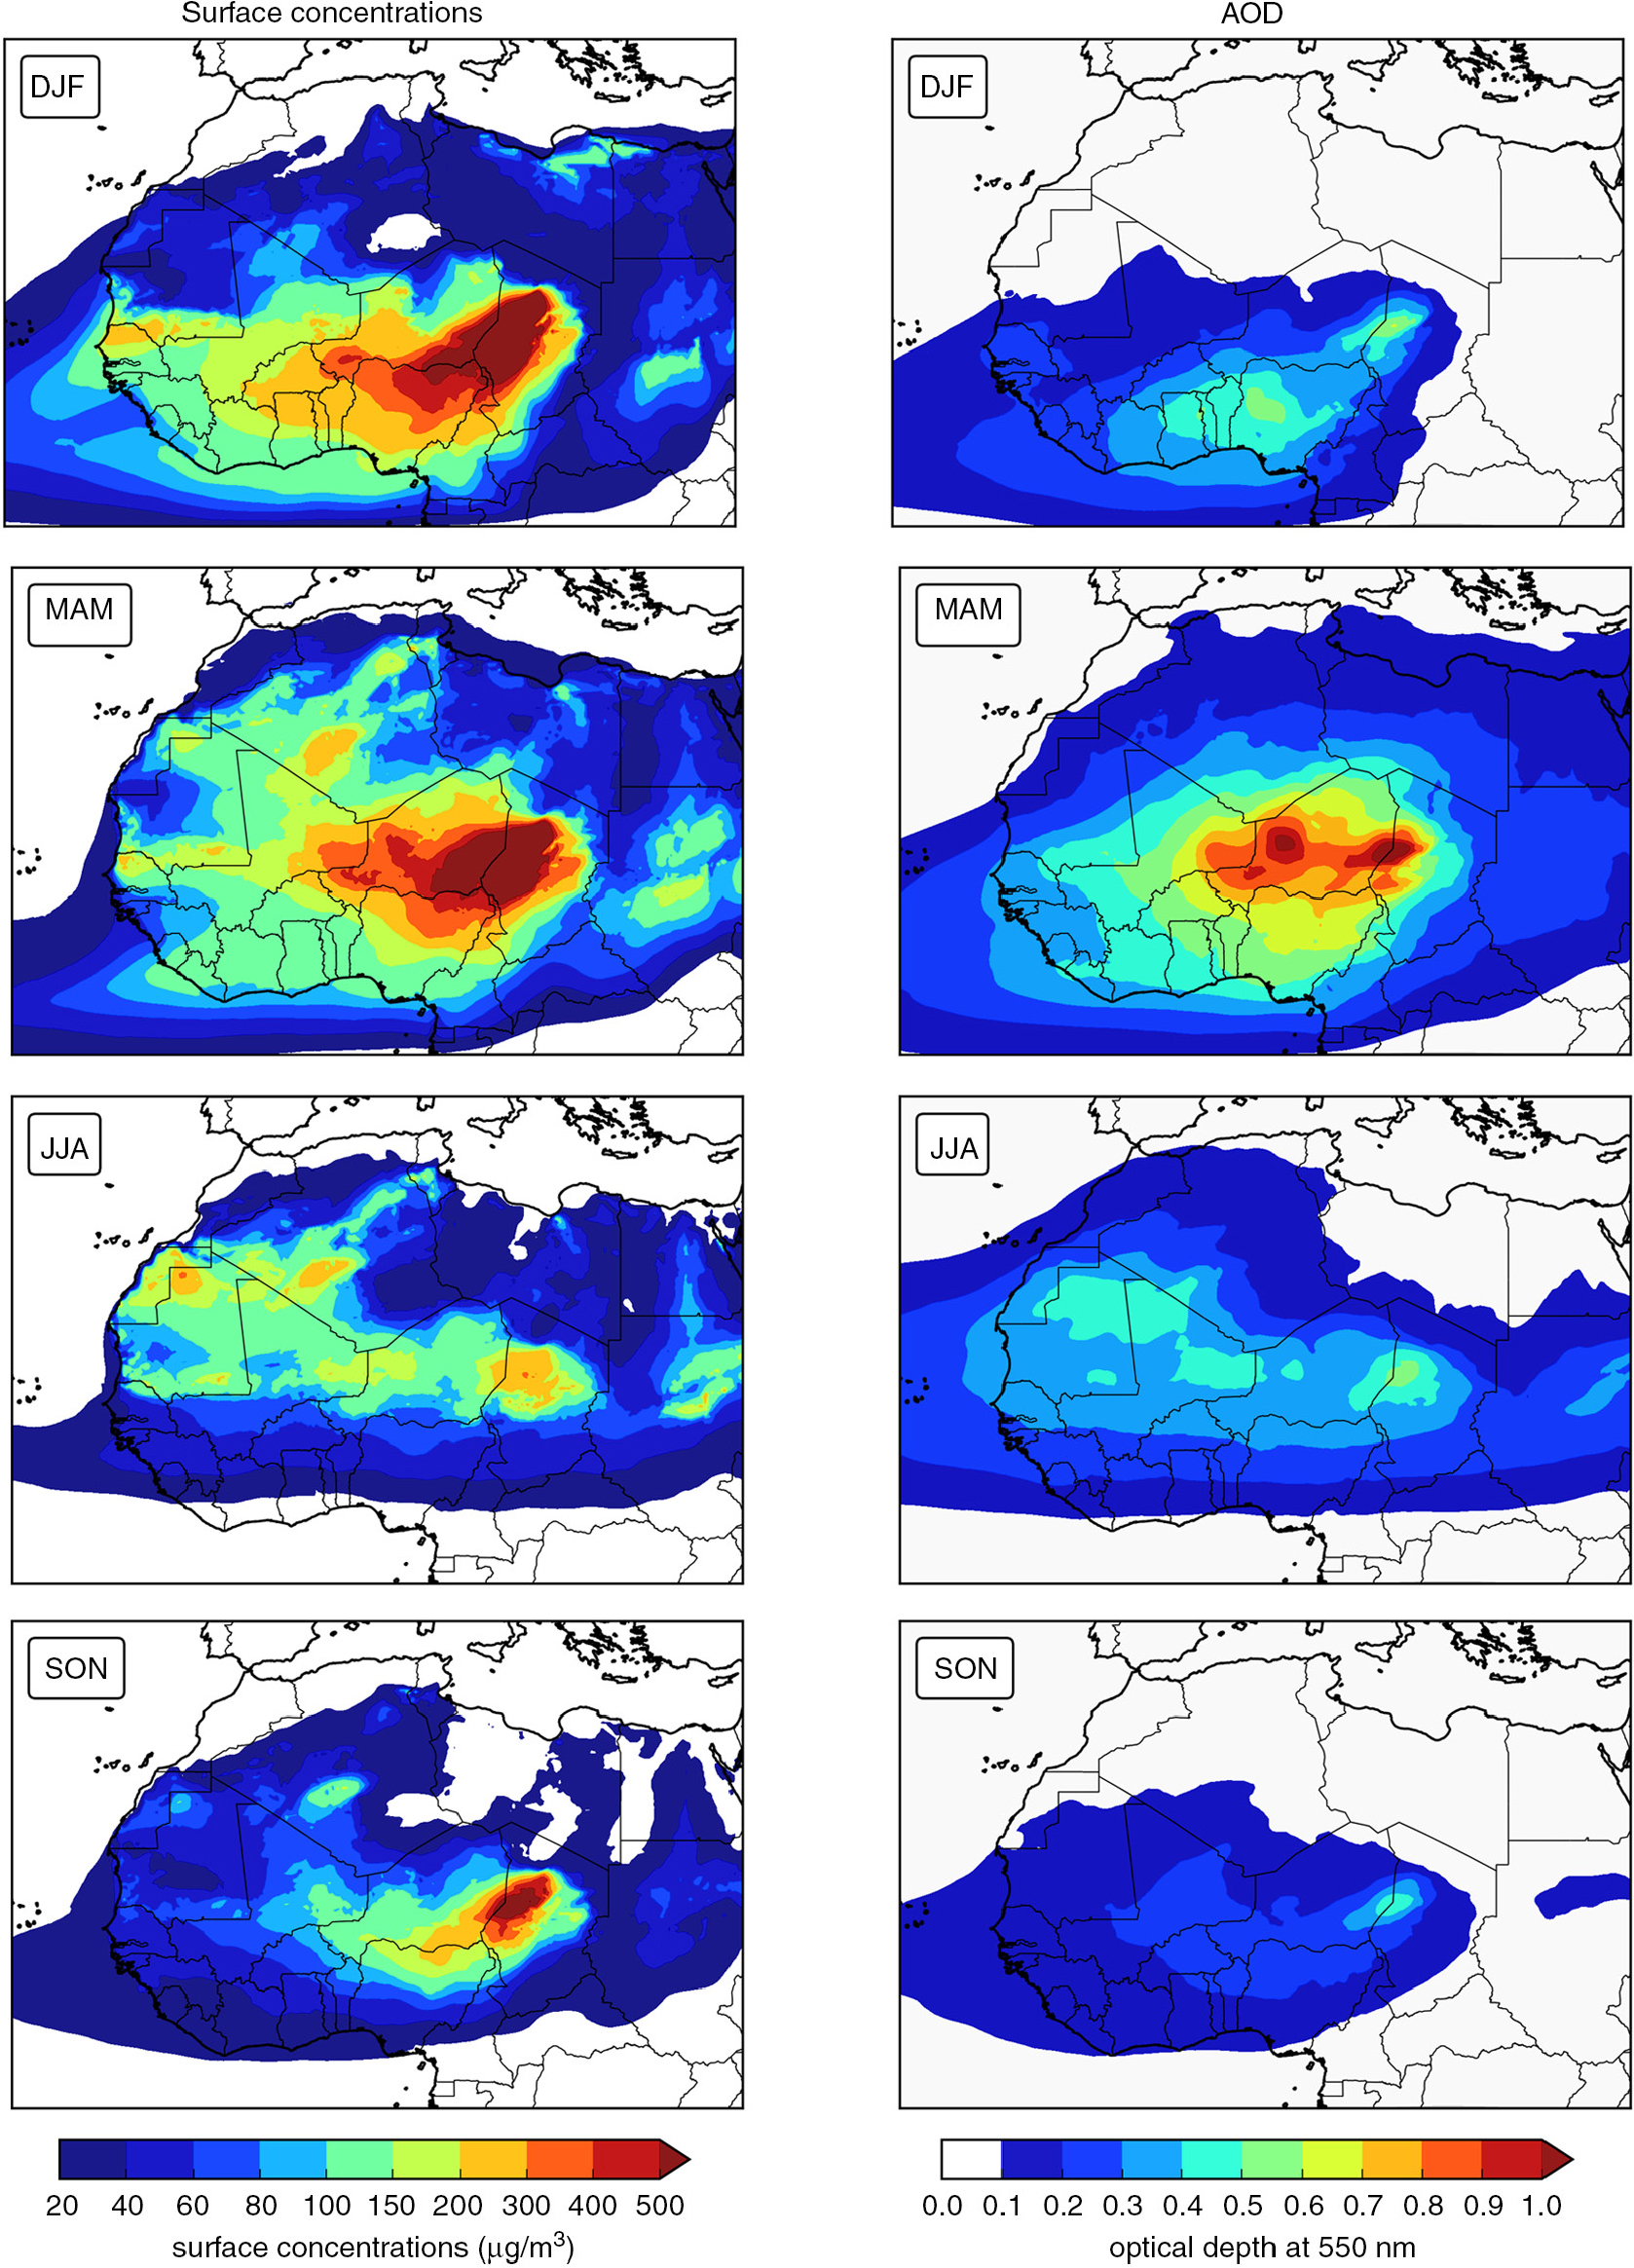
Fig. 8
Seasonal average of desert dust surface concentrations (left panels) and dust optical depth (right panels), for 2011, modelled with NMMB/BSC-Dust. DJF corresponds to December, January and February, MAM to March, April and May, JJA to June, July and August and SON to September, October and November.
On the other hand, the NMMB/BSC-Dust model shows lower AOD values in the summer in comparison to spring (Figure 8). In the recent work of Ashpole and Washington (2013) based on a classification of satellite-derived maps of daily dust occurrence frequency, it is shown that during summer the high dust occurrences in Central and Western Sahara are found in areas close to the Algeria-Mali-Niger border triple point (TP) or further to the northwest across the west half of the Mali-Algeria border (MAB). TP patterns occur far more frequently in June meanwhile, MAB patterns are more typical of July and August. Differences in surface concentration during summer between BSC-DREAM8b and NMMB/BSC-Dust (Figures 7 and 8, respectively) highlighted that NMMB/BSC-Dust tends to strongly underestimate the emissions in these particular desert dust source regions as indicated the lower dust surface concentrations modelled in summer. Furthermore, these lower values are associated with a decrease in the AOD at the end of August as also shown in the AERONET temporal series for Cape Verde (see Figure 5). Several causes could induce these summer AOD underestimations over the Sahara. During summer, dust emission is linked mainly to the low-level jets embedded in both the north-easterly Harmattan flow and the south-westerly West African monsoon flow and to cold pool outflows from convective complexes that are sometimes present over the southern Sahara (Ashpole and Washington, 2013; Marsham et al., 2013). These mesoscale convective systems cannot be well captured by global meteorological models or regional dust models (Marsham et al., 2011; Heinold et al., 2013). Additionally, as pointed out by Pérez et al. (2011), the topographical approach from Ginoux et al. (2001) included in the emission scheme of the NMMB/BSC-Dust model tends to omit the Mauritania/Mali border source. Other features of the present model configuration are being investigated as possible factors, such as the NCEP/FNL global meteorological input data used as initial and boundary conditions, possible missing sources in the model and the misrepresentation of small-scale atmospheric convection processes by the model.
In order to obtain the characteristic transport patterns, air masses reaching Cape Verde during 2011 were computed and clustered using the HYSPLIT Trajectory Model (Hybrid Single Particle Lagrangian Integrated Trajectory Model; Draxler and Hess, 1997, 1998) forced with NCEP's GDAS meteorological data. Air mass backward trajectories over 96 hours before arrival at Praia at 250 m were simulated four times per day, and a ‘bottom-up’ cluster methodology was used to group trajectories into clusters according to their characteristics. Typical meteorological parameters and mineral dust measured and predicted concentrations were then assessed for the several clusters, i.e., for the several transport patterns found. The optimum number of clusters was determined by assessing the total spatial variance as a function of the number of clusters, as proposed by Delcloo and Backer (2008). Eight trajectory clusters were found, and the mean trajectories of each cluster are depicted in Fig. 9, as well as their monthly distribution. Figure 10 depicts the measured and the BSC-DREAM8b and NMMB/BSC-Dust predicted PM10 concentrations in Praia, for the eight transport patterns found. Both models tend to show lower PM10 values in comparison to the measurements because the measurements include all the aerosols, while the model only considers desert dust. Nevertheless, similar features can be observed in a comparison between the models and measurements, and there are significant differences between the concentrations associated with each cluster. The trajectories grouped in cluster 1 and 2 occur mainly during the winter period (between October and February for cluster 1 and between December and March for cluster 2). Episodes grouped by these clusters are associated with the transport of dust westerly, from the belt extending from Morocco and northern Algeria to the Western Sahara to Cape Verde region. Indeed, the highest desert dust concentrations are found in air masses from cluster 2, followed by air masses from cluster 1, both for observations and model results. During summer, the air masses that reach Cape Verde at near-surface levels (250 m) describe typical trajectories along the North African coast.
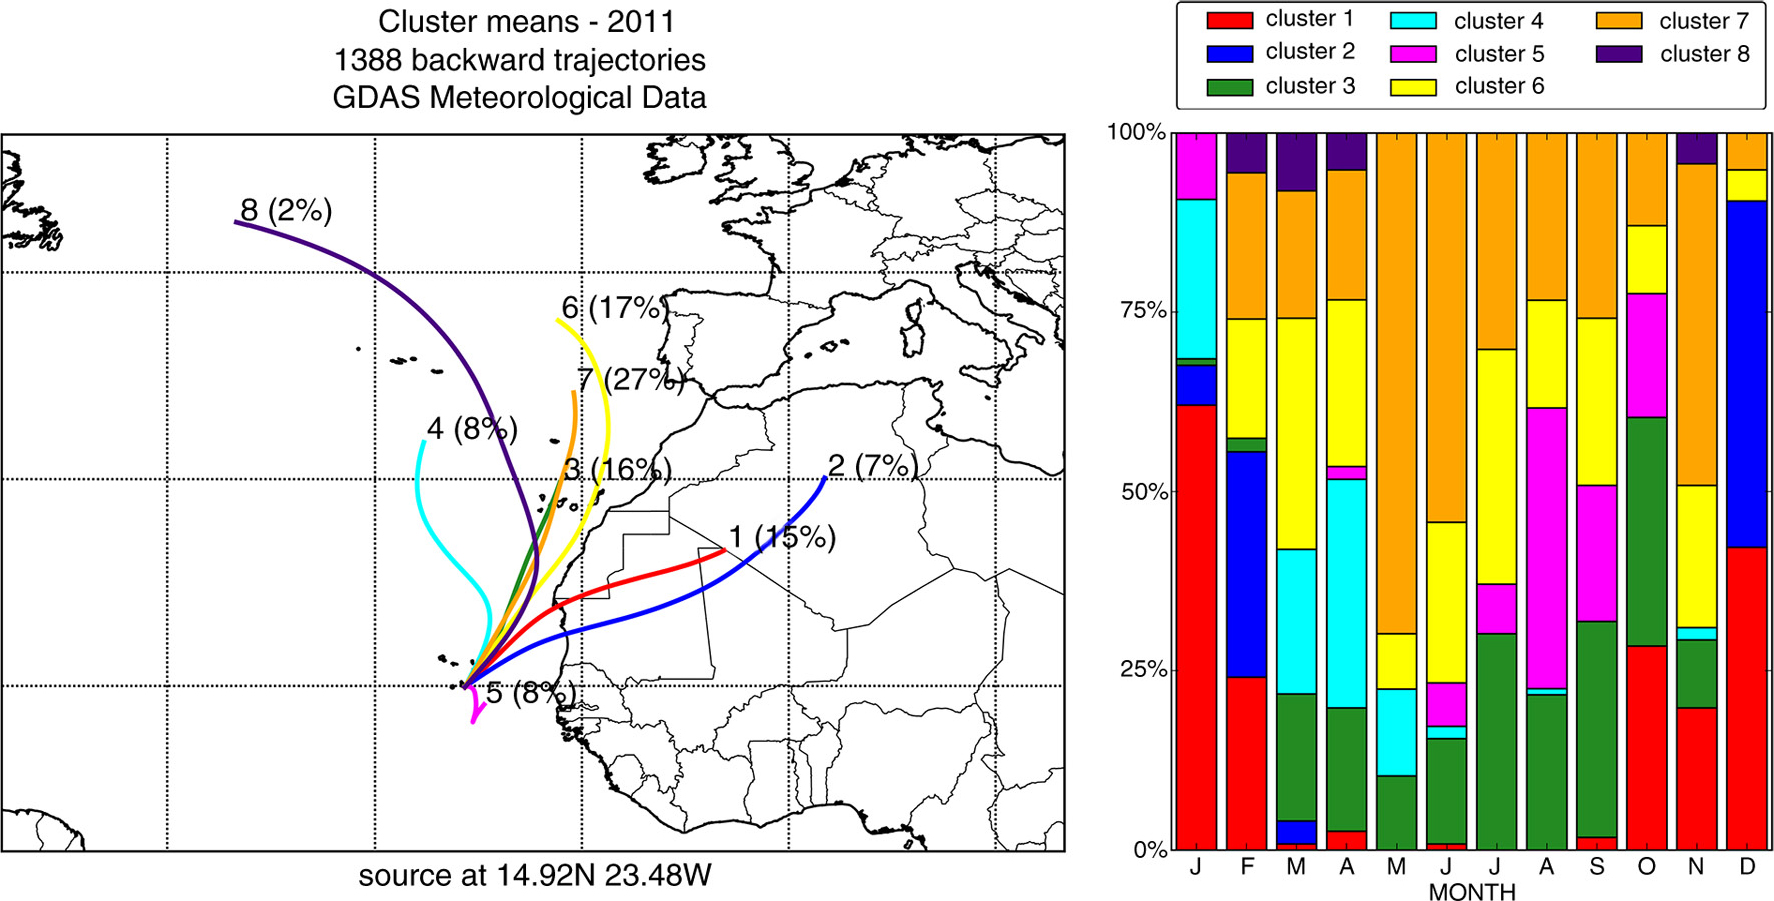
Fig. 9
(Left) Ninety-six-hour average back-trajectories for the eight clusters at Praia, Santiago Island (latitude: 14.92 N, longitude: 23.48 W), for 2011, with starting height at 250 m above sea level (percentages in parentheses reflect percentage of total 6-hour periods contributing to the averaged trajectory), and (right) their monthly distribution.
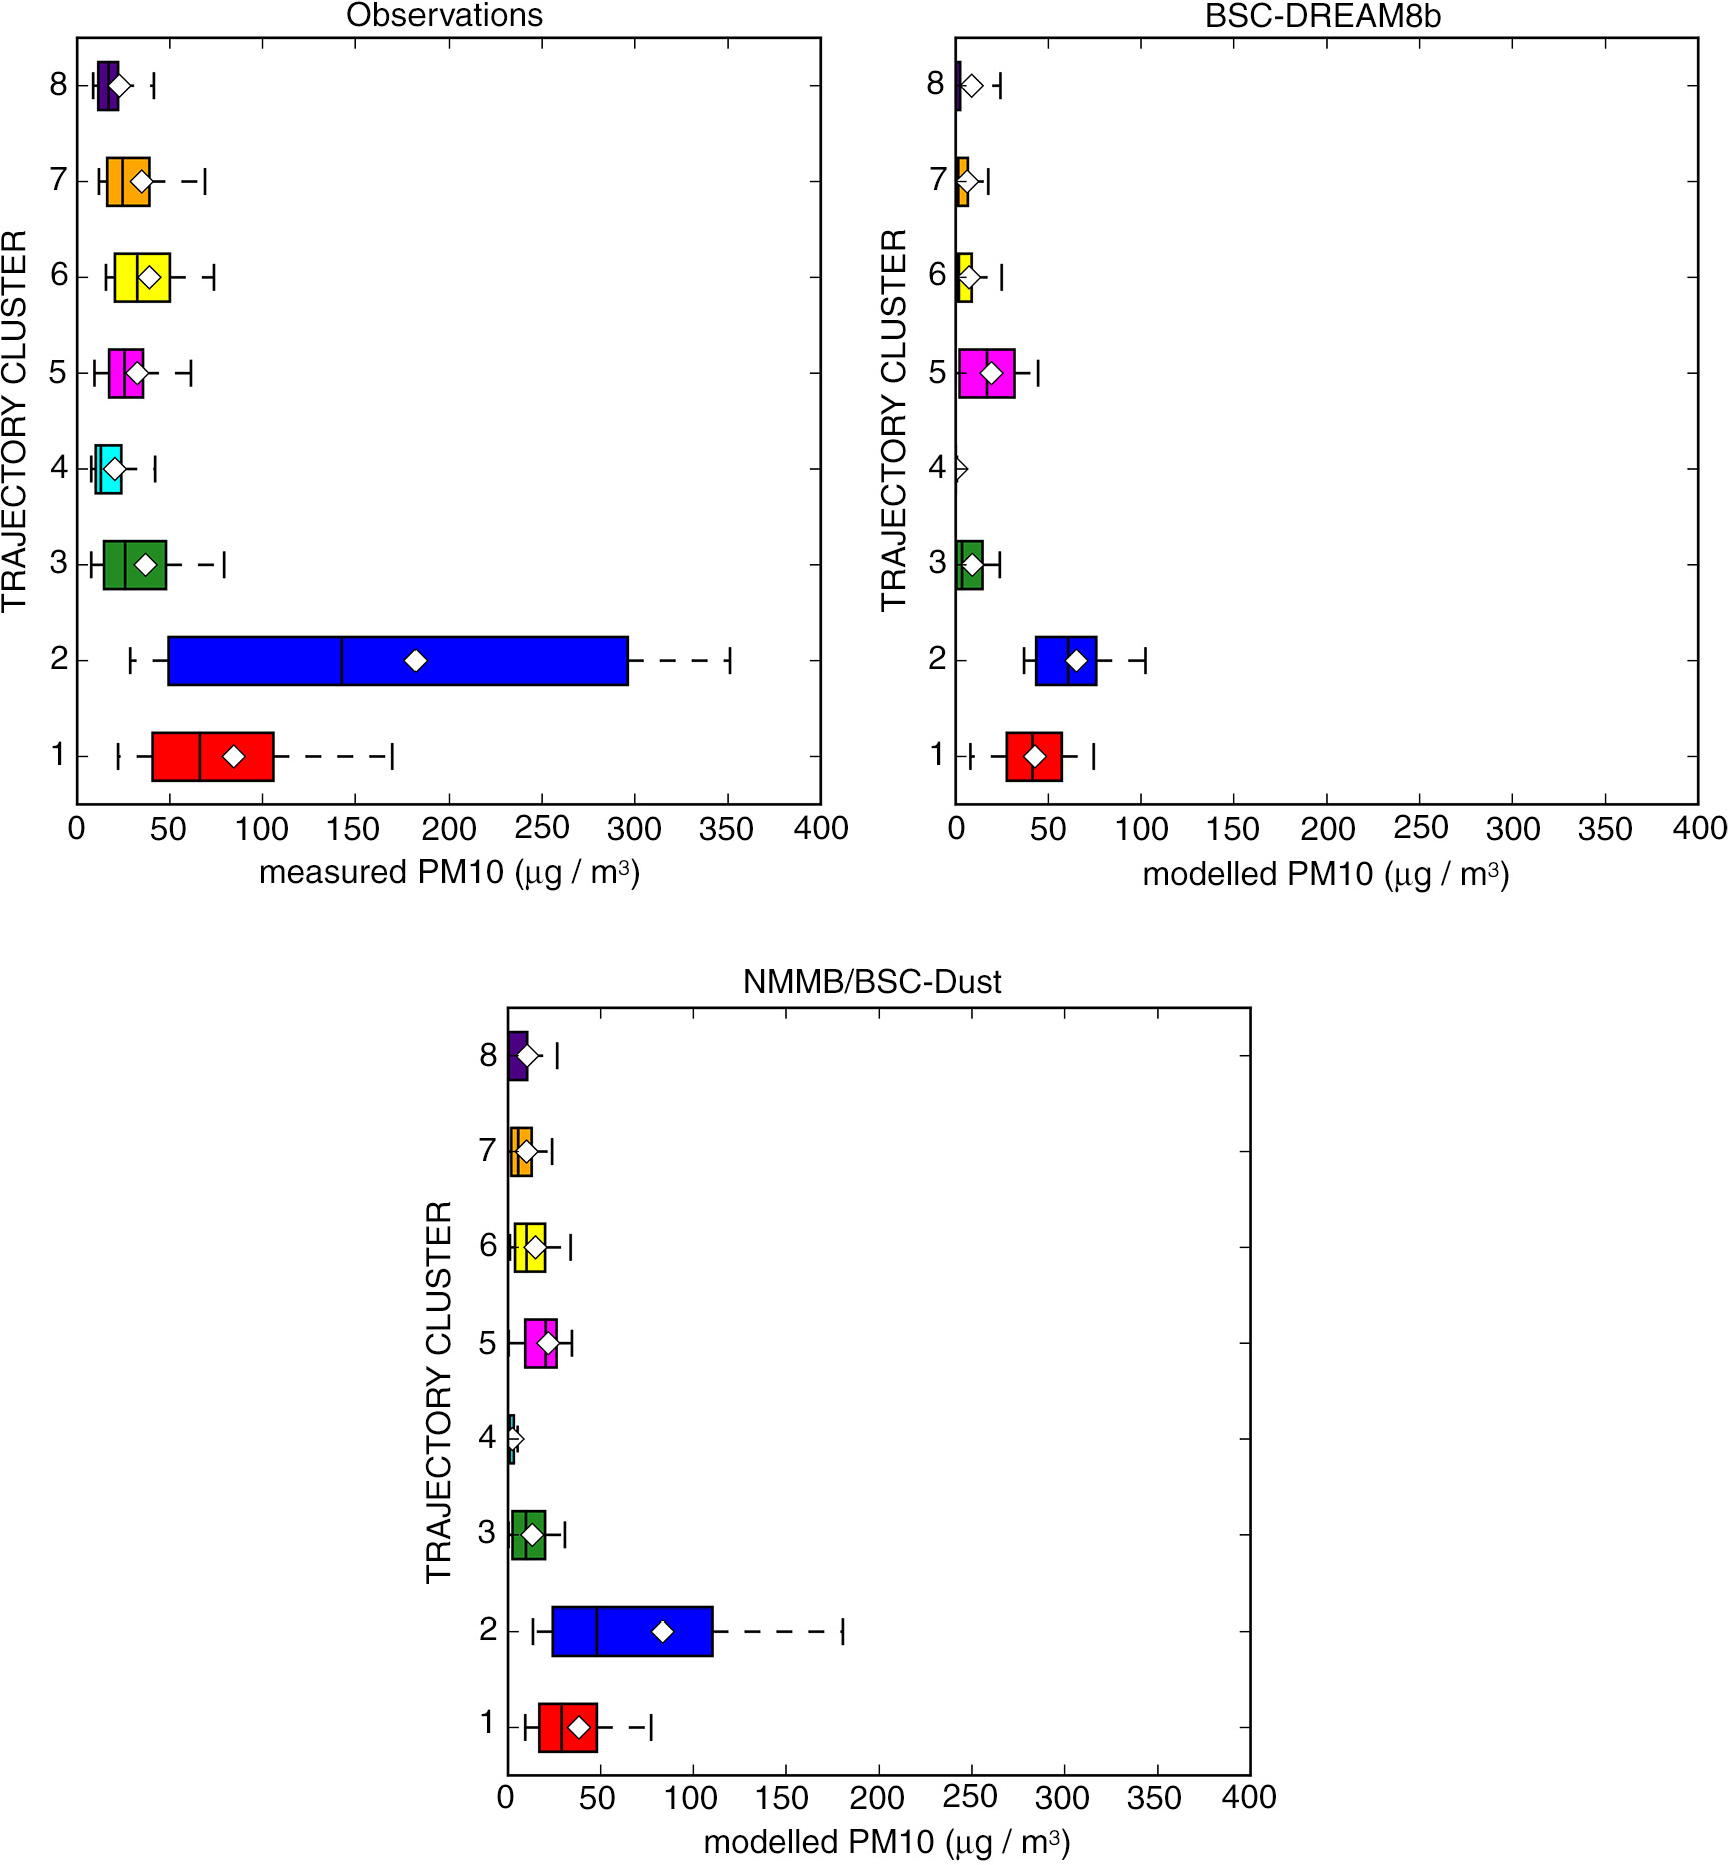
Fig. 10
PM10 (top) measured and BSC-DREAM8b and (bottom) NMMB/BSC-Dust modelled PM10 concentrations in Praia, during 2011, according to trajectory clusters. The left and right limits of the box represent the first and third quartiles and the band inside the box represents the median. The ends of the whiskers represent the 10th and the 90th percentiles. White diamonds represent the mean value. Outliers are not shown.
In order to analyse with more detail the winter situation, since this is when the transport of desert dust to Cape Verde at the surface level is stronger, we computed characteristic transport patterns for this period individually, following the same methodology described for the whole year 2011. Seven characteristic transport patterns were found and are presented in Fig. 11. Figure 12 presents the measured and BSC-DREAM8b and NMMB/BSC-Dust predicted PM10 concentrations that are linked to each cluster. The highest concentrations occur for cluster 6, followed by cluster 3 and cluster 1. The models exhibit the same behaviour. It is interesting to note that NMMB/BSC-Dust describes very well the concentrations linked to cluster 6, which occurred on days 5 and 6 of February, 27 and 28 of February, and 30 and 31 of December.
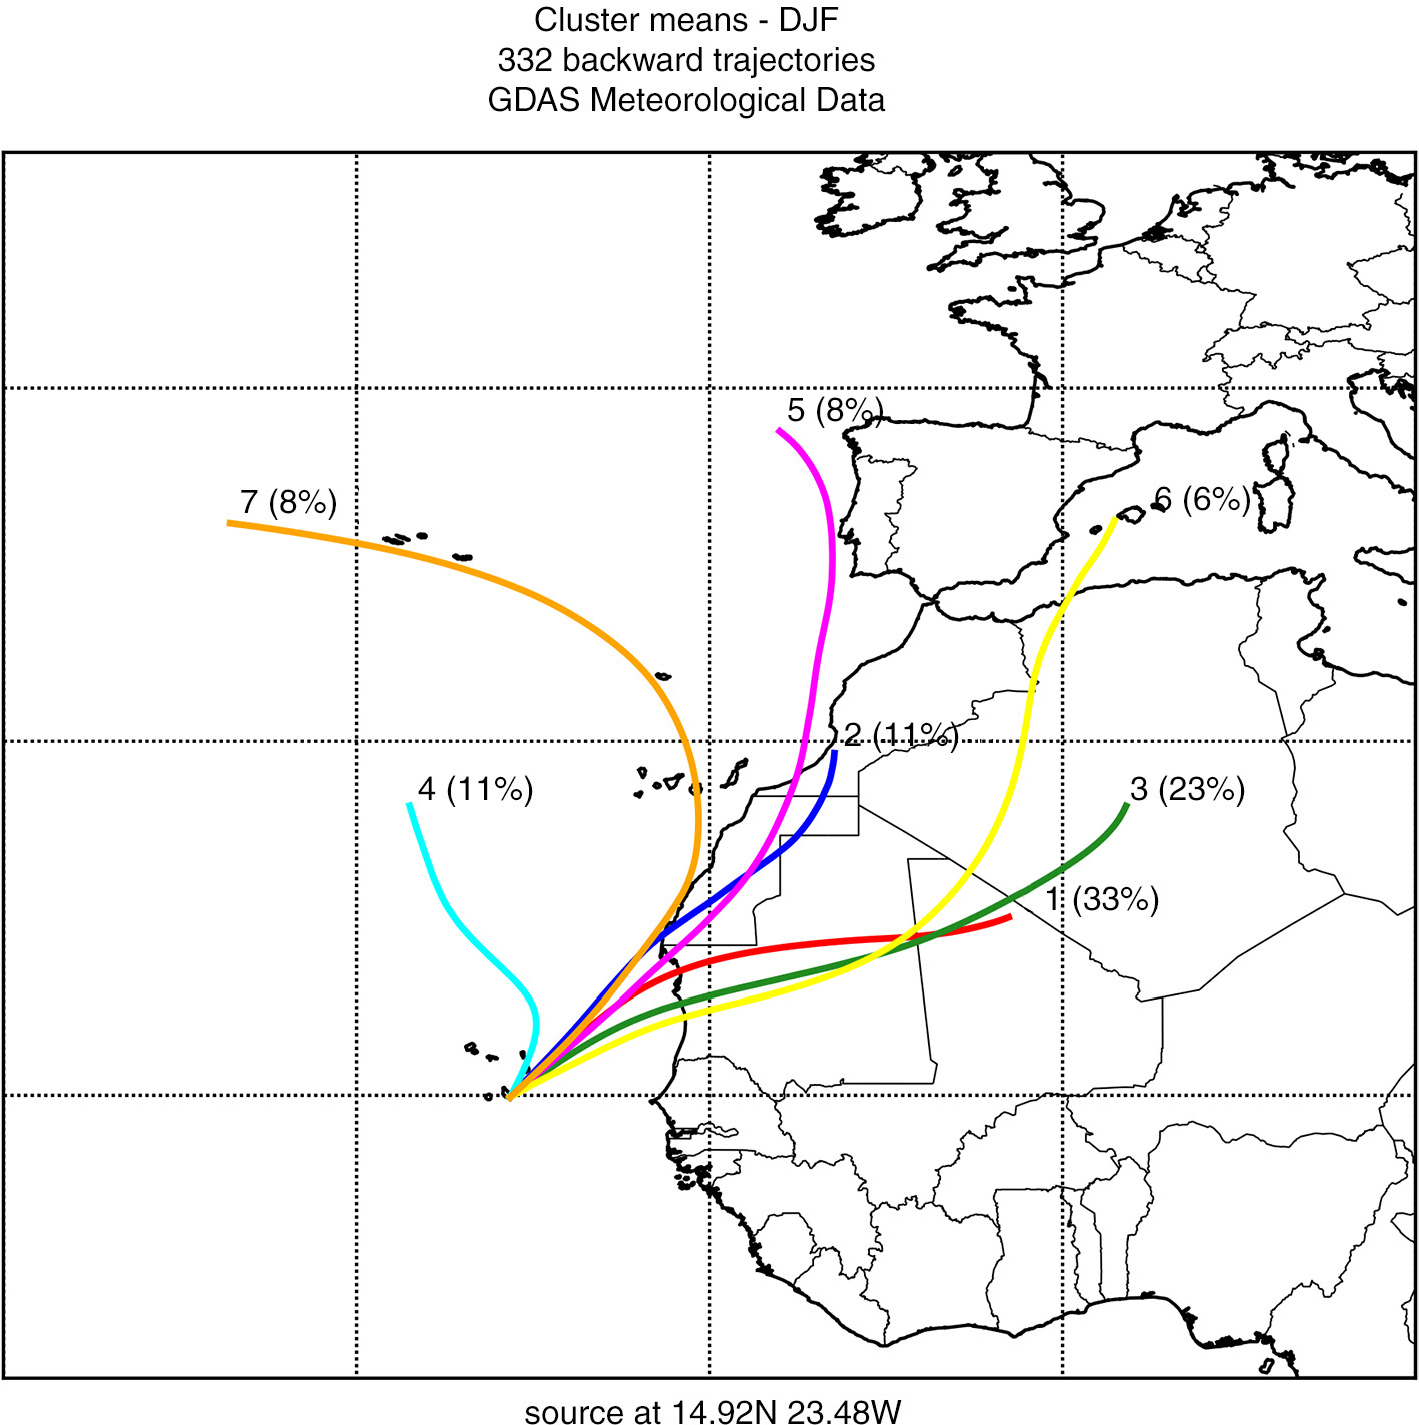
Fig. 11
Ninety-six-hour average back-trajectories for the seven clusters at Praia, Santiago Island (latitude: 14.92 N, longitude: 23.48 W), for December, January and February, with starting height at 250 m above sea level (percentages in parentheses reflect percentage of total 6-hour periods contributing to the averaged trajectory).
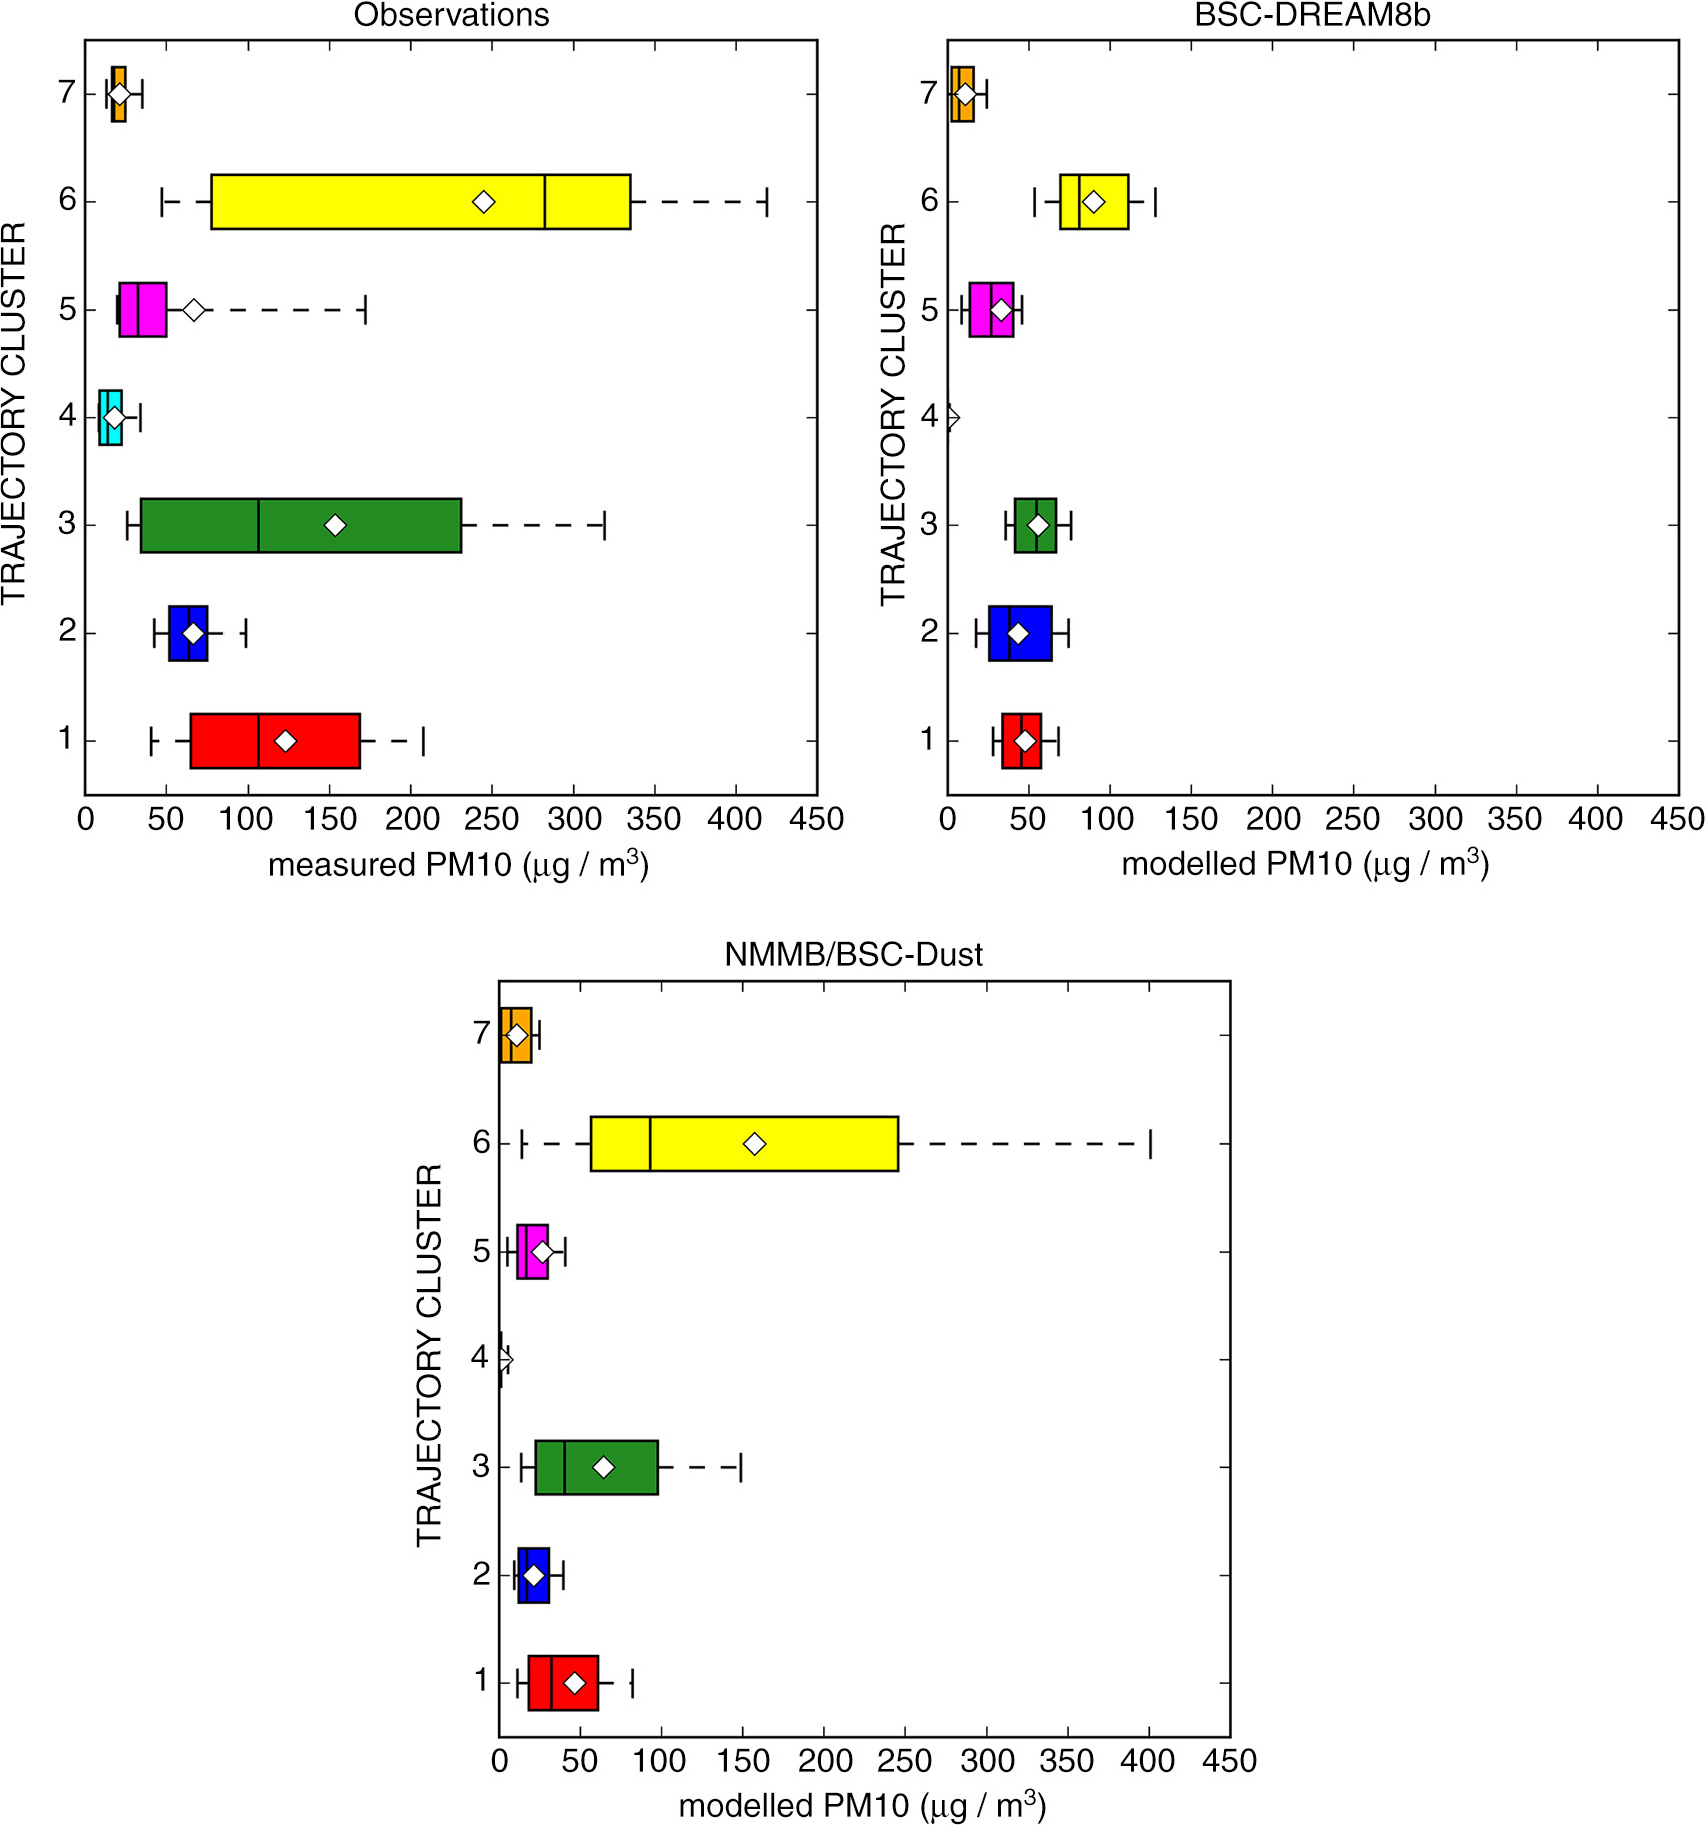
Fig. 12
PM10 (top) measured and BSC-DREAM8b and (bottom) NMMB/BSC-Dust modelled PM10 concentrations in Praia, for December, January and February, according to trajectory clusters. The left and right limits of the box represent the first and third quartiles and the band inside the box represents the median. The ends of the whiskers represent the 10th and the 90th percentiles. White diamonds represent the mean value. Outliers are not shown.
The BSC-DREAM8b and the NMMB/BSC-Dust models estimate, respectively, that the Bodélé region is responsible for 20 and 40% of the emissions from North Africa, and that this source area emits mainly during winter and spring. According to Schepanski et al. (2009), a maximum contribution of dust transported from this source towards the Cape Verde Islands is found during the winter period. Although our results also show that PM surface concentrations are higher during the winter period (see Fig. 2), the backward trajectories analysis does not indicate Bodélé as one of the main contributors to the PM recorded in Cape Verde. This is supported by Gross et al. (2013), who used the oxygen isotopic composition of inorganic phosphate (d18Op) in dust particles sampled in Cape Verde to identify the source of phosphorus in dust blown from Africa. Their results indicated that the dust-P sampled in Cape Verde was derived from two major sources: marine sediments and igneous rocks, having no indication of a Bodélé diatomite contribution. Indeed, the air masses responsible for the highest aerosol concentrations in Cape Verde (cluster 2) describe a path over the central Saharan desert area in Algeria, Mali and Mauritania before reaching the Atlantic Ocean. In the scope of SAMUM-2, Weinzierl et al. (2011) computed similar trajectories (relative to the day 19 January 2008, flight L05) associated with particles dominated by mineral dust. Although the computed trajectories did not directly cross the centre of strong dust activation areas, they passed the edges of the dust activation areas in Mali and Algeria, where they were assumed to have obtained their aerosol loading.
4. Summary and conclusion
This work provided the characterisation of a complete annual cycle of aerosol in Cape Verde. Seasonal patterns were analysed based on a combination of mineral dust modelling with site aerosol measurements from the CV-DUST Project and optical column data from the AERONET network.
From October till March, significant seasonal intrusions of dust from North West Africa affect Cape Verde at surface levels when atmospheric concentration levels in Praia exhibit very high levels (PM10 observed concentrations reach hourly values up to 710 µg/m3). High AOD values were observed for Sal Island on the same days as the peaks observed for surface concentration on Santiago Island, highlighting the extent of episodes of long-range transport of desert dust from the African continent. While surface concentrations were higher during winter, AOD were higher during summer, indicating that during this period dust is transported from North Africa at higher altitudes.
The BSC-DREAM8b and the NMMB/BSC-Dust models were applied for a 1-yr period (2011) over the domain covering Northern Africa, Europe and the Middle East to complement the present analysis. This is the first time that these models have been used to evaluate surface concentration and size distribution in Africa over a complete annual cycle. Both models are able to reproduce the majority of the dust episodes, although the magnitude of the predicted concentrations was lower than those observed. While the dust models take into account only aeolian mineral particles emitted from the deserts, the measurement dataset may also reflect non-dust aerosols like sea salt or biomass-burning particles, secondary pollutants and local sources. Results from NMMB/BSC-Dust are in better agreement with observed PM concentrations and AOD throughout the year. For this model, the comparison between observed and modelled PM10 daily averaged concentrations yields a correlation coefficient of 0.77, denoting the importance of mineral dust contribution for the total aerosol mass, and a 29.0 µg/m3 ‘bias’, of which 12–14 µg/m3 is explained by the observed sea salt contribution to PM10 during 2011. These results allow rough estimation that on a yearly basis, 42% of the PM10 mass observed in Cape Verde is associated with dust transported from North African deserts. PM size distribution modelled with BSC-DREAM8b seems to be in greater agreement with observations than NMMB/BSC-Dust, since the estimated contribution of the larger particles for the total dust mass was higher.
Seasonal differences simulated by the models in terms of dust emissions, air mass circulations and PM concentrations are important for the analyses of observed episodes in Cape Verde. Possible dust-source areas that may affect the Cape Verde region were analysed and found to have distinct seasonal patterns. The most active source in terms of dust emission was the Bodélé region, mainly between December and May. Other significant sources include the Algeria–Morocco region, West Sahara–Mauritania, the Libya desert, Algeria–Tunisia and Algeria–Mali. According to the backward trajectories analysis, the air masses responsible for the highest aerosol concentrations in Cape Verde describe a path over the central Saharan desert area in Algeria, Mali and Mauritania before reaching the Atlantic Ocean. The NMMB/BSC-Dust model has very good performance in describing these highest concentrations that occur during the winter. On the other hand, this model strongly underestimates the emissions in the Central and Western Sahara during summer.
This work contributes to the characterisation of the processes and sources responsible for aerosol loading in the Cape Verde region. This was one of the goals of the CV-DUST Project, a joint initiative of Aveiro University (UA) and the Technological and Nuclear Institute (ITN), together with Cape Verde University (Uni-CV) and with support from the CVAO and the BSC-CNS. Moreover, this work includes an evaluation exercise of two dust models widely used for operational forecasts that are used on the Sand and Dust Storms Warning Advisory and Assessment System (SDS-WAS) and for research, in a strategic site to study Saharan Atlantic transport. This work is thus useful to all the end users of these models, allowing a comparison between the models and identification of areas where further improvements are needed, such as in terms of model size distribution.
5. Acknowledgements
This work was supported by the Portuguese FCT through the CV-DUST Project (PTDC/AAC-CLI/100331/2008), the PhD fellowship of C. Gama (SFRH/BD/87468/2012) and the Post-Doctoral fellowship of J. Ferreira (SFRH/BPD/40620/2007). J.M. Baldasano and S. Basart acknowledge the CICYT project (CGL2010-19652 and CGL2013-46736), the ‘Supercomputación and e-ciencia’ project (CSD2007-0050) from the Consolider-Ingenio 2010 programme and Severo Ochoa (SEV-2011-00067) programme of the Spanish Government. The authors gratefully acknowledge the NOAA Air Resources Laboratory (ARL) for the provision of the HYSPLIT transport and dispersion model and the READY website (http://www.arl.noaa.gov/ready.html) from which the meteorological data have been downloaded and used to force HYSPLIT, as well as Didier Tanri for his effort in establishing and maintaining Capo Verde AERONET site. BSC-DREAM8b and NMMB/BSC-Dust simulations were performed on the Mare Nostrum supercomputer hosted by Barcelona Supercomputing Center–Centro Nacional de Supercomputación (BSC-CNS).