
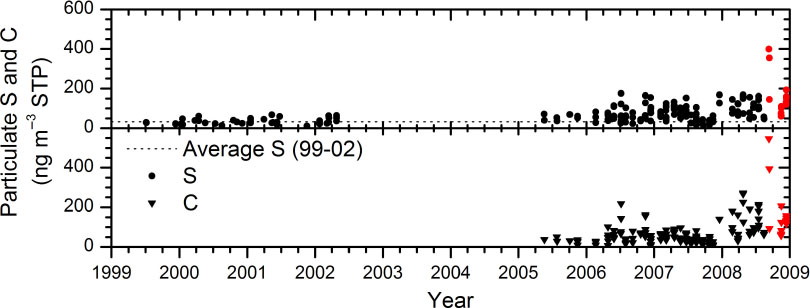
Fig. 1
Temporal variations of concentrations of particulate sulphur and carbon (ng m−3 STP) in the northern hemisphere LMS. Red dots illustrate observations after the eruption of Kasatochi. The dashed line shows the geometric average particulate sulphur concentrations during 1999–2002.
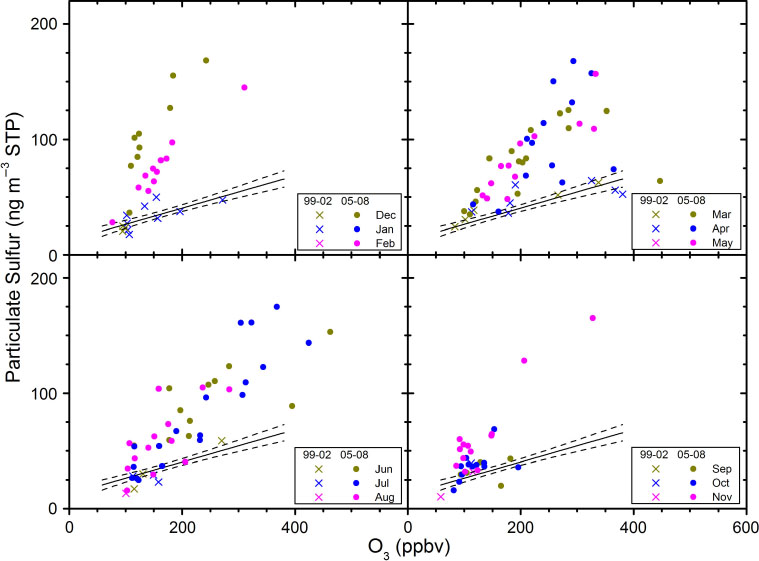
Fig. 2
Concentration of particulate sulphur vs. ozone for stratospheric samples (potential vorticity > 2 PVU) collected in the northern hemisphere. Upper left: winter (December, January, February). Upper right: spring (March, April, May). Lower left: summer (June, July, August). Lower right: fall (September, October, November). A regression model (full line), with 95% confidence interval (dashed lines) based on the 1999–2002 data is used to facilitate the comparison to the 2005–2008 data.
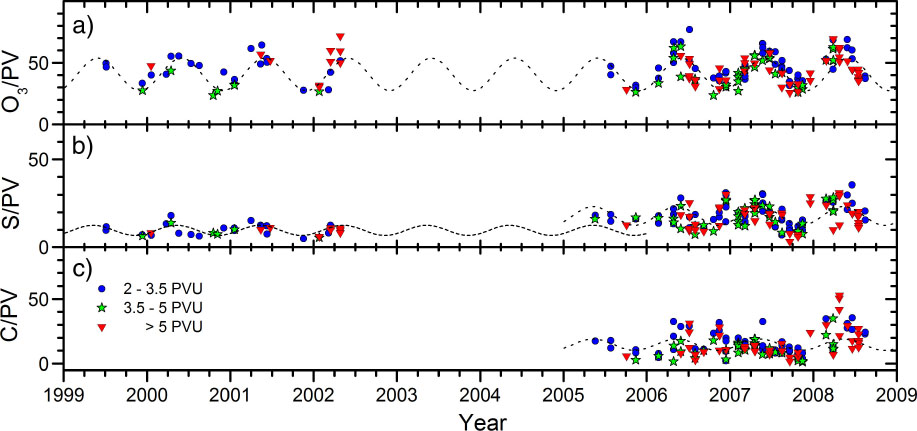
Fig. 3
Temporal trends of ratios to potential vorticity (PV) for a) ozone (ppbv PVU−1), b) particulate sulphur (ng m−3 STP PVU−1) and c) particulate carbon (ng m−3 STP PVU−1). Sine functions, based on ozone to PV ratios in a) are used in b) and c) to guide the eye.
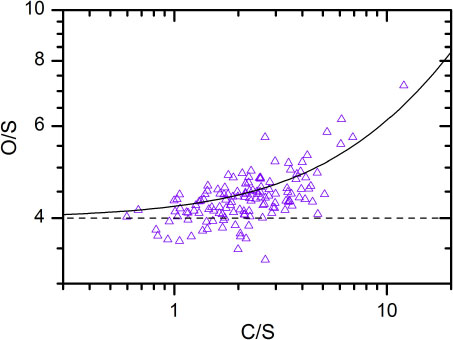
Fig. 4
Oxygen to sulphur vs. carbon to sulphur molar ratios. The dashed line represents O/S = 4, and the full line shows the best fit, i.e. O/S = 4+0.2 C/S.
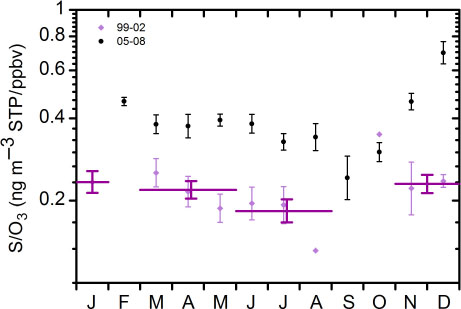
Fig. 5
Ratios of particulate sulphur to ozone mixing ratio (Unit: ng m−3 STP ppbv−1) for the periods 1999–2002 and 2005–2008, expressed as monthly geometric averages (black and light purple). Purple lines denote averages in the period 1999–2002 for the months; January, March–May, June–August and November–December. Error bars represents standard errors.
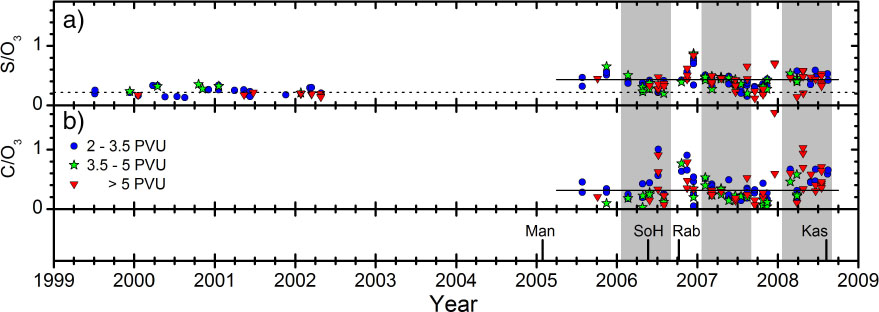
Fig. 6
Ratios of particulate sulphur and carbon concentration to ozone mixing ratio (Unit: ng m−3 STP ppbv−1), for a) particulate sulphur and b) particulate carbon for stratospheric samples. Full and dashed horizontal lines represent geometric averages for the periods 2005–2008 and 1999–2002, respectively. The February–August period is indicated by a grey background. The four discussed volcanic eruptions (Manam, Soufriere Hills, Rabaul and Kasatochi) are indicated by vertical lines.
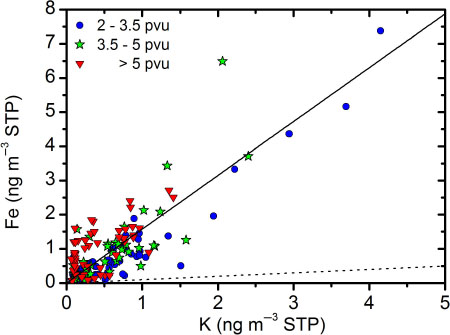
Fig. 7
Mass concentrations of Fe vs. K (ng m−3 STP) for stratospheric samples. Regression model shown by full line illustrating a ratio of 1.58 ng Fe/ng K. Dotted line shows Fe/K mass ratio of 0.1, a typical ratio for effluents from biomass burning.
Table 1. Explosive volcanic eruptions most relevant for this study in the period 2005–August 2008

Fig. 8
Geometric average of ratios (a) particulate sulphur (b) carbon and (c) carbon + 3 sulphur concentration to ozone mixing ratio (ng m−3 STP ppbv−1) for the February–August periods of 2000/2001, 2006, 2007 and 2008.