Have a personal or library account? Click to login
Stable bromine isotopic composition of atmospheric CH3Br Cover

Stable bromine isotopic composition of atmospheric CH3Br

Open Access
|Jan 2013

Figures & Tables

Table 1

Results from concentration and isotope measurements
Sample IDField campaignSample dateδ81Br [SMOB] (‰)RSD2 (‰)NMixing ratio pptSD pptSample typeSample volume (m3)BT regionBL height (m)1Abisko2 August 2011−0.010.12210.42.3Free air4.515832Abisko2 August 2011−0.140.4319.32.1Free air2.711183Abisko3 August 2011−0.040.43114.13.2Free air3.414974Abisko3 August 20110.480.4315.41.2Free air3.611855Abisko3 August 2011−0.250.4315.01.1Dry soil3.0––6Abisko4 August 20110.880.4316.61.5Dry soil3.0––7Abisko4 August 20110.150.4311.70.4Dry soil4.6––81Abisko5 August 20110.040.43110.42.3Damp soil3.8––9Abisko5 August 20111.420.4318.21.8Damp soil3.6––10Stockholm29 September 2011−0.080.43315.81.6Free air4.8445011Stockholm3 October 20111.170.43112.61.4Free air4.8252712Stockholm4 October 20110.810.43114.51.5Free air4.82147613Stockholm5 October 20111.750.13212.61.3Free air4.82101614Stockholm18 October 20110.470.27212.91.6Free air5.0596015Stockholm19 October 2011−0.470.43118.31.8Free air4.83872

[i] 1This sample was compromised by free air because of leakage around the sampler intake and is not included in statistical calculations.

[ii] 2The standard deviations for isotope values based on one measurement were set to 0.43‰ (in italic), which was the largest value, found throughout this campaign for triple injections.

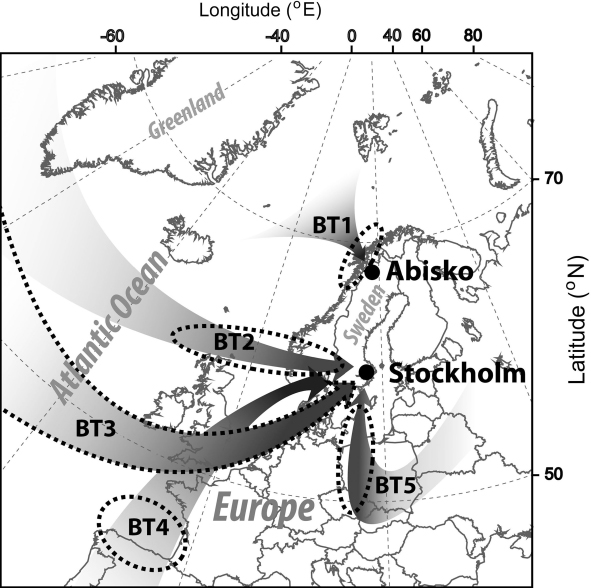
Fig. 1

Back trajectories (BTs) of sampled air, as determined by HYSPLIT4 model. The arrows are describing the path of the air mass BTs and the dotted ellipses are indicating the area where it was last in contact with the ground (i.e. in the boundary layer). The BT 3 contact region is described by the entire arrow (dotted margins).
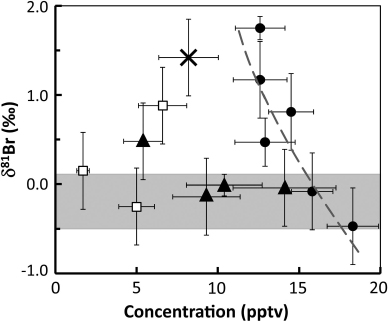
Fig. 2

Methyl bromide isotope composition as a function of concentration for Stockholm free air (filled circles), Abisko free air (open squares), Abisko dry soil air (filled triangles) and Abisko damp-soil air (cross). A logarithmic regression line (dashed, grey) shows the enrichment in δ81Br as the CH3Br concentration decreased in the Stockholm free air. The grey-shaded area indicates the lowest values found throughout both field campaigns and indicates a range of suggested background composition.

Language: English
Page range: 21040 - 21040
Submitted on: Apr 4, 2013
Accepted on: Aug 20, 2013
Published on: Jan 1, 2013
Published by: Stockholm University Press
In partnership with: Paradigm Publishing Services

© 2013 Axel Horst, Brett F. Thornton, Henry Holmstrand, Per Andersson, Patrick M. Crill, Örjan Gustafsson, published by Stockholm University Press
This work is licensed under the Creative Commons Attribution 4.0 License.