
1. Introduction
Carbonyl sulphide (COS) has almost no net climate impact (Brühl et al., 2012). However, it has recently attracted interest as this trace gas, which is consumed and not respired by plants at typical atmospheric concentration levels, could provide a valuable constraint on photosynthesis (Montzka et al., 2007; Campbell et al., 2008; Asaf et al., 2013, and references therein). An additional constraint on the photosynthetic uptake of CO2 (i.e. the gross CO2 flux) is needed because it is impossible to directly measure this flux at the ecosystem scale. Indeed, in order to assess canopy gross CO2 fluxes, eddy covariance measurements of canopy net CO2 fluxes should be corrected for daytime ecosystem respiration, the latter being itself extrapolated from night-time flux measurements by applying temperature corrections (Reichstein et al., 2005). Direct flux measurements of COS may be the alternative to measure photosynthesis at the ecosystem scale (Asaf et al., 2013), but the approach is hampered by our present imperfect understanding of variations of the ratios of COS to CO2 leaf deposition velocities (Seibt et al., 2010; Wohlfahrt et al., 2012). Moreover, a requirement that should be met for COS uptake to be used as a proxy of terrestrial photosynthesis at the ecosystem scale is that any other COS fluxes within the ecosystem must be negligible compared to plant uptake (Blonquist et al., 2011) or the magnitude of the non-leaf fluxes needs to be known a priori (Wohlfahrt et al., 2012). The existence of nocturnal deficits of COS near the ground as observed by Mihalopoulos et al. (1989) and White et al. (2010) during field experiments carried out about 20 yr apart implies that non-photosynthetical processes are also important in controlling exchanges of COS in terrestrial ecosystems. White et al. (2010) were the first to show that the night-time net ecosystem COS flux estimates were dominated by nocturnal vegetative uptake not by soil uptake.
Here, we present the results of a new field study of COS exchange at the ecosystem level where COS fluxes were derived using the Radon-Tracer Method. The COS deposition velocities are compared to those of hydrogen (H2), which is deposited almost exclusively to soils. The study benefited from the extensive investigation of H2 sources and sinks carried out by Yver et al. (2009) at the Gif-sur-Yvette air monitoring station.
2. Methods
The Gif-sur-Yvette sampling site is part of the Laboratory for Climate and Environmental Sciences (LSCE) and belongs to the Atmospheric Network for Greenhouse Gases Monitoring (RAMCES). This semi-urban site is located 20 km SW of Paris at an altitude of 160 m above the sea level. The site is surrounded by lawns, agricultural fields and forests (about 70% of the land surface) and urban infrastructures including a village (NE), the city of Gif-sur-Yvette (about 21 000 inhabitants, S), the nuclear research centre of Saclay (N), two main roads and a motorway (E). The ambient air inlets for COS, CO and H2 measurements are located on the roof of the laboratory 7 m above the ground level (agl) and 3.5 m agl for the 222Rn measurements. More details on the Gif-sur-Yvette air monitoring station can be found in Yver et al. (2009) and Lopez et al. (2012).
A commercial gas chromatograph (Varian 3800) coupled with a cryogenic preconcentrator (ENTECH P7100) for sample preparation, and a mass spectrometer detector (Varian Saturn 2200) for COS detection, were used to analyse this gas. The first application of the P7100 instrument for the preconcentration of COS in air samples was made by Yi et al. (2007). In short, the instrument is operated in the extended dehydration mode. Air samples (400–600 ml, 1 atm, 0°C, volume determined by indirect time-integrated flow measurements, 50 ml min−1 flow rate) are drawn through two traps mounted in series: an empty Silonite-coated stainless-steel trap removes humidity at −25°C and a second trap filled with HayeSep-D adsorbent (Miller et al., 2008) traps COS at −40°C. Some CO2 is trapped non-quantitatively during this stage. Then the HayeSep-D trap is heated to 180°C and the thermally desorbed gases are transferred by helium of highest purity to a cryo-focusing trap maintained at −165°C. The compounds are then thermally desorbed into a PLOT capillary column (Porabound-Q, 25 m in length, 250 mm ID, Varian/Chrompack) maintained at a temperature of 35°C for 3 minutes, followed by a temperature increase to 160°C at a rate of 15°C min−1. The mass spectrometer detector is used in scan mode, and the ionisation method is electron impacting (EI). For measuring COS, m/z 60 is set as the target ion. All traps are heated before running a new gas sample. The sampling time is defined in a sample list built using the P7100 software. In general, measurements are carried out on an hourly basis (every 45 minutes in December 2011) and the sampling autonomy is about 36 hours using a 60-l reservoir filled with liquid nitrogen for cryogenic trapping.
A 1.0-ppmv (±5%) COS primary standard prepared in helium (Air Products) is used for calibration. Fifty to several hundred micro-litres of this primary standard are drawn with a gas-tight syringe, equilibrated at room temperature and pressure, and are further injected through a septum in a line flushed with pure helium connected to the preconcentrator inlet. Two hundred millilitres of helium are sampled at a 50 ml min−1 flow rate. The calibration line (surface area vs. pico-litres of COS) exhibits a significant positive intercept because helium of highest purity available commercially is not free of COS. The linear response of the whole system is also checked by sampling atmospheric air (150–900 ml at 50 ml min−1 flow rate) from a compressed cylinder (target gas) provided by the Max Planck Institute but not calibrated against an international scale. In that case, the intercept of the six-point regression line (surface area vs. air volume) is not significantly different from zero. The diurnal drift of the whole system is also checked using this target gas and data are, if necessary, corrected for it. Mole fractions are calculated by dividing pico-litres of COS (at room temperature and pressure) by volumes of air dried at −25°C, corrected at room temperature and pressure. Precision is 1.2% (10 replicates of the target gas analysed consecutively for 10 hours).
Measurement techniques of H2, CO and Radon-222 (222Rn), as well as precision and flux calculations using the Radon-Tracer Method are described in detail in Yver et al. (2009) and Lopez et al. (2012). In short, H2 and CO were analysed using gas chromatography equipped with a reduction gas detector (RGD, model PP1, Peak Laboratories Inc., CA, USA). The mean repeatability for H2 is less than 3 ppb, and that for CO is less than 1.5 ppb (Yver et al., 2009). H2 is used as a tracer of traffic emissions and atmosphere–soil gas exchange, and CO helps characterising combustion processes. 222Rn is a natural radioactive gas emitted by soils. It is a good tracer of the planetary boundary layer circulation. 222Rn is measured at Gif-sur-Yvette station with the active deposit method, that is, via the radioactive decay of its daughters attached to aerosols. The radon instrument has a random error of 10%. The H2/222Rn correlations have been used by Yver et al. (2009) to estimate the H2 uptake in the Gif-sur-Yvette area. The method used in their study is based on parallel measurements of H2 and 222Rn over 3 yr. Relatively stringent criteria are then applied to automatically select among hundreds of nocturnal events those suitable for deducing H2 fluxes using the Radon-Tracer method. Here, the process was not performed automatically because, contrary to H2 and 222Rn, the diurnal variations of COS were not measured throughout the year. To calculate the COS and H2 uptake rates, we used eq. (5) in Yver et al. (2009). This equation takes into account (a) the slope of linear regression during night-time inversion (COS/222Rn and H2/222Rn), (b) estimates of the 222Rn exhalation rates for the study area (52 Bq m−2 h−1 with a seasonal cycle amplitude of +25% in summer and −25% in winter), and (c) a correction factor of 0.96 which takes into account the change in 222Rn activity as a result of radioactive decay, offset by fresh emission of this gas from the soil.
Hence, fluxes were calculated as follows:
Deposition velocities (ν, in units of mm s−1) are inferred from the ratio between fluxes (F, in units of fractions of mol m−2 h−1) and air concentrations at the onset of the nocturnal depletion. The uncertainties on the deposition velocities mainly come from the estimation of the 222Rn flux and from the regressions COS/Rn and H2/Rn. The coefficients of determination of the regressions were in the range 0.40–0.93 (Table 1). The overall uncertainty of each deposition event ranges between 35 and 80%.
Table 1
Estimates of COS and H2 fluxes (F) and deposition velocities (ν) during nocturnal stable conditions (Gif-sur-Yvette, in 2011).
A weather station (Vaisala WXT520) provided local meteorological data (air temperature, wind direction and speed, and relative humidity). All data are presented in coordinated universal time (UTC). Sunrise and sunset times were calculated for the location of Gif-sur-Yvette (48°42′36′′N–2°08′51′′E).
3. Results
A total of 50 diurnal cycles were acquired throughout 2011. The longest time series were carried out in November and December 2011. They lasted for eight and nine consecutive days, respectively. Fig. 1 presents the hourly variations of COS, H2 and CO mole fractions together with 222Rn activities and standard meteorological measurements (temperature and wind speed) at Gif-sur-Yvette from late November to mid December 2011. The time series shows night-time and early morning decreases of COS mole fraction and corresponding 222Rn increases (seven events during a 13-d period). The seven COS lows coincide with late night or early morning temperature lows and calm meteorological conditions with wind velocities lower than 6 km h−1. The amplitude of nocturnal variations is in the range 30–70 ppt. There are four situations in the November–December dataset (November 29 and December 1, 8, 10) where nocturnal decreases of COS and H2 are very well in line. There are three situations (November 28, 30, and December 11) where sharp peaks of CO and H2 resulting from traffic emission during rush hours are not associated with increases of COS.
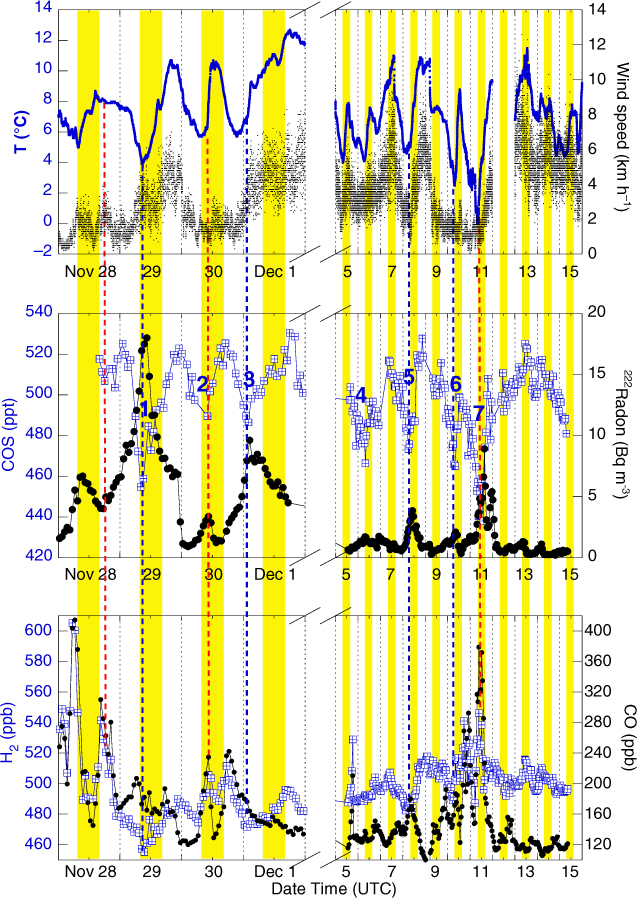
Fig. 1
COS, CO and H2 mole fractions, and 222Rn activity during November–December 2011 at Gif-sur-Yvette. The vertical red dashed lines indicate stable atmospheric conditions (radon highs) associated with H2 highs and COS lows. The vertical blue dashed lines indicate stable atmospheric conditions associated with H2 and COS lows. Major COS lows are numbered 1–7. The yellow vertical bands correspond to the sunlit hours from sunrise to sunset. From late November to mid December, the sun rises between 7:17 and 7:35 am and sets between 3:57 and 4:01 pm UTC.
Pronounced increases of 222Rn during stable nocturnal conditions associated with decreases of COS and H2 mole fraction were observed frequently in Gif-sur-Yvette as well as CO and H2 peaks not associated with peaks of COS. This is illustrated in Fig. 2 for early February, late March and early August 2011. However, on March 25, a COS minimum was observed at noon. Moreover, the summer measurements recorded two atypical events where radon highs, H2 and CO lows were associated with COS highs.
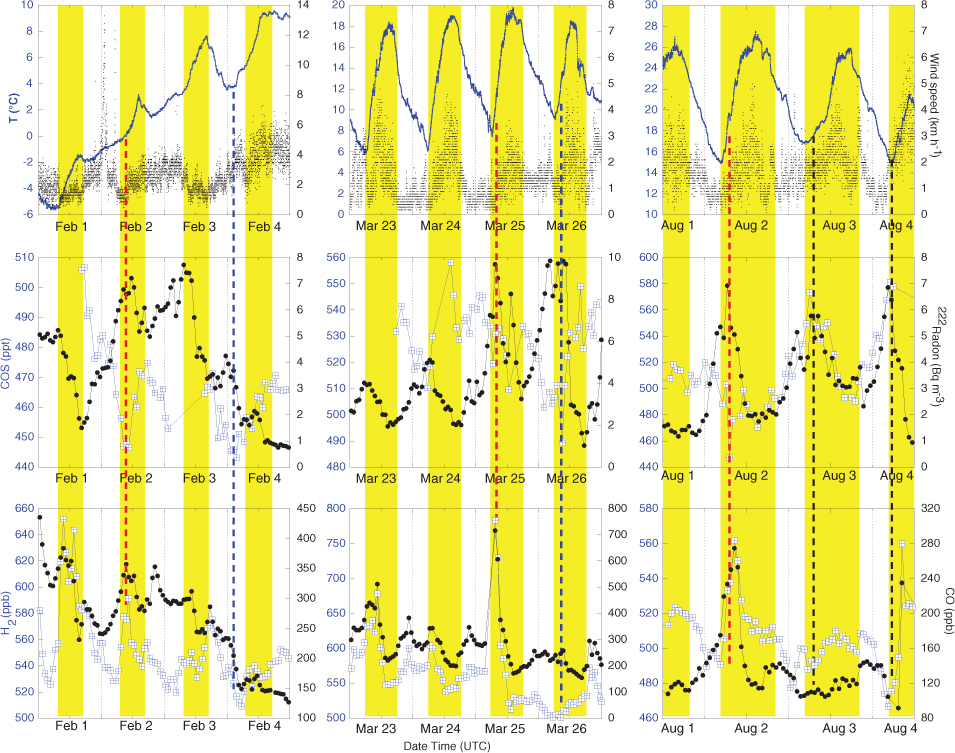
Fig. 2
COS, CO and H2 mole fractions, and 222Rn activity during early February (left column), late March (middle column) and early August 2011 (right column) at Gif-sur-Yvette. The vertical red dashed lines indicate stable atmospheric conditions (radon highs) associated with H2 highs and COS lows. The vertical blue dashed lines indicate stable atmospheric conditions associated with H2 and COS lows. The vertical black dashed lines indicate stable atmospheric conditions associated with H2 lows and COS highs. The yellow vertical bands correspond to the sunlit hours from sunrise to sunset. In early February, the sun rises between 7:14 and 7:19 am and sets between 4:51 and 4:55 pm UTC. In late March, the sun rises between 5:39 and 5:45 am and sets between 6:09 and 6:14 pm. In early August, the sun rises between 4:23 and 4:27 am and sets between 7:27 and 7:31 pm.
COS and H2 fluxes and deposition velocities were calculated during stable nocturnal conditions with pronounced increases of 222Rn, and COS and H2 mole fraction decreases (Table 1). A record of COS and H2 measurements plotted against corresponding 222Rn activities is displayed in Fig. 3. The corresponding diurnal variations are presented in left column of Fig. 2. The correlation between COS and 222Rn is negative and the determination coefficient is 0.91 (n=14). The slope is about 218 pmol Bq−1. The flux is 8.1 nmol m−2 h−1 and the corresponding deposition velocity is 0.10 mm s−1 using 505 ppt as the COS mole fraction at the onset of the nocturnal depletion. H2 and 222Rn are also correlated negatively when the four data points influenced by traffic emissions are removed. The slope is about 423 nmol Bq−1. The flux is 15.9 µmol m−2 h−1 and the corresponding deposition velocity is 0.17 mm s−1 using 585 ppb as the H2 mole fraction at the onset of the nocturnal depletion.
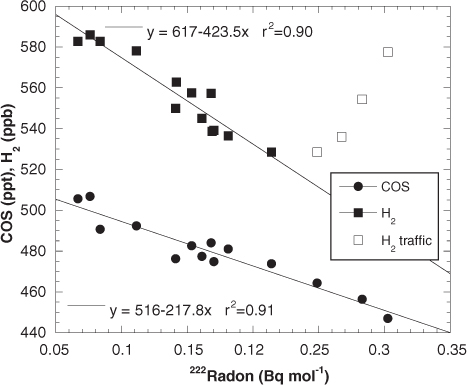
Fig. 3
Correlation of the COS and H2 mole fractions to 222Rn activity during nocturnal stable atmospheric conditions (February 1–2/2011). H2 levels recorded during rush hours (5:30–8:30 UTC) are plotted with open squares.
Nocturnal COS deposition velocities ranged from 0.07 to 0.39 mm s−1, with a mean value of 0.18±0.12 mm s−1 (n=14). Those of H2 ranged from 0.03 to 0.24 mm s−1, with a mean value of 0.14±0.07 mm s−1 (n=7). The difference in the number of significant events results from the fact that, contrary to H2, the COS signal is not disturbed by local traffic emissions during stable nocturnal conditions. When plotted against those of H2, the COS deposition velocities are roughly distributed around the 1:1 line (Fig. 4).
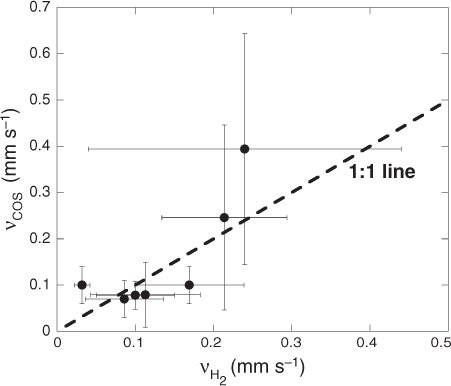
Fig. 4
A comparison of the observed COS and H2 deposition velocities. Error bars represent the overall uncertainty of each deposition event.
4. Discussion
Our survey of a series of atmospheric tracers in the lower layers of the Parisian atmosphere aimed at identifying the local sources and sinks of COS. We focused on their hourly variations using those of 222Rn as an indicator of vertical mixing in the planetary boundary layer. The accumulation of 222Rn within the planetary boundary layer results from a lowering of vertical mixing, during nocturnal inversions, for example. As the surveys lasted for about 50 d in total during year 2011, data cannot help with the elucidation of the seasonal variations of COS in the Parisian atmosphere.
Automobile traffic is a well-documented source of H2 and CO in the Parisian area and elsewhere (Yver et al., 2009, and references therein). It is detected in atmospheric records in the form of abrupt peaks occurring during late evening and early morning hours (rush hours). We never observed peaks of COS associated with peaks of H2 and CO (Figs. 1 and 2). This is highly consistent with cars being a negligible source of this gas in the atmosphere (Watts, 2000). Accumulation of COS during nocturnal inversions occurred only twice in 2011 (2–4 August, Fig. 2), but not during the night of 1 August. It is unlikely that COS production resulted from combustion processes because the levels of CO recorded during both events (about 100 ppb) were close to baseline values (Yver et al., 2009). It is suggested that the suburban ecosystem can turn from sink to source during the summer months when averaged nocturnal temperatures reach the twenties (Fig. 2).
The dry deposition velocities for H2 at Gif-sur-Yvette [0.14±0.07 mm s−1 (n=7), year 2011] contrast with the annual mean value of 0.24±0.13 mm s−1 from the study of Yver et al. (2009) carried out from June 2006 to April 2009. However, their time series exhibited clear interannual variations. Present data agree better with their 2008 than their 2007 records, and fall in the lower range of deposition velocities classified by ecosystem type by Yver et al. (2009). It is known that the dominant sink for H2 is diffusion in soils and subsequent uptake by aerobic bacteria and/or extracellular enzymatic activity (Constant et al., 2010, and references therein). Moreover, soil consumption accounts for 70–80% of the total sinks of H2 (Hammer and Levin, 2009). The fact that COS and H2 display rather similar temporal variations and deposition velocities during nocturnal stable conditions when traffic emissions of H2 in the Gif-sur-Yvette area are low is a strong indication that non-photosynthetical processes are important in controlling exchanges of COS in this suburban ecosystem. There is an abundance of data demonstrating the importance of soils on COS deposition (e.g. Kuhn et al., 1999; Simmons et al., 1999; Yi et al., 2007; Van Diest and Kesselmeier, 2008). However, soils in the Gif-sur-Yvette area usually are vegetated. There are lawns around the sampling site which, according to Geng and Mu (2004), are capable of continuously absorbing COS in night-time as well as in daytime. In fact, as long as stomata are not completely closed (which they are not in most plant species even during night-time (Caird et al., 2007), leaves will take up COS, at a low rate albeit. Hence, nocturnal uptake of COS near the ground at Gif-sur-Yvette could result from vegetative and non-vegetative processes. Assuming that COS is taken up solely by soils, deposition velocities in the range 0.07–0.39 mm s−1 measured at Gif-sur-Yvette are by far lower than the optimum values reported by Van Diest and Kesselmeier (2008) for four boreal soils (0.84–1.54 mm s−1). But since none of the known controlling variables in the COS soil–atmosphere flux (i.e. soil temperature, soil structure and porosity, water content) were recorded during our study, we cannot go further in the discussion of factors controlling uptake mechanisms of COS (nor about the nocturnal emissions observed occasionally during August 2011) in the Gif-sur-Yvette area. This being said, the relationship between COS and H2 deposition velocities (Fig. 4) may imply some physiological link between the consumption of both gases, related to enzymatic activities (β-carbonic anhydrases, carbonyl COS hydrolases, and hydrogenases) of soil bacteria. We suggest that measurements of hydrogen deposition velocities could provide a constraint on COS deposition to soils. As the H2 deposition velocities measured in suburban ecosystems fall in the lower range of deposition velocities classified by ecosystem type (Yver et al., 2009), there is a potential for higher deposition of COS to soils in grassland, shrubland, agricultural land and forests. It is also suggested that COS global models could benefit from recent improvements in process-based modelling of molecular hydrogen deposition into the soil (e.g. Morfopoulos et al., 2012).
It is worth noting that previous investigations of COS fluxes at the ecosystem scale based on relaxed eddy accumulation or eddy covariance techniques reported nocturnal emissions instead of uptakes (Xu et al., 2002; Asaf et al., 2013). The sign and the magnitude of our flux measurements are much more consistent with those of Kuhn et al. (1999) estimated by a nocturnal boundary layer depletion model. Unfortunately, both approaches to the nocturnal fluxes of COS are incompatible because the eddy covariance techniques require nocturnal turbulence, whereas the Radon-Tracer method requires calm meteorological conditions. There is compelling evidence that terrestrial ecosystems are capable of absorbing COS (Asaf et al., 2013, and references therein). However, since there is growing evidence that COS can be taken up in the dark in such diverse areas as coastal, semi-urban, and agricultural areas and forests (Mihalopoulos et al., 1989; Kuhn et al., 1999; Geng and Mu, 2004; White et al., 2010; this work), the use of terrestrial fluxes of COS as a tracer for gross primary production at continental scale should be made with caution. We definitely need more direct and indirect flux measurements of COS to answer the question of how large the soil COS flux is in comparison to the canopy flux.
5. Conclusion
Strong similarities were found between the deposition mechanisms of COS and H2 at the Gif-sur-Yvette monitoring site. During the night, when the lower atmosphere is stratified (222Rn increases) and local traffic emissions of H2 are low (no peaks of H2), COS and H2 mole fractions decrease in parallel. Nocturnal deposition velocities of COS and H2, calculated at the ecosystem scale using the 222Rn Tracer Method, fall about in the same range and are roughly proportional. It is well established that the uptake of H2 takes place in soils and is a non-photosynthetic process. Since COS behaves like H2, this suggests that the nocturnal loss of COS is also governed by non-photosynthetic processes. However, since lawns are present in the vicinity of the monitoring station and are capable of continuously absorbing COS in night-time, its loss near the ground is most likely the result of the combined effects of soil and vegetation. Here, we provide evidence that COS consumption takes also place by night so when the carbon fluxes are dominated by respiration.
6. Acknowledgements
The authors thank Cécile Gaimoz and Nicolas Bonnaire for many practical advices in operating the GC/MS, François Truong and Morgan Lopez for technical help, and Philippe Ciais and Léonard Rivier for their encouragements in re-launching COS measurements at LSCE and financial support. This is LSCE contribution number 5026.