
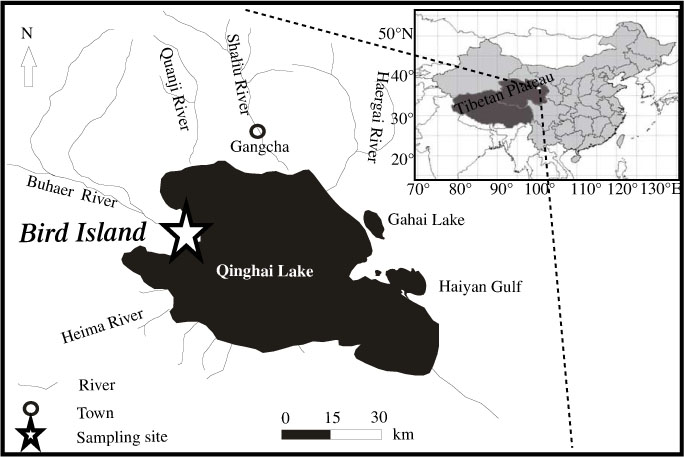
Fig. 1
Location of sampling site (Bird Island, northwestern Qinghai Lake, 36°59′N, 99°54′E).
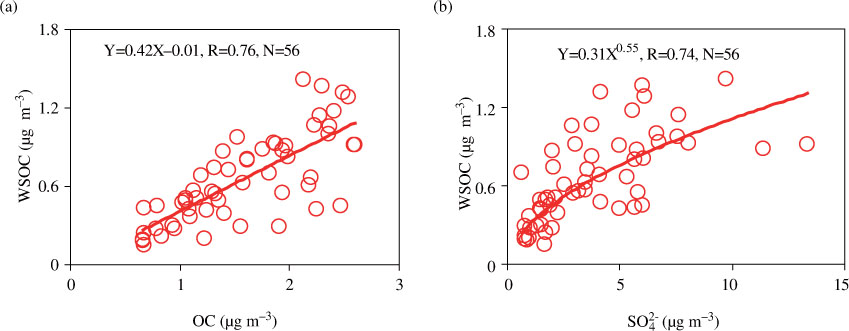
Fig. 2
Correlations of WSOC with (a) OC and (b) .
Table 1. Summary of major components in PM2.5 at Qinghai Lake during summer (N=56), 2010
[i] a T and RH: due to the instrument trouble, temperature (T) and relative humidity (RH) here only presented daily-averaged value from 2010-7-15~2009-8-27 (N=43).
Table 2. Concentrations of nine organic compositions in the summertime aerosols (PM2.5) at Qinghai Lake (ng m−3)
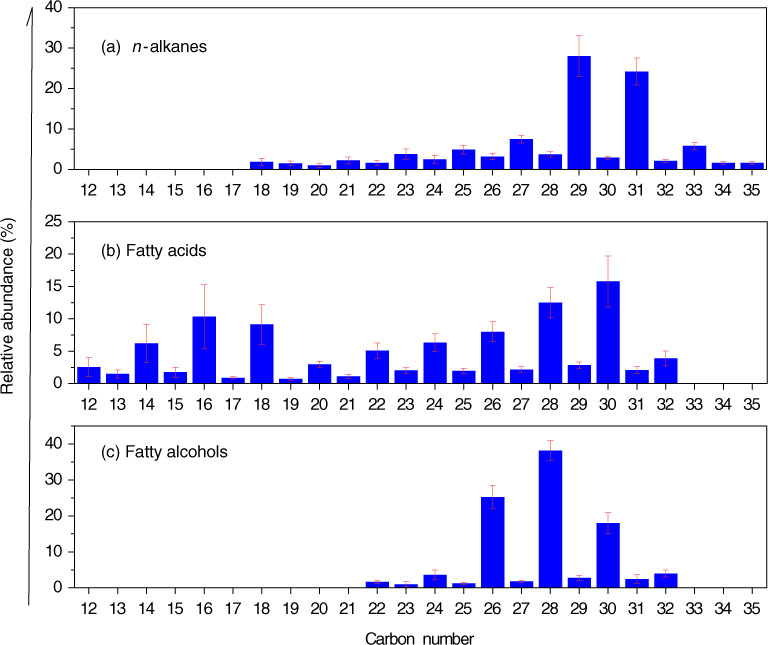
Fig. 3
Molecular distribution of n-alkanes, fatty acids and fatty alcohols. Relative abundance: [(concentration of individual compound)/(concentration of total congeners)]×100%.
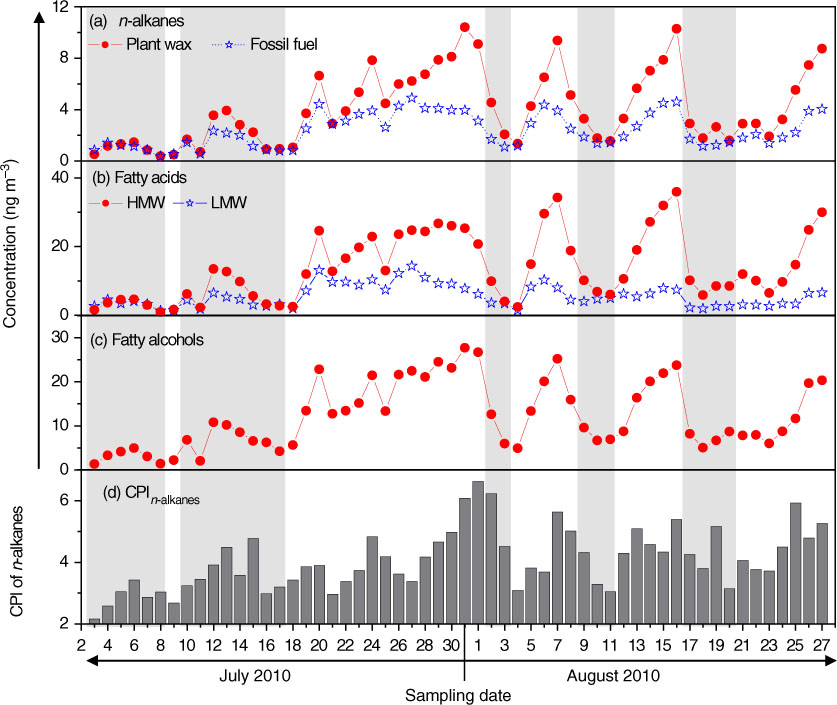
Fig. 4
Temporal variations of n-alkanes, fatty acids and fatty alcohols. Shadow denotes rainy weather.
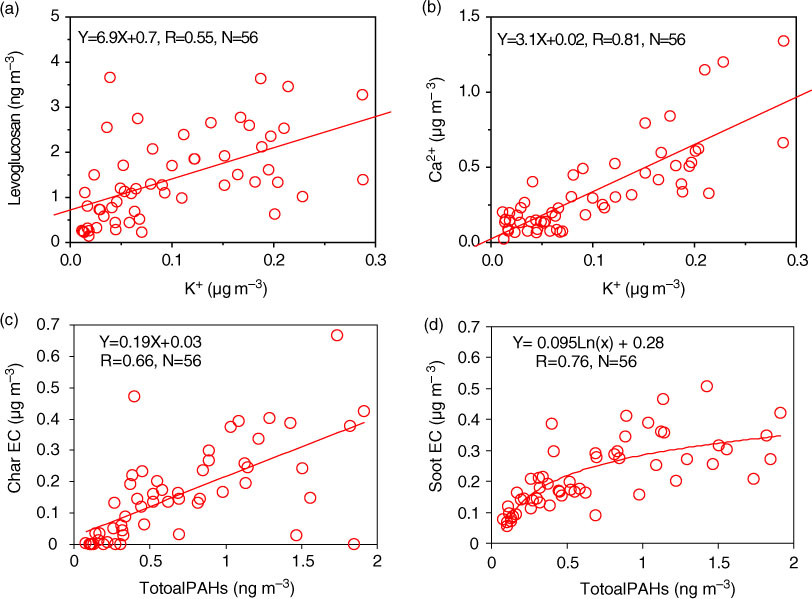
Fig. 5
Relationships between the concentrations of (a) Levoglucosan and K+, (b) Ca2 + and K+, (c) Char-EC and total PAHs, and (d) Soot-EC and total PAHs.
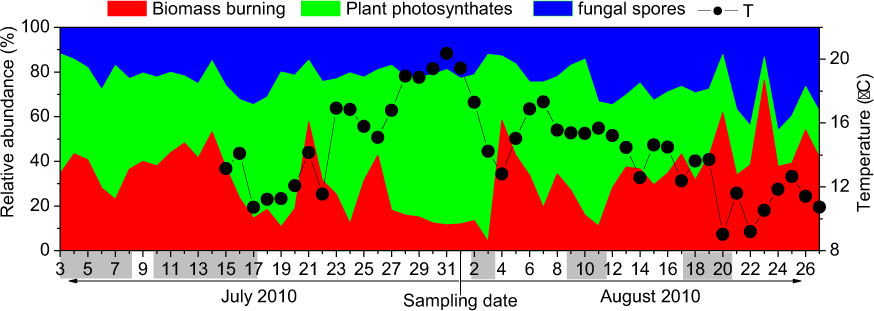
Fig. 6
Temporal variations of sugars (biomass burning derived sugars contain galactosan, mannosan and levoglucosan; plant photosynthate=fructose + glucose + sucrose + trehalose; fungal spores=arabitol + mannitol + inositol). Relative abundance: [(concentration of sugars from special source)/(concentration of total sugars)]×100%. Shadow denotes rainy weather.
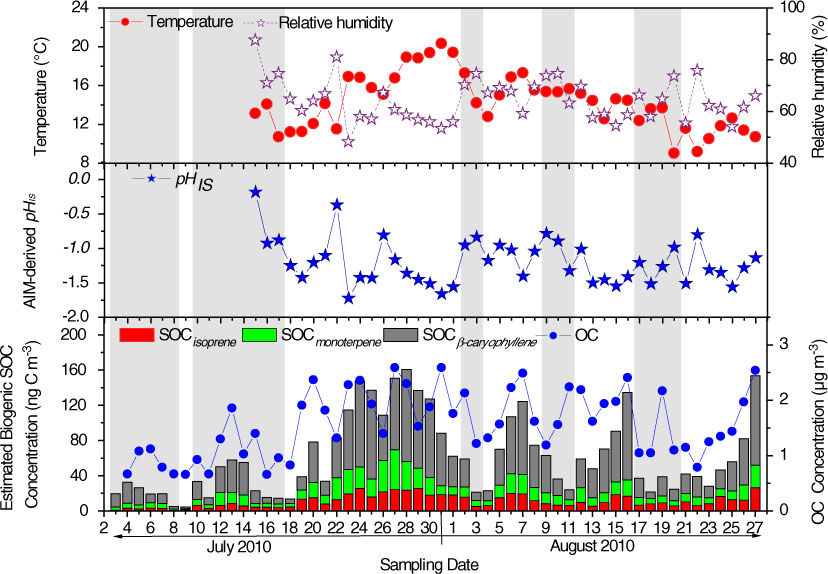
Fig. 7
Temporal variations of (a) temperature and relative humidity, (b) pHIS (particle acidity calculated using AIM model), and (c) estimated biogenic SOC concentration. Shadow denotes rainy weather.
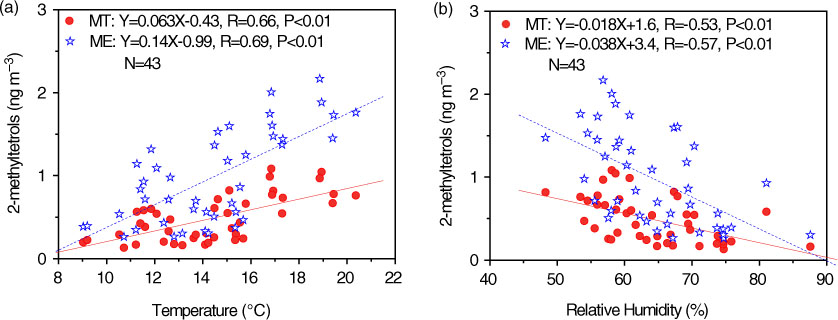
Fig. 8
Linear regression of concentrations of 2-methyltetrols with (a) temperature, and (b) relative humidity.
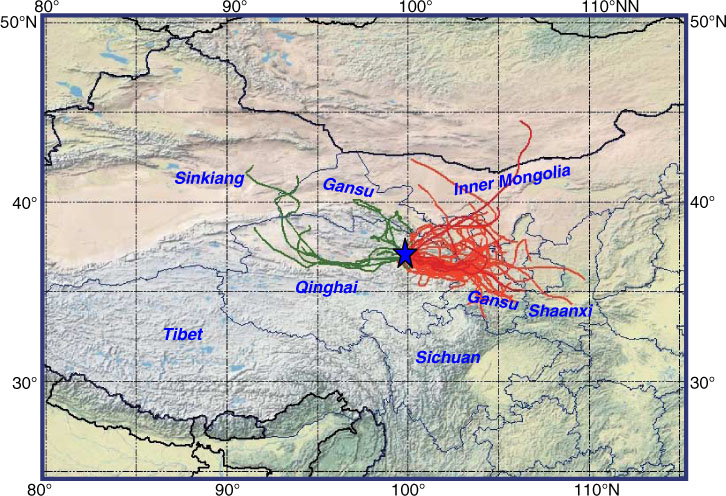
Fig. 9
Backward trajectories of air masses arriving in Qinghai Lake (36.98°N, 99.90°E, and the altitude were set as 3300 m a.s.l., 07/03–08/27/2010, local time, 24-hr interval). Red line: air masses transported from the eastern region of Qinghai Lake, Green Line: air masses transported from the western region of Qinghai Lake.
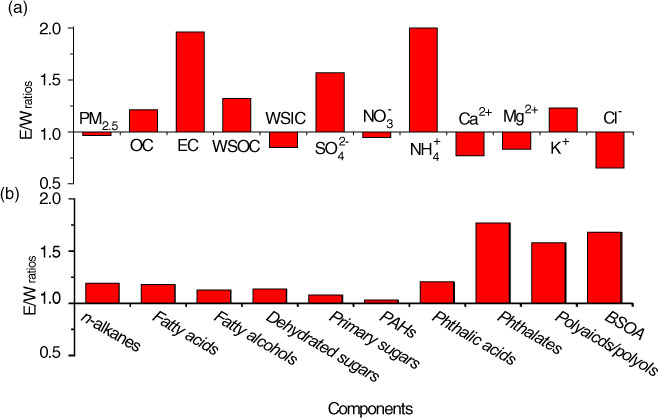
Fig. 10
Ratios of concentrations in air mass transported from easterly to that from westerly (E/W): (a) carbonaceous components and water-soluble inorganic ions and (b) organic compositions in PM2.5.
Table 3. Comparison of summertime aerosol compositions with those in plateau, urban and mountain atmospheres
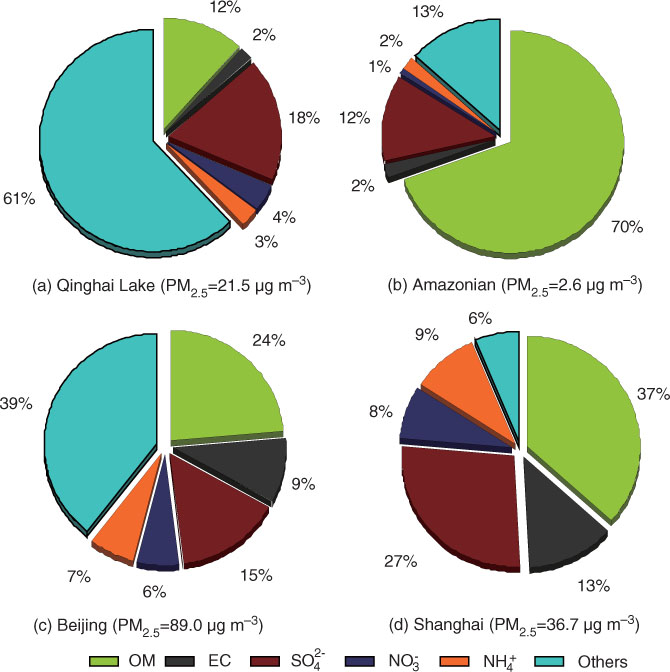
Fig. 11
Reconstructed mass balances of PM2.5 during summer in: (a) Qinghai Lake (this study), (b) Amazonian (Graham et al., 2003), (c) Beijing (Duan et al., 2006), and (d) Shanghai (Ye et al., 2003).