
1. Introduction
Atmospheric aerosols are of significant impact on climate change and human health, which is dependent on their chemical composition in addition to size distribution. Atmospheric particles enriched with organic compounds can make the aerosol surface more hydrophilic or hydrophobic depending on the composition and mixing state and thus alter their cloud condensation nuclei activities (Fu et al., 2008; Hallquist et al., 2009). Tibetan Plateau is one of the regions in the world that are most sensitive to global climate change (Lau and Kim, 2006; Lau et al., 2010). Located in the northeastern part of the Tibetan Plateau, Qinghai Lake (36°32′–37°15′N, 99°36′–100°47′E, 3200 m a.s.l.) (Fig. 1) is one of the largest saline lakes in East Asia. Atmospheric environment at Qinghai Lake is unique because of strong solar radiation and insignificant human activity, and thus chemical and physical properties of aerosols differ from those in low elevation regions.
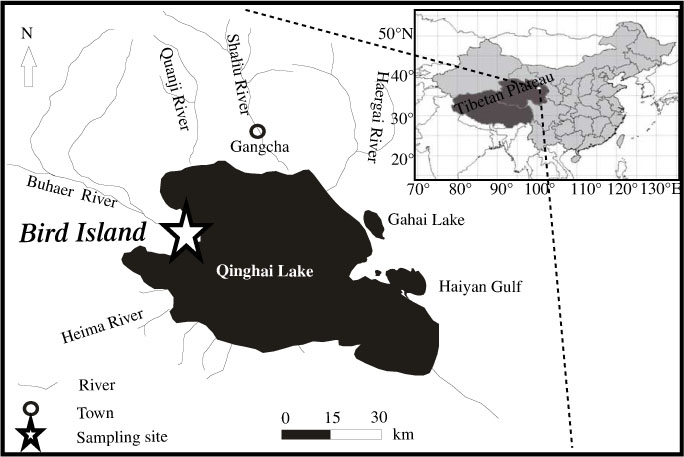
Fig. 1
Location of sampling site (Bird Island, northwestern Qinghai Lake, 36°59′N, 99°54′E).
Numerous studies on Chinese atmospheric aerosols have been reported for urban (Cao et al., 2005; Feng et al., 2006; Wang et al., 2006a), suburban, rural and mountain areas (Fu et al., 2008; Li et al., 2011). However, very limited information has been documented for atmospheric aerosols from the Tibetan Plateau (Ma et al., 2003; Qu et al., 2009), especially for organic aerosols. In the summer of 2010, an intensive observation of aerosol chemistry was conducted in the Tibetan Plateau. Here, we will first explore the molecular compositions and sources of organic aerosols in PM2.5 of Qinghai Lake region and then compare the results with those in other regions including mountain, urban and rural areas to investigate the characteristics of aerosols at this continental background site.
2. Experimental section
2.1. Aerosols sampling
The PM2.5 sampling was conducted at Bird Island (36°59′N, 99°54′E), which is located at the northwestern rim of Qinghai Lake (Fig. 1). Sample collection was performed on the top of a 20-m high tower from 3 July to 26 August 2010 using a high-volume air sampler (Anderson, USA) operated at an airflow rate of 28 L min−1. A total of 56 PM2.5 samples were collected each lasting for 24 hr. All samples were collected onto pre-baked (450°C for 8 hr) quartz microfiber filters (Whatman 42, USA). After sampling, the filter was sealed in an aluminium bag and stored at −18°C prior to analysis. Field blank samples were also collected before and after sampling by mounting a filter onto the sampler for about 10 min without sucking any air.
2.2. Carbonaceous components and inorganic ion determination
OC (organic carbon) and EC (elemental carbon) were analysed using DRI Model 2001 Carbon Analyzer following the Interagency Monitoring of Protected Visual Environments (IMPROVE) thermal/optical reflectance (TOR) protocol. Briefly, a 0.526 cm2 sample filter was placed in a quartz boat inside the analyzer and stepwise heated to temperatures of 140°C (OC1), 280°C (OC2), 480°C (OC3) and 580°C (OC4) in a non-oxidising helium (He) atmosphere, and 580°C (EC1), 740°C (EC2) and 840°C (EC3) in an oxidising atmosphere of 2% oxygen in helium. Pyrolised carbon (PC) is determined by reflectance and transmittance of 633-nm light. In addition, EC is subdivided into two classes: char EC (EC1-PC) and soot EC (EC2 + EC3). The analyzer was calibrated with known quantities of CH4 every day. One sample was randomly selected from every 10 samples and re-analysed. Differences determined from the replicate analyses were <5% for TC and <10% for OC and EC.
Another aliquot of the sample/blank filters was extracted with 30 mL pure water and filtered through a polytetrafluoroethylene filter to remove the particles and filter debris. The water extract was then separated into two parts. One part was used to determine inorganic ions using ion chromatography (Dionex 600, Dionex, USA). The limits of detection were less than 0.05 mg L−1 for anions and cations, respectively. Another part of the water extract was analysed for water-soluble organic carbon (WSOC) and water-soluble inorganic carbon (WSIC) using a TOC analyzer (TOC-L CPH, Shimadzu, Japan). All carbonaceous components and inorganic ions data reported here were corrected by the field blanks.
2.3. Organic compound determination
Detailed methods for extraction, derivatisation and gas chromatography/mass spectrometry (GC/MS) analysis were described elsewhere (Wang et al., 2006a; Li et al., 2012). Briefly, a 50.2 cm2 punch of the sample/blank filter was cut in pieces and extracted with a mixture of dichloromethane and methanol (2:1, v/v) under ultrasonication. The extracts were concentrated using a rotary evaporator under a vacuum condition and then blown down to dryness using pure nitrogen. After reaction with N,O-bis-(trimethylsilyl) trifluoroacetamide (BSTFA) at 70°C for 3 hr, the derivatives were determined using a GC/MS technique below.
GC/MS analysis of the derivatised fraction was performed using an Agilent 7890A GC coupled with an Agilent 5975C MSD. The GC separation was carried out on a DB-5MS fused-silica capillary column with the GC oven temperature programmed from 50°C (2 min) to 120°C at 15°C min−1 and then to 300°C at 5°C min−1 with a final isothermal holds at 300°C for 16 min. The sample was injected in a splitless mode at an injector temperature of 280°C, and scanned from 50 to 650 Da using electron impact (EI) mode at 70 eV.
GC/MS response factors of all the target compounds were determined using authentic standards except several biogenic secondary organic aerosols (BSOA) tracers. Response factors of these BSOA, that is, 2-methylglyceric acid (MGA), 2-methylthreitol (MT), 2-methylerythritol (ME), 3-hydroxyglutaric acid (HGA), and 3-methyl-1,2,3-butanetricarboxylic acid (MBTCA) were substituted by those of glyceric acid, erythritol, tartaric and suberic acids, respectively, due to the commercial unavailability. C5-alkene triols and β-caryophylliniic acid were calculated using the response factor of pinic acid. No significant contamination (<5% of those in the samples) was found in the blanks. Method detection limits (MDLs) for major compounds, that is, nonacosane (C29 alkane), hexadecanoic (C16:0), hexacosanol (C26 alcohol), levoglucosan (Levo), benzo(b)fluoranthene (BbF), tere-phthalic acid (t-Ph), bis(2-ethylhexyl) phthalate (BEHP) and 2-ME were 0.16, 0.70, 0.27, 0.11, 0.016, 0.016, 0.26 and 0.17 ng m−3, respectively. Recoveries of all the target compounds ranged from 80 to 120%. Data presented were corrected for the field blanks but not for the recoveries.
3. Results and discussion
3.1. EC, OC, WSOC, WSIC and inorganic ions
The results of carbonaceous components and inorganic ions are presented in Table 1. Concentrations of PM2.5 at Qinghai Lake during summer 2010 ranged from 3.8 to 62 µg m−3 with an average of 22±13 µg m−3, being one to six times lower than those in the Chinese urban areas (Cao et al., 2007). OC and EC in the samples are 1.6±0.6 and 0.4±0.2 µg m−3, respectively. OC/EC ratio (6.0±3.9) is higher than those in mountain (3.1±1.1, Mt. Hua, inland China) (Li et al., 2013) and urban areas (2.1 − 5.9) (Cao et al., 2007), indicating that the relative contribution of natural sources to the carbonaceous components is higher in the Plateau region. WSOC (0.15 − 1.41 µg m−3, ave. 0.66±0.33 µg m−3) accounts for 41±13% of OC, lower than those in Mt. Tai (65% in early June and 55% in late June, TSP) (Fu et al., 2012) but higher than those (30±15%, PM10) (unreported data) in Shanghai, China. As shown in Fig. 2a, WSOC linearly correlated (R=0.76) with OC by a slope of 0.42, suggesting that WSOC is an important fraction of OC.
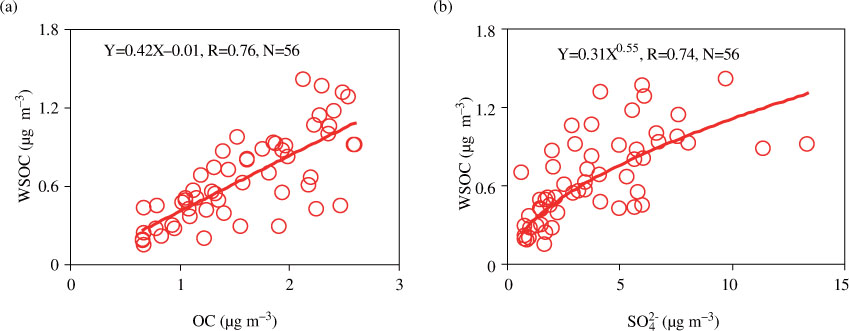
Fig. 2
Correlations of WSOC with (a) OC and (b) .
Table 1. Summary of major components in PM2.5 at Qinghai Lake during summer (N=56), 2010
[i] a T and RH: due to the instrument trouble, temperature (T) and relative humidity (RH) here only presented daily-averaged value from 2010-7-15~2009-8-27 (N=43).
(3.9±2.8 µg m−3, Table 1), (0.8±0.5 µg m−3), (0.6±0.4 µg m−3) and Ca2 + (0.34±0.29 µg m−3) are the four major inorganic ions in the Qinghai Lake samples. Total inorganic ions in PM2.5 account for 28±12% of the particle mass, similar to those in most Chinese urban areas (Wang et al., 2006b; Shen et al., 2008). Concentrations of , and at Qinghai Lake are comparable to those in mountain areas in China such as Mt. Gongga, Mt. Dinghu and Mt. Changbai (Xu et al., 2009) but much higher than those (0.19, 0.01 and 0.24 µg m−3 for , and ) determined in 1995 at Waliguan (Yang et al., 1996), a Global Atmosphere Watch baseline station located 12 km southeastern to Qinghai Lake. Since can promote secondary organic aerosol (SOA) production (Iinuma et al., 2004; Froyd et al., 2010; Szmigielski et al., 2010) via a similar formation pathway such as in-cloud process (Agarwal et al., 2010), and WSOC correlated each other well (R=0.74, Fig. 2b).
Chamber studies found that acid-catalysed heterogeneous reaction can promote SOA formation (Offenberg et al., 2009; Surratt et al., 2010), in which particle acidity takes on an important role. In situ acidity of atmospheric particles is dependent on the meteorology parameters such as relative humidity (RH) and temperature, which is not measured directly but indirectly calculated as in situ pH (pHIS) based on the aerosol inorganic model (AIM) (http://www.aim.env.uea.ac.uk/aim/aim.php). Briefly, pHIS is defined as pH of the aqueous phase on aerosols (Xue et al., 2011) and often calculated using the following equation:
where α H+ is the activity of H+ in mol L−1 in the aqueous phase, γ H+ is the activity coefficient of H+, n H+ is free H+ in a unit of mol m−3 of air, and V a is the volume concentration of the aqueous phase of aerosol in a unit of cm3 m−3. In this study, γ H+ , n H+ and V a are derived using AIM-II, which considers an –NO3––H+ system and allows variable temperature and RH. As shown in Table 1, pHIS are −1.20±0.32 (−1.72 to −0.18) in PM2.5 at Qinghai Lake, indicating a stronger acidity of aerosol in the elevated region than that in lowland regions such as Hong Kong (−0.08±0.81 during the summer of 2009) (Xue et al., 2011). It is worth noting that in situ acidity of the Qinghai Lake aerosols may be somewhat overestimated due to the relatively high level of mineral ions (e.g. Ca2 + and Mg2 + ), which were not included by the model. In addition, the liquid water content (LWC) of particles can also be calculated using the AIM-II model, and their concentrations are 0.07–0.82 µmol m−3 in the PM2.5 samples at Qinghai Lake.
3.2. Organic aerosols
Approximately 100 organic species were detected in the PM2.5 samples and their concentrations are summarised in Table 2 as nine compound classes based on functional groups and their sources. The concentration of individual compounds can be found in Table S1. The total measured organics are 61±36 ng m−3 (7.3–130 ng m−3), accounting for 2.6±1.0% of OC. The most abundant compounds are fatty acids, followed by fatty alcohols, polyols and polyacids, n-alkanes and sugars (see Table 2).
Table 2. Concentrations of nine organic compositions in the summertime aerosols (PM2.5) at Qinghai Lake (ng m−3)
3.2.1. Primary organic aerosols
3.2.1.1. n-Alkanes, fatty acids and fatty alcohols: Total n-alkanes (C18–C35) in PM2.5 are 6.5±4.0 ng m−3 at Qinghai Lake, maximising at C29/C31 (Table S1 and Fig. 3a). n-Alkanes derived from terrestrial plants are dominated by high-molecular-weight species (HMW, carbon number >25) with an odd number preference. In contrast, fossil-fuel-derived n-alkanes do not have odd/even number preference (Rogge et al., 1993; Simoneit et al., 2004c). In general, n-alkanes with a carbon preference index (CPI, odd/even) greater than 5 are considered as plant wax sources, while those with a CPI nearly unity are mostly derived from fossil fuel combustion (Simoneit et al., 2004c; Wang et al., 2009). Thus, high CPI values (4.1±0.97) in this study suggest that fine particulate n-alkanes in the atmosphere of Qinghai Lake are largely derived from plant emissions. Plant-wax-derived n-alkanes are 4.1±2.8 ng m−3 in the samples, accounting for over 63% of the total.
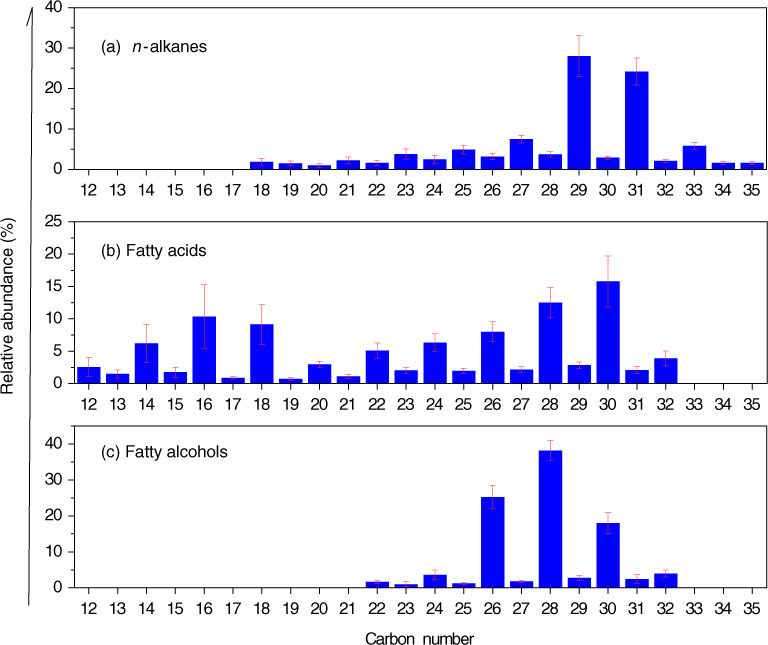
Fig. 3
Molecular distribution of n-alkanes, fatty acids and fatty alcohols. Relative abundance: [(concentration of individual compound)/(concentration of total congeners)]×100%.
Fatty acids in the range of C12:0−C32:0 were detected for the PM2.5 samples with a major peak at C30:0/C28:0 and a minor peak C16:0/C18:0 (Table S1 and Fig. 3b). Such a molecular distribution is different from that in urban areas, where in general fatty acids C16:0/C18:0 are the most abundant species. HMW fatty acids (C20:0−C32:0) are largely originated from terrestrial higher plants, while low-molecular-weight (LMW) fatty acids (C12:0−C19:0) are mostly derived from microbe and marine phytoplankton (Simoneit et al., 2004c; Wang et al., 2007; Fu et al., 2012). In addition, fatty acids C16:0/C18:0 in urban aerosols are mostly derived from cooking activity (Wang and Kawamura, 2005). Thus, the more abundant of HMW fatty acids (HMW/LMW = 2.5) observed in the samples are reasonable since Qinghai Lake is a remote continental site.
A homologue of fatty alcohols (C22−C32) was determined in the PM2.5 samples. These components are dominated by C26, C28 and C30 with a strong even-to-odd carbon number predominance (CPI = 10±2.3) (Table S1 and Fig. 3c). HMW fatty alcohols (≥C20) are abundantly present in higher plants and loess deposits (Wang and Kawamura, 2005), while LMW ones (≤C20) mostly originate from soil microbes and marine biota. Concentrations of total fatty alcohols are 12±7.6 ng m−3, which is one order of magnitude lower than those in urban areas in inland China (Wang et al., 2006a).
Temporal variations in concentrations of all the aliphatic lipids and CPI of n-alkanes are shown in Fig. 4. The sharp decline of the aliphatic compounds during rainy periods may suggest a significant scavenging effect of wet deposition. Plant n-alkanes, HMW fatty acids and alcohols showed the same trend, further indicating that the three classes of organic compounds mostly originate from higher plant wax (Fig. 4a–c). CPI values of n-alkanes presented an increasing trend in non-rainy days due to enhanced plant emissions.
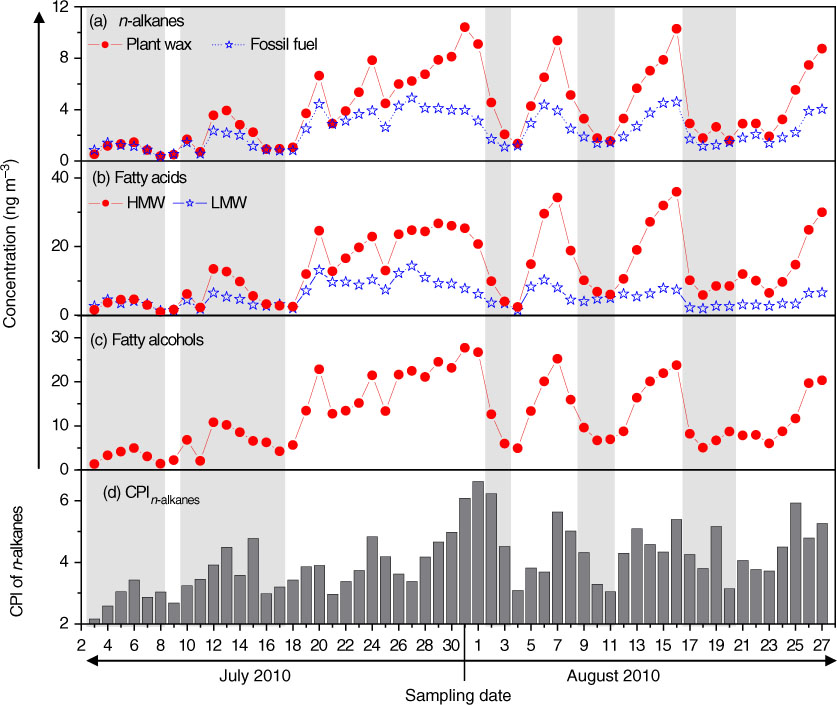
Fig. 4
Temporal variations of n-alkanes, fatty acids and fatty alcohols. Shadow denotes rainy weather.
3.2.1.2. Sugars and sugar alcohols: A total of 10 sugar and sugar alcohols were detected in the samples including dehydrated sugars (galactosan, mannosan and levoglucosan), primary sugars (fructose, glucose, sucrose and trehalose) and sugar alcohols (arabitol, mannitol and inositol). Their concentrations ranged from 0.49 to 19 ng m−3 with an average of 6.5±4.8 ng m−3. Levoglucosan, galactosan and mannosan are the tracers for smokes from biomass burning (Simoneit et al., 2004a; Engling et al., 2009). Their concentrations are two orders of magnitude lower than those in Chinese urban areas (Wang et al., 2006a; Xie et al., 2010). Potassium ion (K+) is another tracer for biomass burning emission (Andreae et al., 1990; Li et al., 2011). However, K+ is also abundant in dust (Li et al., 2008; Shen et al., 2009; Wang et al., 2011a). As shown in Fig. 5a and b, K+ exhibited a strong correlation with Ca2 + rather than levoglucosan, suggesting that potassium in the fine particles at Qinghai Lake is predominantly derived from dust.
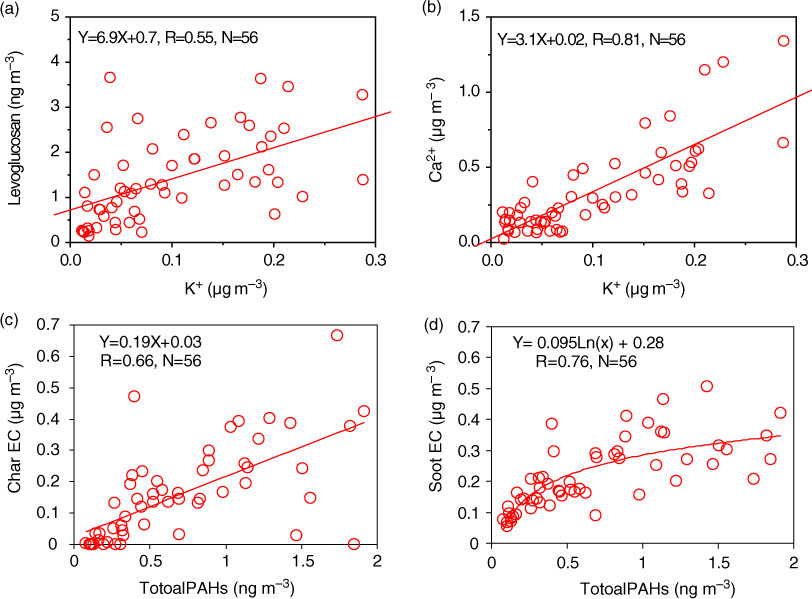
Fig. 5
Relationships between the concentrations of (a) Levoglucosan and K+, (b) Ca2 + and K+, (c) Char-EC and total PAHs, and (d) Soot-EC and total PAHs.
Primary saccharides such as glucose and sucrose are biomarkers for primary biota emissions (Wang et al., 2011b; Li et al., 2012). In addition, sugar alcohols (mainly arabitol and mannitol) are abundant in airborne fungal spores (Fu et al., 2012). Temporal variations in relative abundances of biofuel combustion, plant photosynthesis and fungal spores derived sugars/sugar alcohols are shown in Fig. 6. A clear decreasing trend can be found for plant photosynthesis derived sugars in late August, which is coincident with the life cycles of vegetation in the Qinghai Lake region, because vegetation in Northeast Tibet Plateau begins to wither with decreasing temperature (also shown in Fig. 6). All of these sugars and sugar alcohols are emitted directly from the sources, and are completely soluble in water (Simoneit et al., 2004a). The linear relation with WSOC (R=0.69, Fig. S1a) suggests that sugars and sugar alcohols are the important components of WSOC in this region, which is different from those in urban areas, where WSOC in fine particles is largely derived from photochemical oxidation of gaseous organics (Feng et al., 2006).
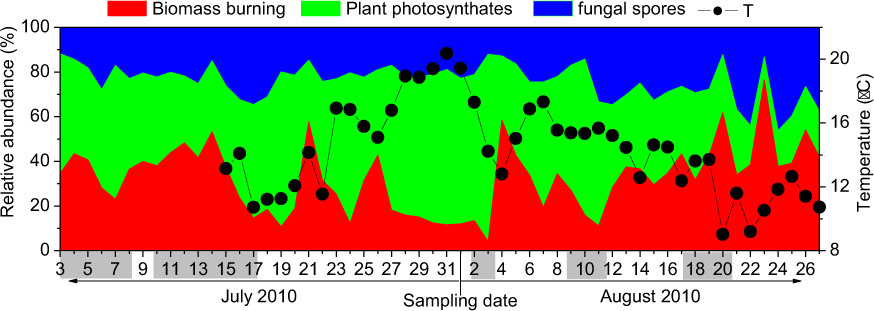
Fig. 6
Temporal variations of sugars (biomass burning derived sugars contain galactosan, mannosan and levoglucosan; plant photosynthate=fructose + glucose + sucrose + trehalose; fungal spores=arabitol + mannitol + inositol). Relative abundance: [(concentration of sugars from special source)/(concentration of total sugars)]×100%. Shadow denotes rainy weather.
3.2.1.3. PAHs and phthalic acids: Sixteen PAHs were determined in the PM2.5 samples with benzo(b)fluoranthene (BbF) being the most abundant, followed by benzo(e) pyrene (BeP) and chrysene/triphenylene (CT). PAHs concentrations in this study ranged from 0.08 to 1.9 ng m−3 with an average of 0.7±0.5 ng m−3, which is one order of magnitude lower than those in the free troposphere over east China such as the summit of Mt. Tai (1534 m a.s.l.) (Wang et al., 2009; Fu et al., 2012) and one to three orders of magnitude lower than those in Chinese urban areas (Wang et al., 2006a). Grimmer et al. (1981) reported that diagnostic ratios of IP/BghiP are 0.2, 0.5 and 1.3 in the smokes from gasoline, diesel and coal combustions, respectively. Ohura et al. (2004) further reported that BghiP/BeP is 2.0 and 0.8 in emissions from vehicle exhaust and coal burning. The ratios of IP/BghiP and BghiP/BeP in the Qinghai Lake samples are 1.2±0.14 and 0.48±0.16, respectively, indicating that PAHs in the plateau region are mostly originating from coal burning.
Phthalic acid is derived from the photochemical oxidation of PAHs such as naphthalene (Kawamura and Ikushima, 1993; Kawamura and Yasui, 2005). tere-Phthalic ( t-Ph) acid is a tracer for plastic waste burning since it is an important industrial material used for making plastics such as polyester fibre and PET (polyethyleneterephthalate) hermoplastics (Kawamura and Pavuluri, 2010). In this study, however, t-Ph seems to be a photooxidation product from low-molecular PAHs as it presents a significant correlation with PAHs (R=0.85, Fig. S1b), but we could not give a clear explanation on the current stage. Similar to PAHs, concentrations of phthalic acids in the PM2.5 samples are 2.6±1.5 ng m−3 and around two orders of magnitude lower than in Chinese urban areas (Wang et al., 2006a; Wang et al., 2010). PAHs and phthalic acids are largely produced from human activities, thus such lower levels of PAHs and phthalic acids in the samples suggest that aerosols in the Qinghai Lake atmosphere are indicative of the pristine characters of the continental atmosphere.
Han et al. (2009, 2010) subdivided EC into two classes: char-EC and soot-EC. Char is defined as carbonaceous materials that formed directly from pyrolysis or as an impure form of graphitic carbon obtained from partial burning or heating, while soot is defined as carbon particles that only forms at high temperature via gas-phase processes. Soot-EC exhibits stronger light-absorbing characteristics and transporting stability than char-EC (Han et al., 2009). Interestingly, PAHs in the Qinghai Lake aerosols showed a non-linear relationship (R=0.76) with soot-EC. This is because PAH is initially formed in the flame region during a combustion process and subsequently condensed onto soot-EC particles as temperature reduces.
3.2.1.4. Phthalates: Phthalates are widely used as plasticisers in synthetic polymers or softeners in polyvinylchlorides (PVC) (Simoneit et al., 2004b) and can be directly emitted from the matrix into the air as they are not chemically bonded with the matrix. Three phthalate esters, that is, diisobutyl (DiBP), di-n-butyl (DnBP) and BEHP, were detected in the Plateau aerosols. Concentrations of phthalates in the PM2.5 samples ranged from 0.3 to 5.5 ng m−3 with a mean value of 1.9±1.2 ng m−3, being two orders of magnitude lower than those in Chinese urban areas (Wang et al., 2006a).
3.2.2. Secondary organic aerosols
3.2.2.1. Polyols and polyacids: Polyols and polyacids were detected as a second most abundant organic compound class in the samples with a total concentration of 7.5±3.6 ng m−3. Succinic acid (2.5±1.3 ng m−3) is the most abundant compound in this group, followed by glycerol (1.3±0.9 ng m−3) and malic acid (1.3±0.8 ng m−3) (Table S1). Malic and glyceric acids are secondarily produced (Simoneit et al., 2004c; Kawamura et al., 2005), thus both linearly correlated each other (R=0.87, Fig. S2a). Moreover, both malic and glyceric acids well correlated with the determined BSOA tracers (R=0.83 and 0.79, Fig. S2b) (detail data described in the section below), probably suggesting that they are mostly derived from photochemical oxidation of biogenic VOCs in the plateau region.
3.2.2.2. Biogenic secondary organic aerosol: On a global scale, biogenic volatile organic compounds (BVOCs, 1150 Tg yr−1) are one order of magnitude more abundant than anthropogenic VOCs (Guenther et al., 2006). Isoprene is the most abundant BVOC in the global atmospheric environment, followed by monoterpene (such as α-/β-pinene) and sesquiterpene. Six compounds were determined as oxidation products of isoprene in the PM2.5 samples, which are 2-MGA, three C5-alkene triols (the sum of cis-2-methyl-1,3,4-trihydoxy-1-butane, 3-methyl-2,3,4-trihydoxy-1-butane and trans-2-methyl-1,3,4-trihydoxy-1-butane) and two 2-methyltetrols (the sum of 2-MT and 2-ME) (Table S1). 2-ME (0.9±0.8 ng m−3) is the most abundant compound in this group, followed by 2-MGA (0.5±0.3 ng m−3) and 2-MT (0.4±0.3 ng m−3), being consistent with those reported in Mt. Tai, East China (Fu et al., 2010, 2012). Mean ratio of 2-methyltetrols-C/OC in the PM2.5 samples at Qinghai Lake is 0.03±0.02%, which is similar to the level observed at an Arctic site (Alert, Canada 0.019%) (Fu et al., 2009) and one order of magnitude lower than those observed in mountain areas in central and east China (0.11–0.45%) (Wang et al., 2008; Li et al., 2013).
α-/β-Pinene oxidation products include norpinic acid, pinonic acid, pinic acid, 3-HGA and 3-methyl-1,2,3-MBTCA and so on. However, only HGA and MBTCA were detected in the Qinghai Lake aerosols. Chamber studies indicated that highly oxidised, acyclic and polar α-/β-pinene products such as MBTCA are likely derived from further oxidations of cis-pinonic acid or cis-pinic acid involving participation of OH radical (Jaoui et al., 2005; Szmigielski et al., 2007). Therefore, the fact that pinonic and pinic acids were not detected in the samples can be explained by the low level of α-/β-pinene in the region due to the lack of vegetation and increased oxidation of MBTCA precursors during transport. Concentrations of α-/β-pinene oxidation tracers are 3.0±2.7 ng m−3 in the PM2.5 samples. β-Caryophyllinic acid, one of β-caryophyllene (a sesquiterpene) oxidation products, was also determined in this study, and its concentration ranged from 0.05 to 2.4 ng m−3 (0.9±0.7 ng m−3).
Contributions of BVOCs to secondary organic carbon (SOC) in the atmosphere of Qinghai Lake were estimated using a tracer-based method reported by Kleindienst et al. (2007). Temporal variations of estimated biogenic SOC and meteorological parameters (temperature and relative humidity, T and RH) are shown in Fig. 7. Concentrations of estimated isoprene, α-/β-pinene and β-caryophyllene derived SOC are 0.7–26 ng m−3 (ave. 11±7.1 ng m−3), 1.3–45 ng m−3 (ave. 13±8.9 ng m−3) and 2.0–104 ng m−3 (ave. 38±30 ng m−3), accounting for 0.05–1.7%, 0.1–2.5%and 0.3–5.8% of OC, respectively.
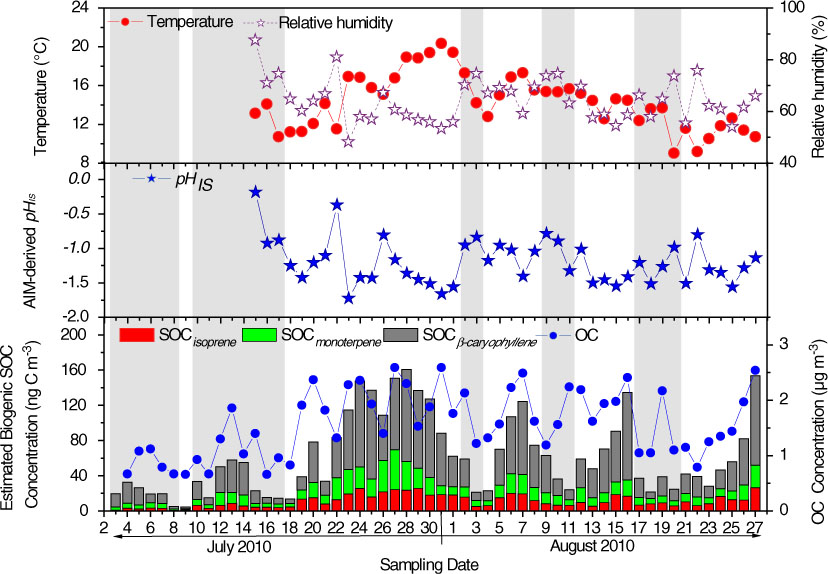
Fig. 7
Temporal variations of (a) temperature and relative humidity, (b) pHIS (particle acidity calculated using AIM model), and (c) estimated biogenic SOC concentration. Shadow denotes rainy weather.
Meteorological conditions are important factors affecting BSOA formation. In this study, we used 2-methyltetrols, two major tracers from isoprene photo-oxidation, to investigate the relationship between BSOA and meteorological factors. As shown in Fig. 8a, ambient temperature showed a positive linear relationship with 2-methyltetrols (R=0.66 and 0.69), probably due to enhancements in precursor emissions and/or photochemical reactions under a higher temperature condition. The slopes of MT and ME with temperature in this study are 0.063 and 0.14, respectively (Fig. 8a), one order of magnitude lower than those in mountain areas, central China (1.0 and 1.2 for MT and ME, respectively) (Li et al., 2013) and rural areas, southeastern China (1.9 and 3.3 for MT and ME, respectively) (Ding et al., 2011), indicating a relatively insignificant biogenic emission in Tibet Plateau in comparison with that in other regions. In our previous study on Mt. Hua aerosols (Li et al., 2013), we observed a significant negative relation between RH and BSOA concentration. In the current study, a negative relation (R=0.53 and 0.57, Fig. 8b) between 2-methyltetrols and RH was also found. Pathak et al. (2004) and Xue et al. (2011) reported that particle in situ pH (pHIS) strongly depends on RH and ratio of (R N/S). In this study, pHIS is also regressed as a function of RH and R N/S using the regression equation reported by Pathak et al. (2004) and Xue et al. (2011):
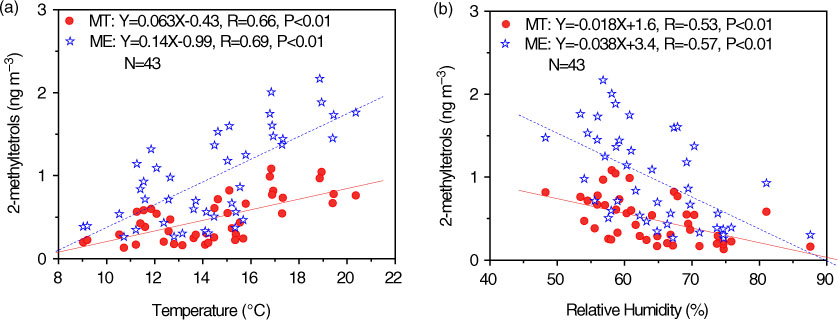
Fig. 8
Linear regression of concentrations of 2-methyltetrols with (a) temperature, and (b) relative humidity.
The calculated pHIS using eq. (2) are very close to AIM-derived pHIS (R=0.99, slope = 0.98, intercept = 0.03, Fig. S3), again confirming that high RH of the ambient air can reduce particle in situ acidity. Several chamber studies pointed out that acid catalysis takes on an important role in BSOA formation process (Surratt et al., 2010; Lin et al., 2012). Thus, such a negative correlation between RH and 2-methyltetrols suggests that high RH is unfavourable for BSOA formation.
3.3. Influence of anthropogenic activities and dust input: a back-trajectory analysis
During the sampling period, air masses at Qinghai Lake were mostly transported westerly from eastern parts of Gansu/Qinghai Provinces, where anthropogenic activities are relatively significant (Fig. 9). However, a few samples (9 out of 56 samples) were collected when the air masses were transported westerly from eastern Sinkiang Autonomous Region and western Qinghai/Gansu Province, where most regions are deserts. Thus, the total samples can be classified as two categories: (1) easterly, a group influenced by anthropogenic activity; and (2) westerly, a group influenced by dust. As shown in Fig. 10a, concentrations of OC, EC, WSOC, and in the air mass transported from the eastern region are 1.2–2.0 times more abundant than those from the west, consisting of the more significant human activity in eastern Gansu/Qinghai provinces. However, concentrations of WSIC, Ca2 + , Mg2 + and Cl− in the west air mass are 1.2–1.3 times higher than those in the east, which is caused by an input of dust from eastern Sinkiang Autonomous Region and western Qinghai/Gansu province. Compared to those from the west, air masses transported from the eastern region are also influenced by more biomass burning emission, which is probably the reason for higher concentrations of K+ in the east air masses. All of the detected organics showed lower concentrations in the desert-influenced samples.
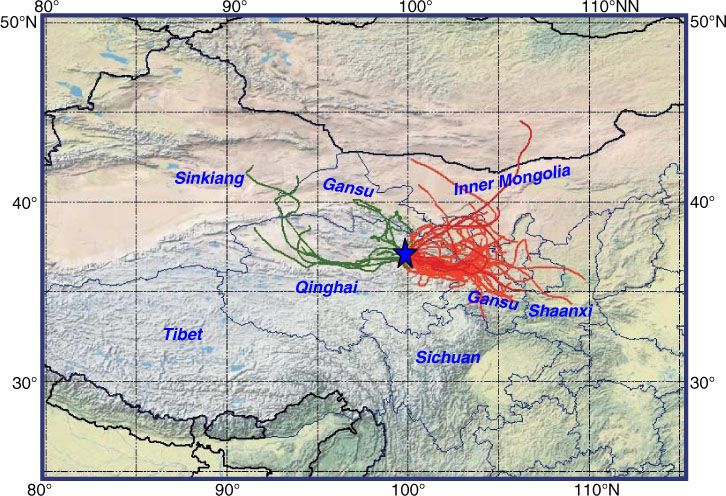
Fig. 9
Backward trajectories of air masses arriving in Qinghai Lake (36.98°N, 99.90°E, and the altitude were set as 3300 m a.s.l., 07/03–08/27/2010, local time, 24-hr interval). Red line: air masses transported from the eastern region of Qinghai Lake, Green Line: air masses transported from the western region of Qinghai Lake.
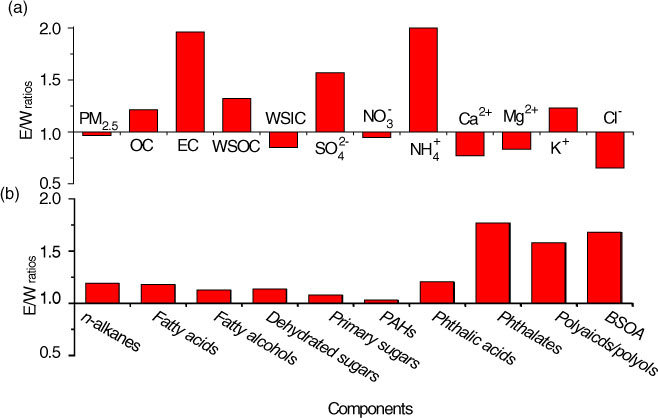
Fig. 10
Ratios of concentrations in air mass transported from easterly to that from westerly (E/W): (a) carbonaceous components and water-soluble inorganic ions and (b) organic compositions in PM2.5.
3.4. Comparison of the Qinghai Lake aerosol compositions with those in urban, rural and mountain atmospheres
Characteristics of atmospheric aerosols at Qinghai Lake are significantly different from those in other regions in China because of lower temperature, higher wind speed and stronger solar radiation. In general, concentrations of chemical compositions in PM2.5 are lowest in summer compared to other seasons (unreported data). In order to investigate the unique character of atmospheric aerosols in the plateau region, a comparison of chemical compositions of aerosols in plateau, mountain and urban regions over China during summer was made and is shown in Table 3.
Table 3. Comparison of summertime aerosol compositions with those in plateau, urban and mountain atmospheres
As shown in Table 3, mass ratios of / are 9.3 at Qinghai Lake and 19 at Waliguan, much higher than those at urban sites (1.6–3.1, Table 3). Recent studies have found that surface soil in Taklimakan and Gobi desert regions contains a significant amount of sulfate and a negligible amount of nitrate (Wang et al., 2011a; Wu et al., 2012; Wang et al., 2013). Thus, the high ratios again suggest that atmospheric aerosols in Qinghai Lake and Waliguan are significantly influenced by dusts emitted from these regions due to their proximity. In addition, high ratios of at both remote continental sites are possibly related to atmospheric processes. During long-range transport, sulfate can be continuously formed via SO2 oxidation and displaces pre-existing nitrate since H2SO4 is a strong and stable acid, which can result in the ratio high in aged aerosols such as those at the two sites.
CPI (odd/even) of n-alkanes has been employed to recognise the contributions from different sources, as it is nearly unity and >5 for fossil-fuel-derived- and plant-wax-derived n-alkanes, respectively (Simoneit et al., 2004b). CPI values showed that n-alkanes in aerosols of Qinghai Lake (CPI=4.1) and Mt. Hua (CPI=3.4) are dominated by plant wax sources, while fossil fuel combustion is the major source of n-alkanes in urban areas (CPI = 1.1–1.5). In addition to biologic emission, human cooking activity is another important source of fatty acids C16:0, C18:0 and C18:1 (Schauer et al., 1996), thus we used a diagnostic ratio of CFAs (sum of C16:0, C18:0 and C18:1)/TFAs (total fatty acids) to discuss the relative contribution of cooking activity. The ratio at Qinghai Lake (18%) is much lower than those in urban areas (46–72%), again indicating an insignificant contribution of cooking activities in the plateau region.
Two diagnostic ratios of C18:1 /C18:0 and BaP/BeP are used here to compare the level of aerosol ageing, because compared to the congeners, C18:1 and BaP are liable to photochemical degradation (Wang et al., 2012). The low values demonstrate that aerosols are more aged at Qinghai Lake (C18:1/C18:0=0.12 and BaP/BeP = 0.22). It is plausible that aerosols at Qinghai Lake are more oxidised than those in most mountain and urban area due to stronger solar radiation. However, the low values in Guangzhou and Shanghai may be the result of their higher temperature and RH, which are favourable for photochemical oxidation of aerosols. SOC derived by isoprene oxidation is an important fraction of OC in mountain areas (SOCiso/OC = 2.7–6.7%, Table 3) because of more vegetation. However, vegetation around Qinghai Lake is relatively rare, thus estimated SOC from isoprene only contributes to 0.70% of OC. The low contribution of BSOC to OC in Shanghai is largely caused by high anthropogenic OC input from vehicle exhaust and coal burning.
To further recognise the Qinghai Lake aerosol characteristics, mass balances of PM2.5 in different areas were reconstructed and are shown in Fig. 11. Organic matter (OM), EC and secondary ions (, and ) contribute only to 38% of PM2.5 mass at Qinghai Lake with the remaining being Ca, Mg and other metal elements, again suggesting the importance of mineral dust in Northeast Tibetan Plateau. Aerosols in the atmosphere of tropical rainforest (Amazonia, Brazil) showed a typical vegetation emission-dominated characteristic as OM accounts for 70% of PM2.5 mass. In addition, the mass balance of PM2.5 in Beijing and Shanghai indicated that Chinese megacities are significantly influenced by anthropogenic activity, resulting in high levels of PM2.5, EC, , and concentrations.
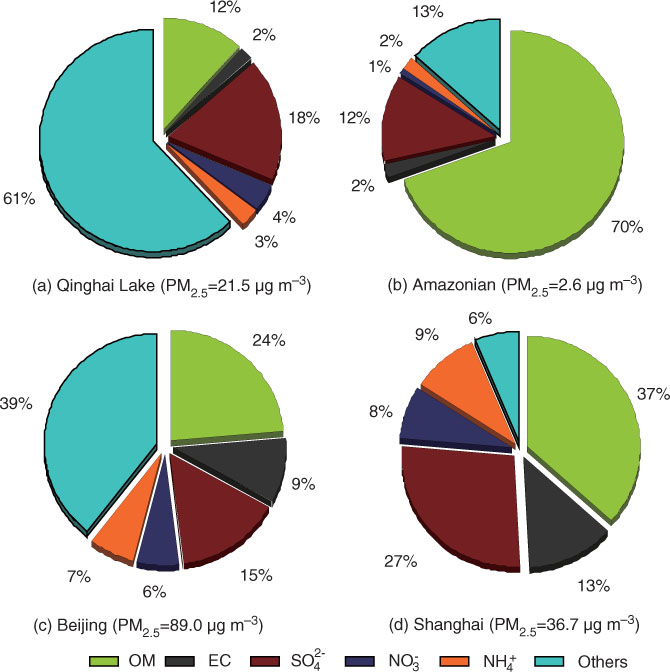
Fig. 11
Reconstructed mass balances of PM2.5 during summer in: (a) Qinghai Lake (this study), (b) Amazonian (Graham et al., 2003), (c) Beijing (Duan et al., 2006), and (d) Shanghai (Ye et al., 2003).
4. Conclusion
Molecular distribution of n-alkanes, fatty acids and fatty alcohols demonstrated that plant wax emission is an important source of these compounds in the Qinghai Lake region. K+ exhibited a strong correlation with Ca2 + rather than levoglucosan, indicating that dust from the desert regions is an important source of fine particles in the atmosphere over Qinghai Lake. BSOAs are very low due to the poor vegetation cover in the region. Our observation showed that higher temperature is favourable for BSOA formation. However, higher RH showed a suppression effect on BSOA formation, because higher humidity can reduce particle acidity and thus reduce the acid-catalysed formation of BSOA. OC, EC, WSOC, , and the detected organics are more abundant in the air mass transported from the eastern region, while WSIC, Ca2 + , Mg2 + and Cl− are higher in the west air mass, suggesting higher anthropogenic emission from easterly and more significant dust input from westerly. Aerosols in the Qinghai Lake atmosphere are more oxidised due to long-range transport and stronger solar radiation. Compared to those in mountain, rural and urban areas in central and east China, concentrations of anthropogenic organic aerosols in Qinghai Lake region are one to three orders of magnitude lower, and thus their molecular compositions are indicative of the pristine nature of the continental aerosols in the region.
5. Acknowledgments
This work was financially supported by the ‘Strategic Priority Research Program’ of the Chinese Academy of Sciences (Grant Nos. XDA05100103, XDB05020401) and the Ministry of Science & Technology of China (2007BAC30B00, 2012BAH31B00). The authors also thank the AIM Model group for using the AIM model.