Fig. 1.
Time series of daily mean total particle number concentration (coloured lines), median concentrations (black lines) and particle number concentration for the nucleation, Aitken and accumulation modes from 11 October 2010 to 6 June 2011. Warm period (October, April to June) is shaded in green and cold period (November to March) in blue.
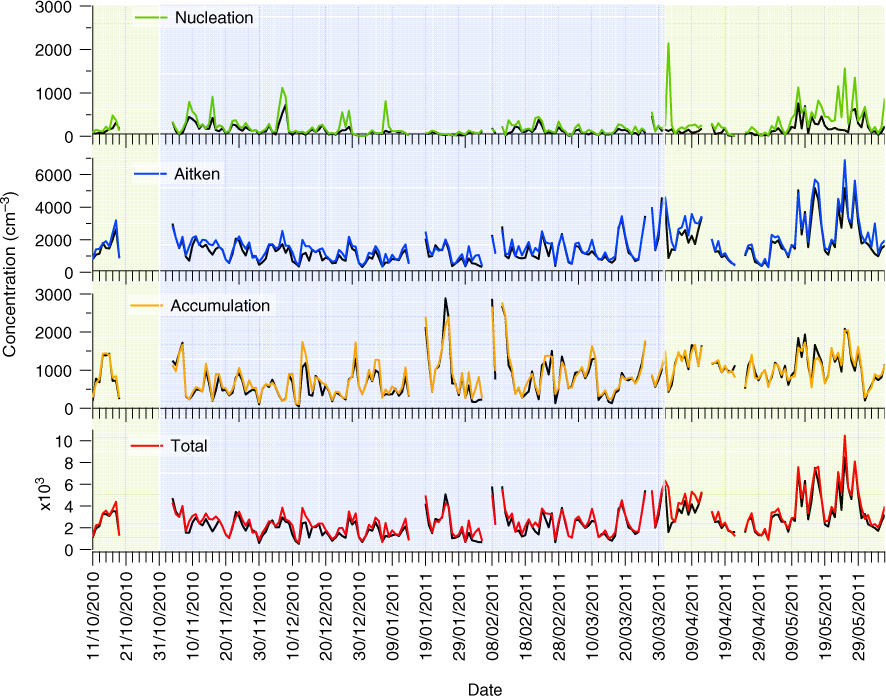
Table 1. Arithmetic mean (n) and median concentrations (ñ) of the Total, N9–20, N20–100 and N100–825 mode particles recorded at Montseny (MSY) for the entire colder period (C) and warmer period (W), and under polluted and clean conditions for measurements from October 2010 to June 2011
Fig. 2.
Daily concentration levels for BC (ng m−3), PM1, SO2 and NO2, O3 and NO (µg m−3) from 11 October 2010 to 6 June 2011. Warm period (October, April to June) is shaded in green and cold period (November to March) in blue.
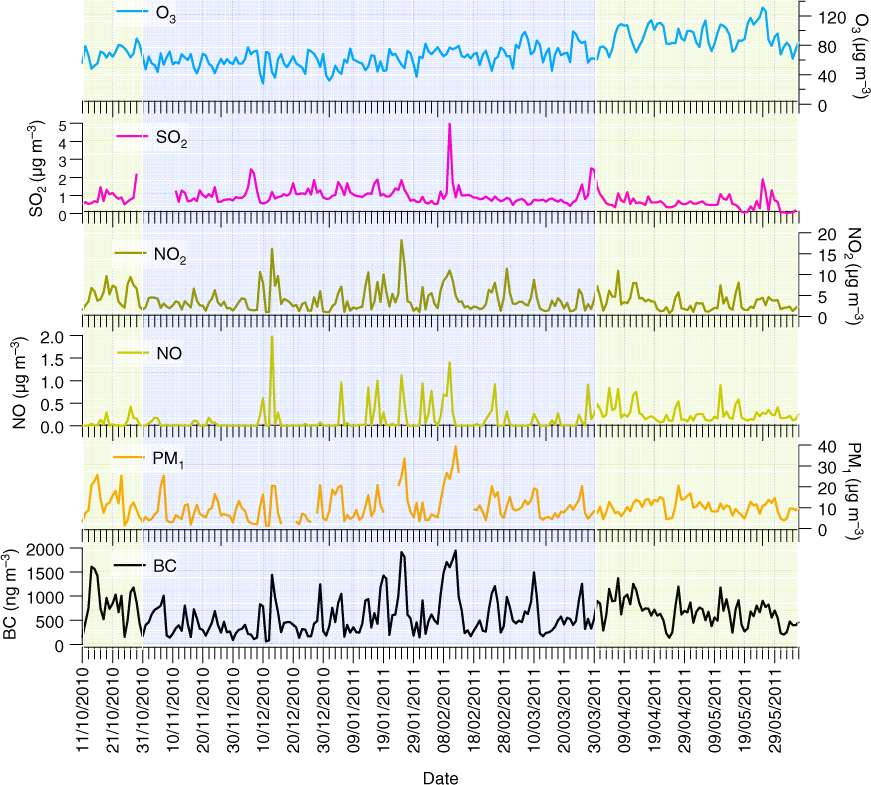
Table 2. Arithmetic mean and standard deviation for various aerosol parameters, pollutant gases and meteorological variables recorded at MSY for different periods throughout the measurement campaign
Fig. 3.
Histogram of N20–100 and N100–825 hourly median concentrations at MSY for the different periods. The concentration bins are evenly distributed along the concentration axis (20 bins/decade) and the y-axis shows the occurrence of each bin relative to the total number of measurements.
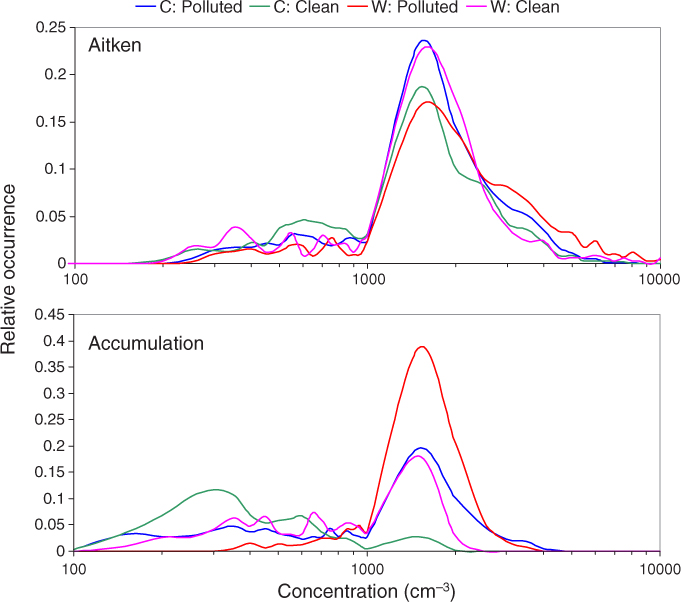
Fig. 4.
Median distributions for daytime (green lines), night-time (black lines) and modal fittings of daytime distribution (red lines) for periods C and W under polluted and clean conditions.
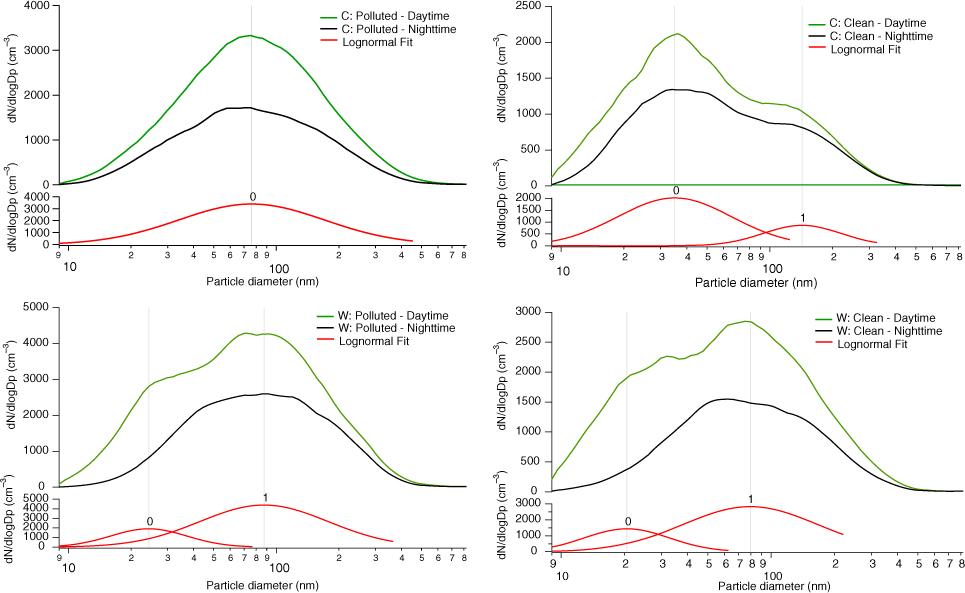
Fig. 5.
Median diurnal variation of particle number concentrations of nucleation, lower Aitken, upper Aitken and accumulation mode particles (cm−3); mean concentrations of BC (ng m−3), PM1, NO, NO2, O3, SO2 (µg m−3); temperature (°C), relative humidity (%), wind speed (m s−1), wind direction (°) and condensation sink (s−1) during C: Polluted.
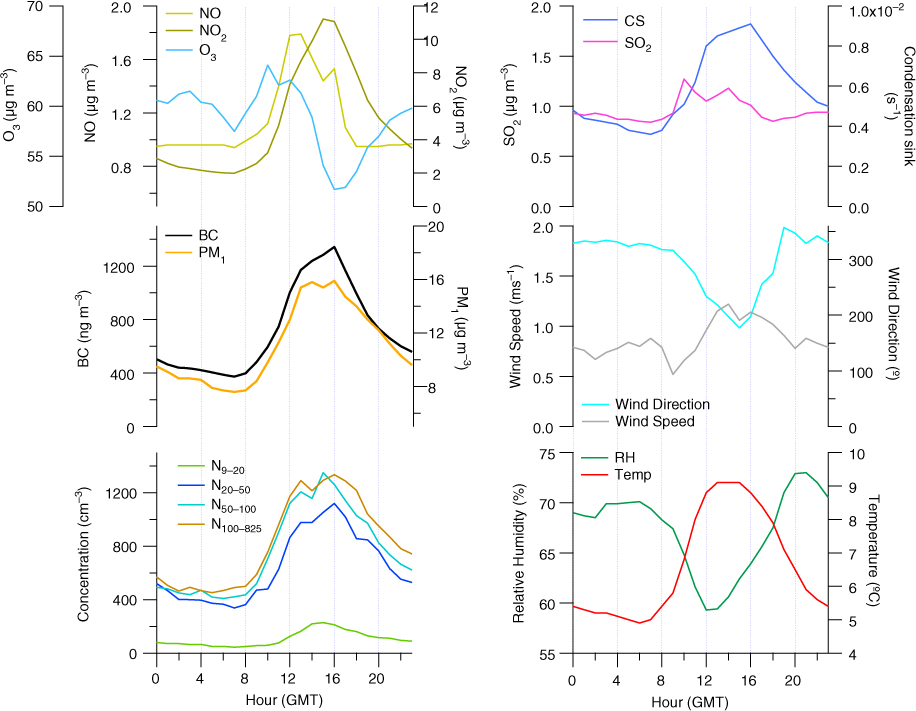
Fig. 6.
Median diurnal variation of particle number concentrations of nucleation; lower Aitken, upper Aitken and accumulation mode particles (cm−3); mean concentrations of BC (ng m−3), PM1, NO, NO2, O3, SO2 (µg m−3); solar radiation (W m−2), relative humidity (%), wind speed (m s−1), wind direction (°) and condensation sink (s−1) during C: Clean.
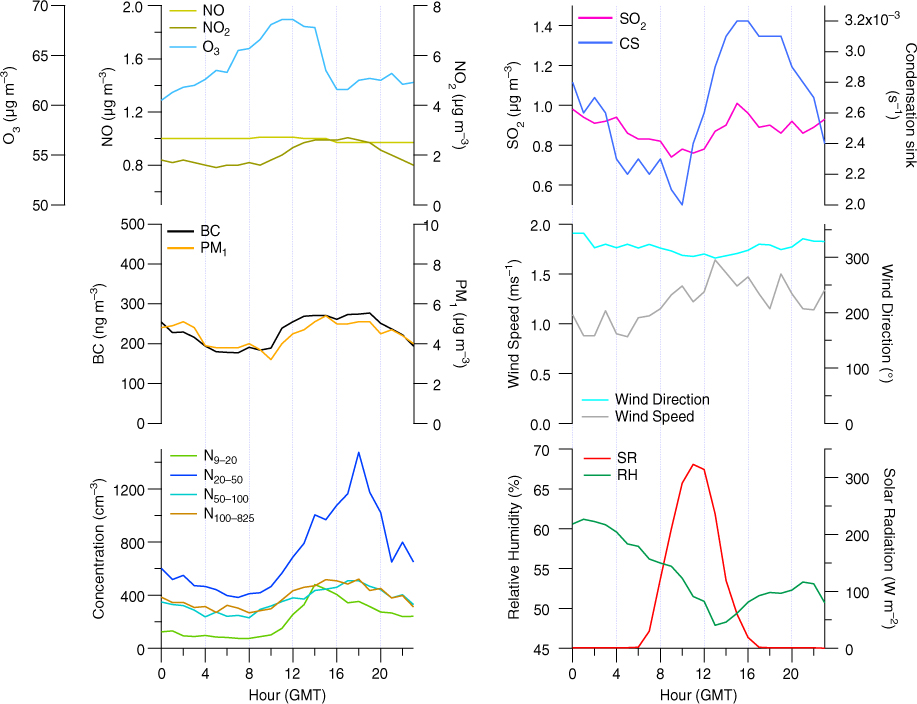
Fig. 7.
Days when elevated levels of N9–20 occurred during C: Clean; the hour (GMT) when maximum particle number concentrations are reached for nucleation (green) and lower Aitken (blue) mode and the respective particle number concentrations. Black dots indicate when peak N9–20 and N20–50 particle number concentrations occur at the same time.
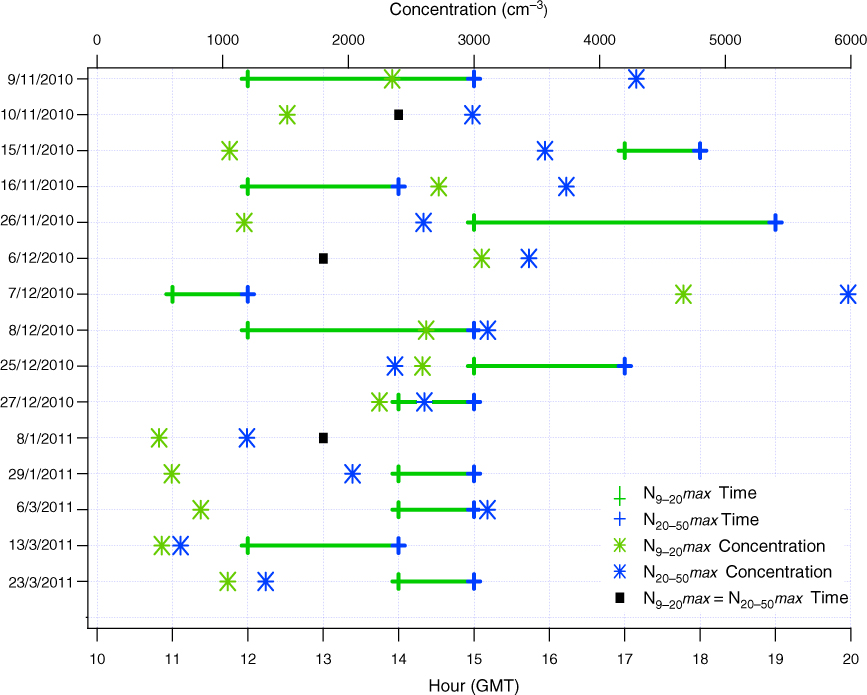
Fig. 8.
Time series of a nucleation event recorded during C: Clean on 25 December 2010 showing the contour plot of the particle number size distribution, with median particle number concentration of nucleation and lower Aitken (left axis), and upper Aitken and accumulation mode (right axis) concentrations, PM1, BC, condensation sink and solar radiation, wind speed and wind direction.
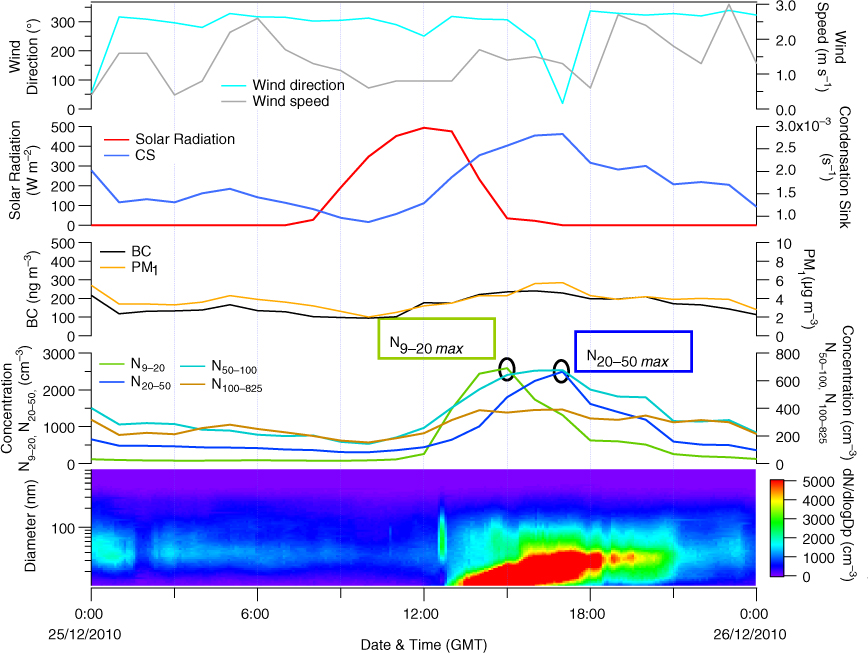
Fig. 9.
Median diurnal variation of particle number concentrations of nucleation, lower Aitken, upper Aitken and accumulation mode particles (cm−3); mean concentrations of BC (ng m−3), PM1, NO, NO2, O3, SO2 (µg m−3); solar radiation (W m−2), relative humidity (%), wind speed (m s−1), wind direction (°) and condensation sink (s−1) during W: Polluted.
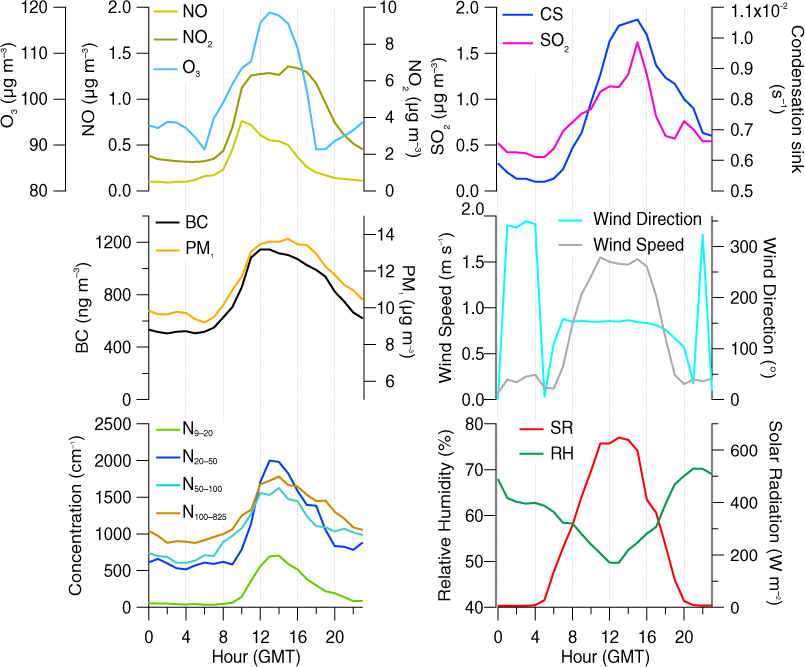
Fig. 10.
Time series of a nucleation event recorded during W: polluted on 6 June 2010, with the contour plot of the size distribution and median particle number concentrations of nucleation, lower Aitken (left axis), upper Aitken and accumulation modes (right axis), BC mass concentration, condensation sink, solar radiation, a proxy for [H2SO4], wind speed and wind direction.
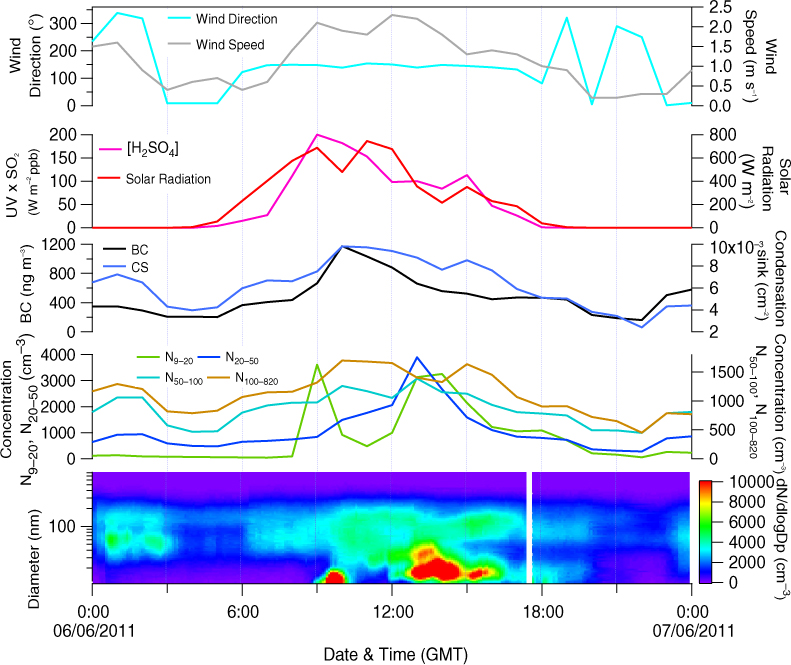
Fig. 11.
Median diurnal variation of particle number concentrations of nucleation, lower Aitken, upper Aitken and accumulation mode particles (cm−3); mean diurnal variation of BC (ng m−3), PM1, NO, NO2, O3, SO2 (µg m−3); solar radiation (W m−2), relative humidity (%), wind speed (m s−1), wind direction (°) and condensation sink (s−1) during W: Clean.
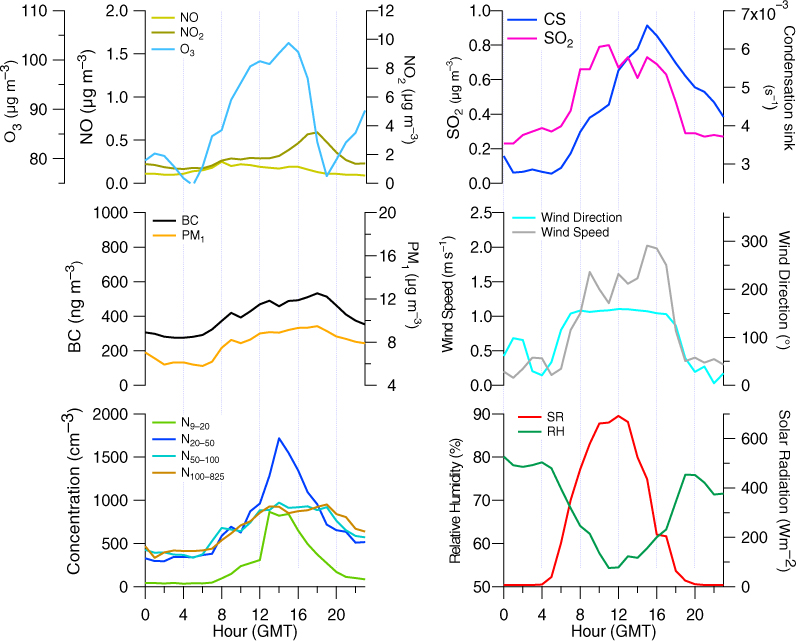
Fig. 12.
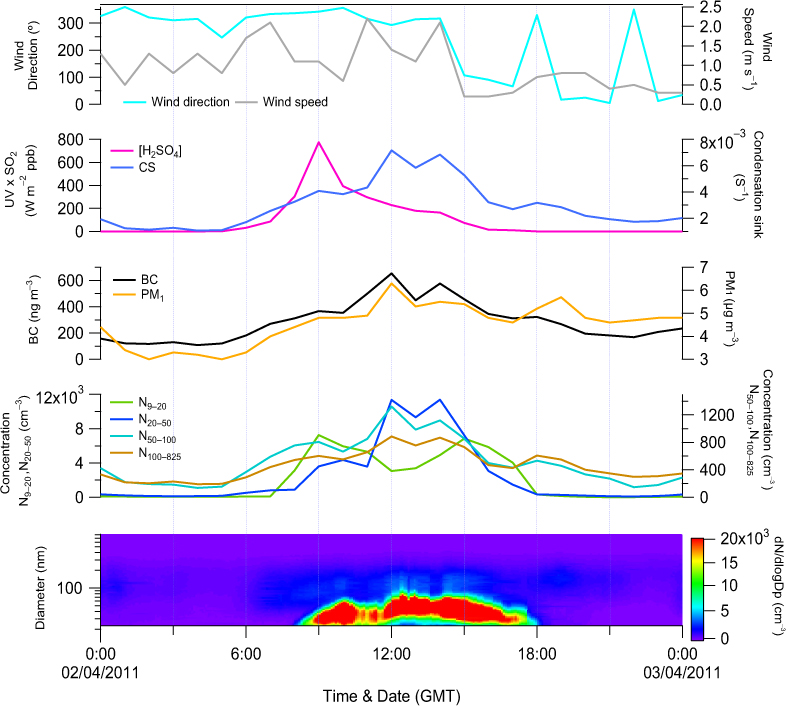
Time series of a nucleation event recorded during W: Clean on 2 April 2011 with the contour plot of the size distribution and particle number concentration of nucleation, lower Aitken (left axis), upper Aitken and accumulation modes (right axis); PM1 and BC mass concentrations; condensation sink; a proxy for [H2SO4] concentrations, wind speed and wind direction.