
1. Introduction
The main sources of the mineral dust are the deserts which inject mineral dust in the atmosphere (Goudie et al., 2003; Xuana et al., 2004). The Sahara Desert is the major contributor to nearly half of the total dust load at a global scale. It not only influences the aerosol loading to Africa, the Atlantic Ocean, South America and the East coast of USA but also to that of Europe. However, the radiative effect of mineral dust is not well quantified (Kalashnikova and Sokolik, 2004; Durant et al., 2009). The global radiative forcing due to dust is numerically estimated to be negative (Myhre et al., 2003). The pure mineral dust, which is absorbing in UV and VIS because of hematite content (Fe2O3) present in the dust, is transported to long distances (Afeti and Resch, 2000; Chin et al., 2007) where it interacts with the carbonaceous species like black carbon (BC) and organic carbon (OC) emitted from anthropogenic activities over a polluted place. This gives rise to complex agglomerates which can be stated as polluted dust (Lelieveld et al., 2002; Sullivan and Prather, 2007; Yang et al., 2009b). The sources of carbonaceous pollutants are very diverse, which include biomass burning, industrial and vehicular emissions. These sources give rise to various light-absorbing components like BC, brown carbon (BrC) (Alexander et al., 2008; Yang et al., 2009a; Chakrabarty et al., 2010) and OC comprising HULIS. HULIS is basically HUmic-LIke Substances (Dinar et al., 2008) in the atmosphere. This resembles with humic substances from terrestrial and aquatic sources and is a major fraction (>50%) of water-soluble organic carbon (WSOC) composed of high molecular weight multifunctional compounds (Seinfeld, 2006) containing aromatic, phenolic and acidic functional groups (Varga et al., 2001; Graber and Rudich, 2006). Among the carbonaceous components, BC and OC are thought to be major components (Liousse et al., 1996) which mix with the accumulation mode (0.1–1 µm radius) mineral dust during transport over the polluting zone. Among the carbonaceous components, BC is the highest absorbing whereas OC is the least and BrC (BrC is nothing but the OC which is mild absorbing at visible wavelength) lies in between.
The BC particles warrant special attention because of their complex role in climate (Ackerman et al., 2001; Menon et al., 2002; Koch and Genio, 2010), long-range transport (Subramanian et al., 2010) and large surface area that may facilitate heterogeneous reactions (Chughtai et al., 2002). The BC aerosols are generated in the atmosphere due to incomplete combustion of fuel oil, coal and biomass (Griffin and Goldberg, 1979). The composite mixture of pure mineral dust with carbonaceous pollutants differs from pure mineral dust in terms of particle morphology, chemical composition (governing refractive index), hygroscopicity and cloud condensation nuclei. These characteristics of the polluted mineral dust govern the deviation in optical properties and radiative forcing compared to that of pure mineral dust.
The radiative effect of dust systems is evaluated by feeding their physical and chemical properties in the radiative models (Tegen et al., 1996; Liao and Seinfeld, 1998). The sources of uncertainties in the radiative forcing estimation include mineral aerosol shape (Kalashnikova and Sokolik, 2002; Wang et al., 2003; Volten et al., 2005), proportion of hematite content in mineral dust (Mishra and Tripathi, 2008) and their mixing states with carbonaceous components (Bauer et al., 2008). The radiative forcing imposed by the atmospheric aerosols can be computed by summing over the entire aerosol population. The assumptions about the proportions are made on the basis of how different aerosol components are mixed together in the mixture. The optical properties of polluted aerosols are numerically estimated on the assumptions that either the particles are mixed externally (where various aerosol species exist independently) (e.g. Tegen et al., 1997; Lesins et al., 2002; Stier et al., 2005) or mixed internally (one or several small aerosol particles are imbedded in a larger host particle or making a homogeneous composite aerosol) (Ackerman and Toon, 1981; Lesins et al., 2002). Core–shell structure of the particle has also been considered in many studies (Bond et al., 2006; Moteki et al., 2007; Shiraiwa et al., 2007). The real mixed state can be expected to lie somewhere in between the external and internal mixing extremes. Based on the individual particle morphological analysis using scanning electron microscopy (SEM), transmission electron microscopy (TEM), high-resolution transmission electron microscopy and X-ray analysis (Clarke et al., 2004; Alexander et al., 2008 (science supplement); Takahama et al., 2010), the semi-external mixing state (two or more aerosol particles are in physical contact and form an aggregate) can be inferred. The climatic impact of aerosols is estimated using General Circulation Model (GCM), where aerosol radiative forcing is fed as input. The aerosol radiative forcing depends on the optical properties which further depend on the mixing states in case of polluted dust. In general, the external mixing is being considered as the mixing state in GCM (Adams et al., 2001; Koch et al., 2006; Shinozuka et al., 2009), which leads to erroneous predictions. Some GCM models also account for internal mixing and core–shell mixing (Bauer et al., 2010). The optical properties of external and internal mixture of mineral dust and BC have been modelled by several scientists (Jacobson, 2000; Lesins et al., 2002). Bond et al. (2006) estimated the optical properties of core–shell structure, covering the whole range of possible scenarios. In their study, they considered core and shell to be composed of more absorbing carbon and weakly absorbing carbon, respectively. Liu and Mishchenko (2007) demonstrated the effects of aggregation, fractal morphology and refractive index on the optical properties of soot aerosols. When the different aerosols form an aggregate (semi-external mixtures) they lie in the near field zone of each other, and their scattering and radiative properties can differ from those of composition-equivalent external mixtures. The differences may be so large that it influences the results of remote-sensing studies of tropospheric aerosols and their radiative forcing estimations significantly (Sato et al., 2003 and references therein). So, to address the radiative forcing uncertainties for the polluted mineral dust, the mineral dust shapes, variation of hematite content (Fe2O3) and the mixing state with all possible carbonaceous components should be accounted for modelling the polluted dust optics.
To explore the physical, chemical and optical properties of the mineral dust, Saharan Mineral Dust Experiment (SAMUM) was conducted in two phases: SAMUM-1 (in 2006) and SAMUM-2 (in 2008). SAMUM-2 focused on the far-transported, aged dust and on the mixtures of the dust with marine, urban and biomass-burning aerosols. The main scientific objectives of SAMUM-2 were the impact of ageing and mixing processes on microphysical, optical and radiative properties of Saharan dust. During the winter campaign, Knippertz et al. (2011) showed the layer of smoke/dust mixtures above a clean maritime boundary layer together with pure smoke and dust layers.
During SAMUM-2, Gasteiger et al. (2011) numerically estimated the lidar-relevant optical properties of mineral dust aerosols and compared them with the optical properties derived from lidar measurements. They modelled the mono-disperse optical properties using Discrete Dipole Approximation (DDA) optical code. The optical properties for the ensemble of the particles were expressed using OPAC database (for the desert aerosol type) and some assumed proportions of absorbing and non-absorbing mineral dust. Consideration of irregularly shaped dust particles with typical refractive indices showed the higher linear depolarisation ratios than that of spheroidal model shapes. The consideration of irregular dust particles in the simulation was found to improve the agreement with the observations.
During SAMUM, for the first time, Wiegner et al. (2009) measured the spectral dependence of particle linear depolarisation ratios using four lidar systems. The measurements were compared with the modelled parameters. For simulating the lidar-derived optical properties, the T-matrix method was used by feeding the in situ measurements – zand refractive index. The particle shape was considered as spheroid for above simulation. In this study, the lidar-related parameters such as lidar ratio and the linear depolarisation ratio were found to be very sensitive to the changes in the input parameters fed in the T-matrix code. The simulated values of the linear depolarisation ratio was found in the range of 20 and 31% and found to agree well with the measurements.
Xie et al. (2008) measured the aerosol optical properties using compact Raman lidar over Beijing, China. In the moderate pollution episode, the averaged aerosol extinction below 1 km height was found to be 0.39±0.15 km−1 and the lidar ratio was 60.8±13.5 sr; in heavy pollution episode, they were 1.97±0.91 km−1 and 43.7±8.3 sr; in an Asian dust episode, they were 0.33±0.11 km−1 and 38.3±9.8 sr. The total depolarisation ratio was found to be less than 10% in the pollution episode, whereas it was more than 20% in the Asian dust episode. More insight of the sensitivity of lidar-related optical properties could be explored by simulation of polluted dust optics accounting for mixing of dust with the carbonaceous species.
During SAMUM, in 2008, Petzold et al. (2011) used a nadir-looking high spectral resolution lidar (HSRL) equipped in the German research aircraft Falcon to study the mixing of the urban pollution plume of Dakar (Senegal) with mineral dust. In this experiment, the mineral dust layer as well as the urban pollution plume was probed remotely by the HSRL. Back trajectory analysis was used to identify the source. The emission from the region of Dakar was found to increase the aerosol optical depth (at λ=532 nm) from approximately 0.30 over sea and over land (East of Dakar) to 0.35 in the city outflow. In the dust layer, the single-scattering albedo at 530 nm was 0.96–0.99, whereas the same has been found to be 0.908±0.018 for the aerosol dominated by urban pollution. The variation in single-scattering albedo could be better understood by doing sensitivity analysis in optical model after accounting for various particle mixing states.
To date, there is no rigorous and comprehensive polluted dust optical model available, which deals with the semi-external mixing of mineral dust with all kinds of carbonaceous components together with particle non-sphericity and hematite variation (0–6%). The optical properties of semi-externally mixed polluted mineral dust are rarely modelled and limited to two-sphere particle system with strong size gradient between the spheres (Mishchenko et al., 2004). The optical properties of such particle systems have been found to be the same as that of bigger sphere in the two-sphere system.
The hematite contribution from the mineral dust is found to vary largely (Koven and Fung, 2006; Formenti et al., 2011). On the basis of this hematite variation, the hematite fraction in pure mineral dust is constrained between 0 and 6% in the present study. The information on morphological and mineralogical characterisation of the polluted dust [Clarke et al., 2004; Alexander et al., 2008 (science supplement); Takahama et al., 2010] led to consider the three-sphere, two-sphere and two-spheroid model shapes for polluted dust particle system. All the above-discussed model shapes were considered for the mineral dust getting polluted with (1) BC, (2) OC (especially HULIS) and (3) BrC by making a semi-external mixture with the considered hematite content. The model shapes for the polluted dust systems considered are shown in the Fig. 1. Table 1 shows the abbreviations of the considered model shapes. The polluted dust morphology is discussed in the morphology section (Section 2). The feasibility of considered mixing combinations and the optical constants for the components are discussed in the polluted dust composition section (Section 3).
Fig. 1.
The pure mineral dust (shown with yellow sphere) mixed with the carbonaceous components like organic carbon (OC), brown carbon (BrC) and black carbon (BC) shown with pink, dark tan and black spheres, respectively (first column, top to bottom). Semi-externally mixed polluted mineral dust two-sphere and two-spheroid model shapes consisting of mineral dust with OC, BrC and BC, respectively (second and third columns, top to bottom). BrC mineral dust two-spheroid model shape has not been modelled as BrC occurs in spherical form. The three-sphere model shape of mineral dust with OC, BrC and BC, respectively (fourth column, top to bottom). Some of the three-sphere systems were modelled with fly-ash (shown with grey sphere) based on the experimental observations.
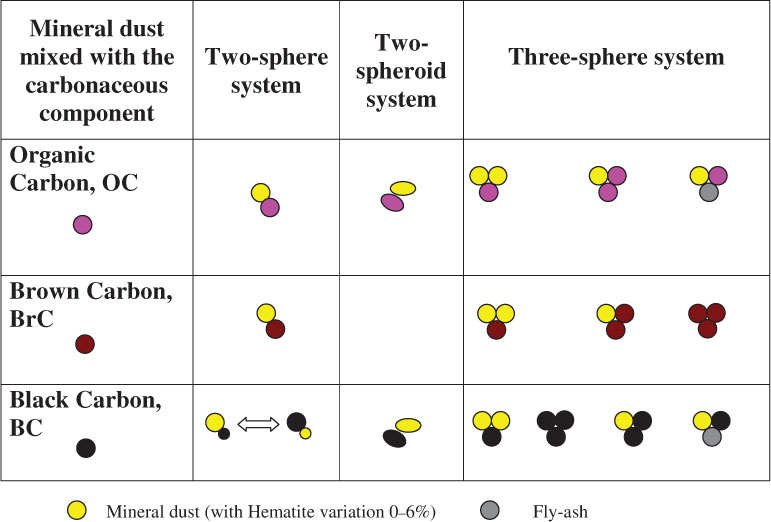
Table 1. The considered model shapes with their abbreviations
For computation of optical properties of the non-spherical particles, T-matrix (Mishchenko and Travis, 1998; http://www.giss.nasa.gov/~crmim) and DDA code (Draine and Flatau, 2004; http://arxiv.org/abs/astro-ph/0409262v2) are very popular amongst the available codes. T-matrix method computes light scattering for polydisperse, randomly oriented, rotationally symmetric particles such as sphere, spheroid, cylinder and chebyshev particles while the DDA method computes light scattering for randomly oriented, spherical and non-spherical particles such as spheroids, rectangular solids, cylinders, hexagonal prisms, etc. The volume equivalent radius of the non-spherical particle (r eff), refractive index, wavelength (µm), particle shape and the particle shape parameters are the inputs to the DDA code. The r eff is the volume equivalent radius of the composite particle. The shape parameters govern the aspect ratio and extent of the target in X, Y and Z directions whose optical properties are to be modelled. The outputs of the code are extinction, scattering and absorption efficiencies (Q ext, Q sca and Q abs), asymmetrical parameter (g) and the scattering matrix elements. The DDA works well in the size parameter regime, α<15 while the T-matrix works well for α<40 where α is the ratio of the perimeter of the particle to the wavelength of the incident light (α=2*pi*r eff/λ).
2. Dust morphology
In general, the mineral dust particles are not spherical. The particle non-sphericity is characterised by the aspect ratio (Reid et al., 2003), which is defined as the ratio of major axis length to minor axis length. The aspect ratio is a measure of the asphericity of a particle. It is equal to one for a spherical particle and greater than 1 for elongated particles such as ellipsoids.
Chou et al. (2008) collected the mineral dust particles in Niger (northern Saharan Desert) for their physical and chemical characterisation. The dust morphology was studied using a combination of SEM and TEM equipped with an energy dispersive X-ray detection system. The particles have been analysed using the HISTOLAB program. The aspect ratio of about 31 000 sampled particles was studied and found to be practically independent of size for particles of diameter ranging 0.1–10 µm. The upper limit of the aspect ratio was found to be 5, whereas the median was 1.7. Kandler et al. (2007) reported the aspect ratio to be 1.64 for the Saharan mineral dust at Izana, Tenerife (Spain). Reid et al. (2003) showed a higher value of aspect ratio (1.9) for African mineral dust collected over the Caribbean after being transported over the North Atlantic Ocean. Okada et al. (2001) studied the shape of atmospheric mineral particles collected in three Chinese arid regions. They reported the median aspect ratio to be 1.4 for mineral particles with radius ranging 0.1–6 µm. Kandler et al. (2009) reported the median aspect ratio to be 1.6 for the dust particles (sized > 0.5 µm) from West Sahara. The latest retrieval results of the column volume distribution based on Aerosol Robotic Network (AERONET) Sun-photometric measurements indicate that non-spherical particles with AR ≥ 1.5 dominate in desert dust plumes (Dubovik et al., 2006). The dust morphological study of Parungo et al. (1997) on Asian dust storms also revealed the aspect ratio to be 1.5. From the foregoing discussion, it can be concluded that a reasonable value of aspect ratio is 1.5 for dust particles collected from global deserts. Therefore, this value is used in all the calculations wherever spheroidal shape is assumed in the study.
On the basis of the particle images [Clarke et al., 2004; Shi et al., 2005; Alexander et al., 2008 (science supplement); Arimoto et al., 2006; Derimian et al., 2008; Takahama et al., 2010], the model shapes representing the polluted dust are considered as two-sphere, two-spheroid and three-sphere system as shown in Fig. 1.
On the basis of the rigorous analysis of the particle images (discussed earlier), it has been observed that there exist combinations of sizes for the individual spheres/spheroids, which form the two-sphere, two-spheroid or three-sphere systems. So, to simplify the problem and to reduce the computational burden, the model shapes considered in the Fig. 1 are assumed to be comprised of same size individual spheres/spheroid except in the case of two-sphere BC-mineral dust system. The two-sphere BC-mineral dust system comprises spheres of varying sizes. The above system is considered to quantify the effect of R BC/R dust (R BC and R dust are the radii of individual BC and dust spheres, respectively) on the optics of composite two-sphere system. The R BC/R dust is constrained from 0.9 to 1.5. The ratio could not be further reduced due to code limitations.
The three-sphere system comprises three spheres of same size and attached to each other. Takahama et al. (2010) analysed particle morphology and distribution of chemical species within individual particles using the spectroscopic techniques. In their study, they employed scanning transmission X-ray microscopy with near-edge X-ray absorption fine structure spectroscopy with image analysis and pattern recognition techniques. They characterised the chemical structure of 636 particles collected on six field campaigns in the Western Hemisphere between 2004 and 2008. Most of the particles were found to be chemically heterogeneous. Several particles (106) were traced as a dust system comprising mineral dust as host and organic clumps attached to host. The majority of polluted particles lie in the radius range of 0.1–1 µm. But the mixing of mineral dust with the carbonaceous species is not limited to the accumulation mode only. The bigger size dust particles have also been found to mix with carbonaceous species. As the DDA code, which is used to calculate the optical properties, is limited to particle effective radius of 1.0 µm, the computations could only be performed and results presented for the accumulation mode aerosols. To our knowledge, there is no robust optical code which can account for all the polluted dust systems (what have been discussed in the present work using DDA) in a bigger sized regime. Therefore, the present work is limited to the study of polluted dust optics in the accumulation mode only. The two-spheroid system comprising two spheroids of same size is considered to attach with each other at 30° orientations (here, contact angle = 30°).
3. Composition of polluted dust
The polluted dust is considered to be a semi-external mixture of the pure mineral dust with the carbonaceous components shown in Table 3. The optical constants for the pure mineral dust, at 0.550 µm wavelength, are taken from the study by Mishra and Tripathi (2008). They varied the hematite percentage to check its effect on the optical properties, as hematite is the major absorbing component in the pure mineral dust. The hematite fraction in the global dust has been inferred to be 3.75–11.97% (Koven and Fung, 2006). In the present study, to check the sensitivity of the dust optical properties to the hematite content, the optical constants for 0–6% hematite variation are considered from Table 2. The optical constants from Tables 2 and 3 are used to model the polluted dust optics.
Table 2. Optical constants (at λ=0.550 µm) of mineral dust component for varying hematite percentage obtained from Mishra and Tripathi (2008)
Table 3. Optical constants of carbonaceous components and fly-ash
A considerable part (up to 50% or in specific cases, e.g. biomass burning aerosols, >50%) of the atmospheric OC is found as WSOC (Facchini et al., 1999; Kanakidou et al., 2000; Agarwal et al., 2010; and reference therein). Dinar et al. (2008) measured the refractive indices of the HULIS substance extracted from air pollution particles which were sampled from 18 May 2006 till June 2006 during daytime in an urban location (Weizmann Institute, Rehovot, Israel). The refractive index (m=1.595 + i0.049) has been measured at 532 nm using a dual-wavelength Cavity Ring Down Aerosol Spectrometer. This HULIS compound has been considered as the representative of aged OC coming from pollution. In the present study, for modelling the semi-externally mixed OC-mineral dust systems, the above-mentioned HULIS (i.e. the major fraction of OC) is considered and represented as OC.
On the basis of electroscopic studies [Clarke et al., 2004; Shi et al., 2005; Arimoto et al., 2006; Alexander et al., 2008 (science supplement); Derimian et al., 2008; Moffet et al., 2010] for the mineral dust polluted with BC and fly-ash, various mixing scenarios are accounted for by considering different combinations (spheres with different composition). One BC sphere attached to two dust spheres (denoted as BCDD), two BC spheres attached to one dust sphere (denoted as BCBCD), one BC sphere attached to dust and fly-ash spheres (denoted as BCDF) and the three BC spheres attached to each other (denoted as BCBCBC) are the possible BC-dust three-sphere systems. The possibility of three dust spheres attached to each other (denoted as DDD) is not supported through the chemistry involved in the system formation, so this system is ignored.
On the basis of the studies (Takahama et al., 2010; Moffet et al., 2010), the mineral dust polluted with OC is considered with set of combinations (spheres of different composition). One OC sphere attached to two dust spheres (denoted as OCDD) and two OC spheres attached to one dust sphere (denoted as OCOCD) are OC-dust three-sphere systems. As fly-ash is also the major outcome of combustion processes, so the probability of fly-ash to attach the OC-mineral dust system cannot be ignored. One fly-ash sphere being attached to one dust and one OC sphere (denoted as OCDF) formulates another combination. To the best of our knowledge, there is no literature available to date which could support the existence of three OC spheres being attached to each other (denoted as OCOCOC). The modelled optical properties for the OCOCOC system will not make the major change, as OC is the weak absorber. Therefore, OCOCOC system is not considered for simulation.
The studies (Alexander et al., 2008; Yang et al., 2009a; Chakrabarty et al., 2010) highlighted the existence of BrC in the atmosphere in the spherical form. The BrC is classified as a special class of OC which is highly absorbing at short wavelengths. Likewise OC, the BrC is expected to attach with the mineral dust to form various BrC-mineral dust systems. One BrC sphere attached to two dust spheres (denoted as BrCDD) and two BrC spheres attached to one dust sphere (denoted as BrCBrCD) are the BrC-dust three-sphere systems. The three BrC spheres attached to each other (denoted as BrCBrCBrC) are modelled to compare with the conjugate BCBCBC system. To the best of our knowledge, no particle image of BrC is available to support the BrCBrCBrC model shape. One BrC sphere attached to dust and fly-ash spheres (denoted as BrCDF) is not modelled because of unavailability of the particle images to support the model composition.
Thus, using morphological distribution of chemical composition and the mixing state information, model shapes are decided (as shown in Fig. 1 and described in Table 1) for the numerical estimation of the polluted dust optics using DDA model.
4. Results and discussion
The optical properties (single scattering albedo, ω 0; asymmetrical parameter, g; and extinction efficiency, Q ext) are the function of particle size, shape and refractive index (governed by chemical composition) together with complex mixing states.
In situ, point measurement of ω 0 is carried out using a combination of various instruments such as Nephelometer, Aethalometer, Photo Acoustic Soot Spectrometer. Alternatively, one can calculate ω 0 by feeding measured morphological, mixing states and chemical composition information. To date there are limited experimental observations of g. Similar to ω 0 and g, Q ext is an important parameter for determining the optical and radiative properties.
4.1. Optics of two-sphere/spheroid system
4.1.1. Two-sphere BC-mineral dust system (system comprising of varying size BC and dust spheres).
The optical properties of the two-sphere BC-mineral dust system are modelled for varying sizes of BC and mineral dust. The morphology of such system is already discussed in Section 2.
Figure 2 shows the ω 0 of the two-sphere BC-mineral dust system for varying effective radius and with hematite variation from 0 to 6%. The ω 0 of two-sphere BC-dust system is modelled for decreasing R BC/R dust (from 1.5– to 0.9) with increasing effective radius (from 0.1 to 0.8 µm) of the composite particle. The ratio, R BC/R dust, is 1 for the effective radius of 0.64 µm of the BC-mineral dust system.
Fig. 2.
The ω 0 of the BC-mineral dust two-sphere system for the effective volume equivalent radius of the two-sphere system with the varying hematite percentage in the mineral dust.
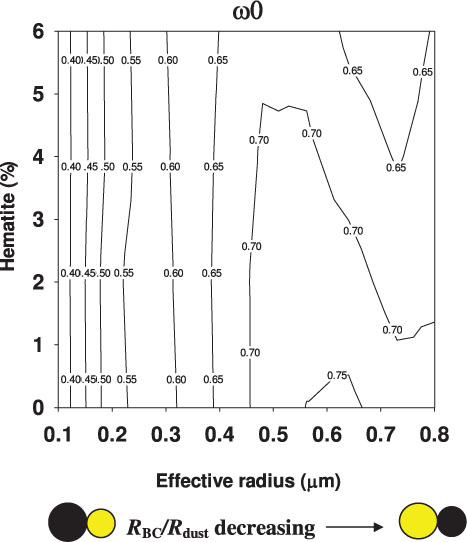
Figure 2 shows that the ω 0 of the two-sphere systems is nearly independent of hematite content for the effective size less than 0.4 µm, where R BC/R dust tends to 1.5 with decreasing size. The ω 0 was found to increase with increasing effective size in the above size domain. As the R BC/R dust decreases with increasing size (i.e. dust sphere size increases compared with BC sphere in the composite two-sphere system), hematite starts playing role compared to that of BC. The sensitivity of hematite content to ω 0 is significant when both of the spheres (i.e. mineral dust and BC) in the two-sphere system are nearly of same size. For two-sphere systems with effective size greater than 0.4 µm, the ω 0 reduces with increasing hematite. In general, ω 0 was found to increase with size with a maximum in size window ranging 0.55–0.65 µm for each hematite content; however, the maxima is somewhat skewed towards lower sizes for higher hematite content.
Figure 3 shows the variation of g for varying effective size of the composite particle with hematite varying from 0 to 6%. Like ω 0, g is also found to be independent of hematite content for the effective size less than 0.4 µm. g increases with size with a first maximum at 0.48 µm effective size; beyond that it reduces and attains a second maximum at 0.8 µm size for 6% hematite content. The second maximum is the general feature of particle optics, where g increases with size while the first maxima is due to optimised condition of particle effective size and absorbance. For the two-sphere system of 0.48 µm size, the BC sphere is bigger than dust sphere and leads to higher absorbance of the system. As the hematite content decreases, the second maximum starts diminishing. For the system size greater than 0.7 µm, the g was found to increase with increasing hematite content, whereas in the size window from 0.4 to 0.7 µm, the variation of g with hematite content is not significant.
Fig. 3.
The asymmetrical parameter, g, of the BC-mineral dust two-sphere system for the effective volume equivalent radius of the two-sphere system with the varying hematite percentage in the mineral dust.
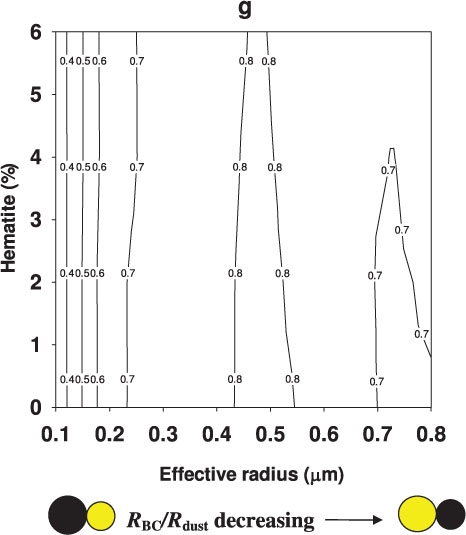
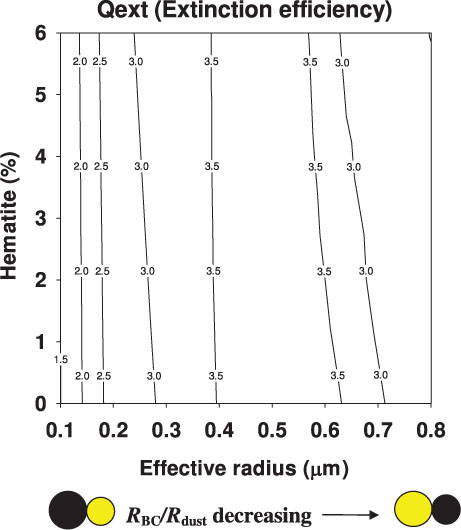
Figure 4 shows the variation of Q ext for varying effective size of the particle with hematite varying from 0 to 6%. The Q ext increases with size for each hematite content and attains a maxima at 0.5 µm effective particle size.
Fig. 4.
The extinction efficiency, Q ext, of the BC-mineral dust two-sphere system for the effective volume equivalent radius of the two-sphere system with the varying hematite percentage in the mineral dust.
4.1.2. Two-sphere (OC-dust and BrC-dust) and two-spheroid (OC-dust and BC-dust) particle systems (for system comprising same sized individual sphere/spheroid).
Figure 5 shows the ω 0 of the two-sphere and two-spheroid systems comprising OC, BrC, BC and mineral dust with hematite content of 0 and 6%. The computations are also performed for the hematite percentage 2 and 4, but are not shown in Fig. 5. The two-sphere OC-dust and BrC-dust systems for 0 and 6% hematite are represented as OCD-0, BrCD-0 and OCD-6, BrCD-6, respectively. The two-spheroid OC-dust and BC-dust systems for 0 and 6% hematite are represented as OCD′-0, BCD′-0 and OCD′-6, BCD′-6, respectively. The two-spheroid BrC-dust system could not be considered because of lack of observational support for the spheroidal morphology of BrC. For the comparison purpose, the optical properties of independent homogeneous spheres (of OC, BrC and BC) and pure dust spheroid (with 4% hematite content, D′-4) are also considered. The comparison will be helpful in determining the effect of particle non-sphericity (as the composite two-sphere and two-spheroid systems are non-spherical) and semi-external mixing of heterogeneous components on the optical properties. In general, the satellite retrieval algorithms account for the external mixtures of BC and dust homogeneous spheres.
Fig. 5.
The ω 0 of the two-sphere OC-dust, BrC-dust and two-spheroid OC-dust, BC-dust systems for the effective volume equivalent radius. The two-sphere OC-dust and BrC-dust systems are denoted as OCD and BrCD, respectively, while the two-spheroid systems OC-dust and BC-dust are denoted as OCD′ and BCD′, respectively. Each above-mentioned nomenclature is followed by the hematite percentage. The two-sphere/spheroid systems are compared with that of homogeneous spheres of organic carbon (OC), brown carbon (BrC), black carbon (BC) and dust with 4% hematite (D′-4).
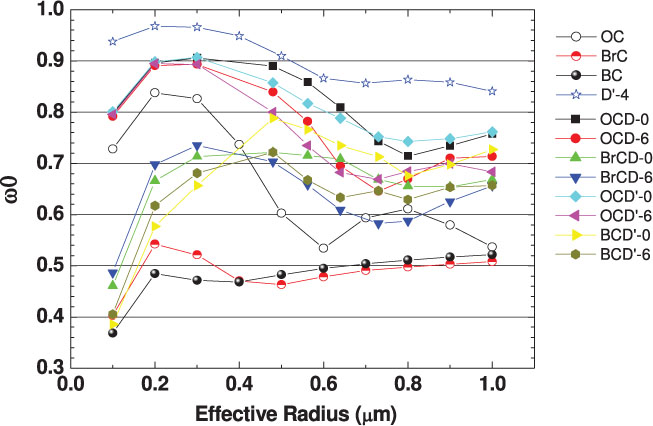
The ω 0 was found to vary depending on hematite content (0–6%) for any class of the system while different classes of system showed the variation due to their semi-externally mixed combinations as discussed earlier. For all hematite percentage, the OCD systems show the higher scattering compared to that of BrCD-6 system. The ω 0 of the pure dust spheroid with 4% hematite content (D′-4) showed the highest scattering compared to that of any particle system. ω 0 of all the particle systems is found in the range which is constrained by that of pure dust (D′-4), pure BC and pure BrC spheres. The BC and BrC spheres show nearly same scattering pattern for the effective radius >0.4 µm. Among all the systems, the ω 0 of the BrCD-6 system significantly differs from that of independent mineral dust, D′-4 (˜32% ω 0 variation) for effective particle radius of >0.5 µm while the same is true for BCD′-0 system for <0.3 µm. The BrCD-0 system shows the ω 0 pattern which could be generated by averaging the ω 0 of the D′-4 spheroid and BrC sphere for >0.3 µm effective radius. The ω 0 is found to vary by ~5% due to change in shape (from OCD to OCD′) while the same is found to vary by ~14% due to change in hematite content (from OCD-0 to OCD-6). This shows that the ω 0 is more sensitive to hematite content compared to that of particle shape. Contrary to OC spheres, BC and BrC spheres show nearly size independent ω 0.
Figure 6 shows the asymmetrical parameter, g, for the OCD, BrCD, OCD′ and BCD′ systems for the hematite content 0 and 6%. The g of OC, BrC, BC and D′-4 is considered for the reasons discussed earlier. The BrC independent sphere shows the highest g which tends to 0.9 with increasing size. The g of independent OC and D′-4 are more sensitive to the particle size compared to that of OCD, BrCD, OCD′ and BCD′ systems. In general, the g of the all the systems and independent spheres (except D′-4) are found to be in the range 0.6–0.9. For all the considered hematite range, the g of OC-dust systems (except OCD′-6) is found to be higher compared to that of independent OC and D′-4 for the effective size of <0.5 µm. This shows that in the above size regime the g value of semi-externally mixed OC-dust systems will be smaller if we consider an external mixture of OC and D′-4 in the aerosol optical model. The OCD′-6 spheroid system showed the maximum deviation in g (i.e. ~12%) compared to the OCD-6 sphere system while OCD′-0 system showed the maximum variation (13%) compared to that of OCD-0. This indicates that compared with ω 0, g is more sensitive towards the particle shape. Increase in hematite from 0 to 6% caused maximum deviation of ~14% in g for OCD and OCD′ system.
Fig. 6.
The asymmetrical parameter, g, for all the particle systems discussed in Fig. 5.
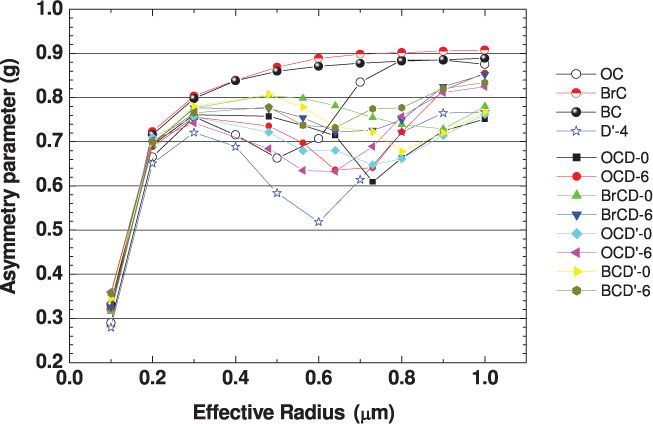
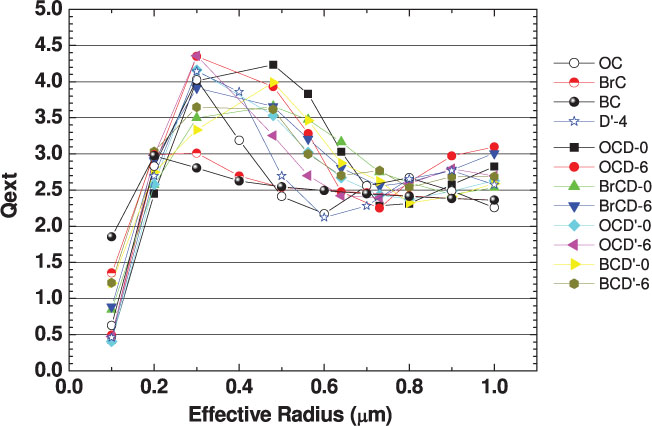
Figure 7 shows the extinction efficiency, Q ext, for the systems discussed in Figs. 5 and 6. No regular pattern of Q ext with effective size could be observed for the considered two-sphere and two-spheroid systems.
Fig. 7.
The extinction efficiency, Q ext, for all the particle systems discussed in Fig. 5.
In general, in aerosol community, there is a consensus on the choice of aspect ratio as 1.5 for estimating the optical properties of non-spherical dust particles. This has already been discussed in Section 2 in detail. We conducted a sensitivity study of aspect ratio and contact angle on BC and dust spheroid system (BCD′-4, 4% hematite) of an effective particle radius of 0.3 µm. With increasing contact angle from 30° to 90° between BC and dust spheroid, for fixed AR of 1.5, the Q ext was found to increase by 5%, ω 0 by 4%, but g was unchanged compared to those at 30° contact angle. For the same system, for a fixed contact angle of 30°, the increase in aspect ratio from 1.5 to 2.5 of individual spheroid led to an increase of 5 and 4% in Q ext and g, respectively, whereas ω 0 was found to decrease by 2% compared to the aspect ratio of 1.5.
4.2. Optics of three-sphere particle system
The optical properties of the three-sphere particle system comprising BC, OC, BrC, fly-ash (F) and dust (D) with hematite content 0–6% are modelled. The three spherical particles forming a system are considered of same size in this study.
Figure 8 shows the ω 0 of the three-sphere systems comprising OC, BrC, BC, fly-ash and dust with hematite content of 0 and 6%. The OC, dust and fly-ash systems are represented as OCDF-0 and OCDF-6 followed by hematite content. One OC sphere and two dust spheres in a system are represented as OCDD-0 and OCDD-6, while two OC spheres and one dust sphere in a system are represented as OCOCD-0 and OCOCD-6. One BrC and two dust spheres are denoted as BrCDD-0 and BrCDD-6; two BrC spheres and one dust sphere in a system are represented as BrCBrCD-0 and BrCBrCD-6. The system comprising three-sphere BrC is denoted as BrCBrCBrC. The systems comprising BC, dust and fly-ash are represented as BCDF-0 and BCDF-6 followed by their hematite content. One BC sphere and two dust spheres in a system are represented as BCDD-0 and BCDD-6, while two BC spheres and one dust sphere in a system are represented as BCBCD-0 and BCBCD-6. The system comprising three-BC spheres is denoted as BCBCBC.
Fig. 8.
The ω 0 of the three-sphere OC-dust-fly-ash, OC-dust, BrC-dust; three-sphere BrC, BC-dust-fly-ash, BC-dust and three-sphere BC systems for the effective volume equivalent radius. The OC-dust-fly-ash and OC-dust systems are denoted as OCDF, OCDD and OCOCD, respectively. The BrC-dust and BrC three-sphere systems are denoted as BrCBrCD, BrCDD and BrCBrCBrC, respectively. The BC-dust-fly-ash, BC-dust and BC three-sphere systems are denoted as BCDF, BCDD, BCBCD and BCBCBC, respectively. Each above-mentioned nomenclature is followed by the hematite percentage. The three-sphere systems are compared with that of homogeneous spheres of organic carbon (OC), brown carbon (BrC), black carbon (BC) and dust with 4% hematite (D′-4).
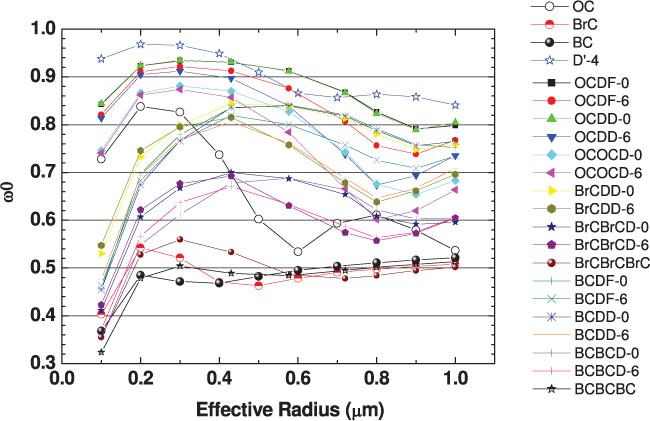
The ω 0 of above-discussed systems is found to vary depending on hematite content for every class of the system, while different system classes showed the variation due to their semi-externally mixed combinations as discussed earlier. The OCDF-0 system shows same scattering pattern as that of OCDD-0 system. The same scattering pattern of the above systems is due to the negligible difference between the refractive indices of fly-ash and dust with 0% hematite content. For 6% hematite content, the OCDF system shows higher scattering compared to that of OCDD system. The replacement of one dust sphere from OCDD system with one OC sphere reduces the scattering of newly formed OCOCD system for the considered hematite contents. The ω 0 of the OCOCD system is also found to be reduced with increasing hematite content. The sensitivity of ω 0 to hematite for all the OC-dust systems is found to be significant with increasing size. Except for the effective radius of 0.43–0.72 µm, the D′-4 spheroid shows the highest scattering compared to that of any particle systems shown in Fig. 8. Among the BrC-dust systems, the BrCDD systems show the higher scattering compared to that of BrCBrCD systems for fixed hematite content. The replacement of one dust sphere from BrCDD system with one BrC sphere reduces the scattering of newly formed BrCBrCD system for the considered hematite contents. The ω 0 has been found to be sensitive to the number of spheres in a system. This may be due to the fact that the surface structure of the system (as attached spheres) is larger than that of a single sphere of the same volume, which causes the variation in scattering efficiency (ω 0). The ω 0 becomes less sensitive to hematite with reducing number of dust spheres in a particle system.
Among the BC-dust systems, the BCDF-0 system shows the same scattering pattern as that of BCDD-0. The BCDF-6 system shows the higher scattering compared to that of BCDD-6 system. The replacement of one dust sphere from BCDD system with one BC sphere reduces the scattering of newly formed BCBCD system for the considered hematite contents.
Figure 9 shows the asymmetrical parameter, g, for all the particle systems shown in Fig. 8. The BrCBrCBrC systems together with BrC sphere show the highest g among the considered systems. The BCBCBC system together with BC sphere shows slightly lesser g values. First of all, we consider the g of OC-dust systems. For the effective radius of <0.6 µm, all the semi-externally mixed OCDF systems show greater g than that of OC and D′-4 while the reverse holds good for the size range of 0.73–0.90 µm. Thus neglecting the semi-external mixing and consideration of independent component spheres will lead to smaller g values for the effective radius of <0.6 µm and larger value for the radius range of 0.73–0.90 µm. The asymmetrical parameter of independent D′-4 spheroid is most sensitive to the particle size compared to that of OCDF, OCDD and OCOCD system.
Fig. 9.
The asymmetrical parameter, g, for all the particle systems discussed in Fig. 8.
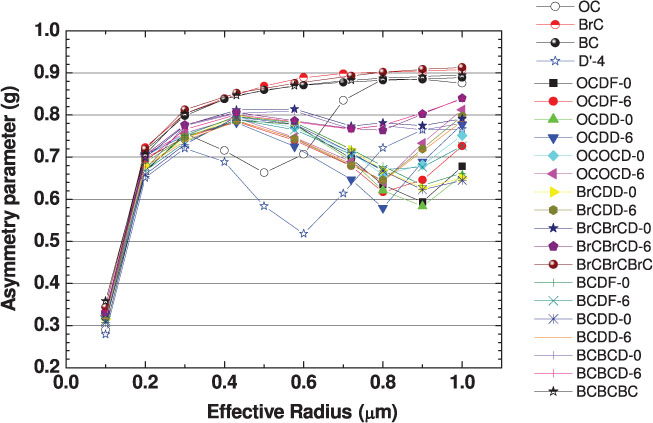
Among the BrC-dust systems, for the effective radius range of 0.72–0.90 µm, BrCDD systems show the lesser g values compared to that of BrC and D′-4. Thus neglecting the semi-external mixing of BrCDD systems and consideration of independent component spheroid will lead to larger g values for the effective radius range of 0.72–0.90 µm.
In case of BC-dust systems, for the effective radius range of 0.75–0.90 µm, the semi-externally mixed BCDF and BCDD systems show the lesser g values than that of BC and D′-4. This indicates that, for the effective radius range of 0.75–0.90 µm, the g values are larger if we replace the semi-external mixing state (presented here in the form of three-sphere systems) by external mixing of BC and D′-4.
Among all the systems shown in Fig. 9, the g for the BCDD-0 (or BCDF-0) shows the highest deviation of ~ 31% (compared to BC sphere), ~ 31% for BrCDD-0 system (compared to BrC sphere) and ~ 33% for OCDD-0 (or OCDF-0) system (compared to OC sphere).
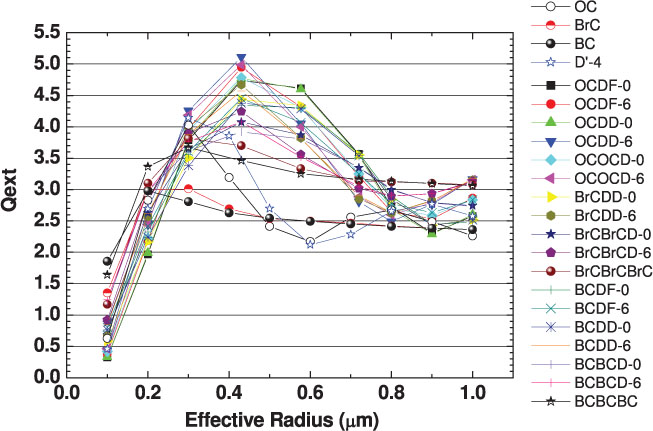
Figure 10 shows the extinction efficiency, Q ext, for the carbonaceous species and dust mixture model systems for which ω 0 and g are shown in Figs. 8 and 9, respectively. As has been observed in Section 4.1.2 for the two particle systems, no regular pattern of Q ext with effective size could be observed for the considered three-sphere particle systems.
Fig. 10.
The extinction efficiency, Q ext, for all the particle systems discussed in Fig. 8.
4.3. Size-averaged optical properties of polluted dust systems
The normalised number distribution for the 250 m leg on flight 13 for ACE-Asia (Clarke et al., 2004, Fig. 5c, measured size distribution represented with green-coloured square) is considered for calculation of size-averaged optical properties of all the dust systems. The distribution measured by Clarke et al. (2004) was for optical equivalent size (OES); however, the optical properties are calculated for individual particles characterised by volume equivalent size (r eff). Therefore, the distribution of Clarke et al. (2004) is converted for r eff using the experimental observations of Binnig et al. (2007) (which has provided a relationship between OES and r eff) for calculating size-averaged optical properties. The considered distribution is for the largest dust concentrations during ACE-Asia.
ω 0 and Q ext are functions of particle size, shape and refractive index, which depend on chemical composition. Table 4 shows size-averaged ω 0 and Q ext for homogeneous (comprising single chemical; for pure mineral dust we assume an effective chemical composition) and heterogeneous (comprising multiple chemical species such as pure mineral dust mixed with OC, BrC and BC) systems and the percentage deviation of the same with respect to D′-4 (pure dust spheroid with 4% hematite) and D′-6 (pure dust spheroid with 6% hematite). OC, BrC and BC are homogeneous spheres, while D′-4 and D′-6 are homogeneous spheroids. The variation in ω 0 and Q ext for the former is due to the variation in their chemical composition which changes the refractive index, whereas for the latter it is due to the variation in hematite content. The change in the optical properties of OCD-6 system compared to OCD-0 is due to the increase of hematite content. A similar explanation applies for the difference between BrCD-0 and BrCD-6 systems.
Table 4. The size-averaged optical properties of single-sphere, two-sphere, two-spheroid and three-sphere systems for 0 and 6% hematite and their percentage deviation compared to that of D′-4 and D′-6. The radius of individual sphere/spheroid is same for the considered dust systems
For the given hematite content, the change in optical properties of OCD system compared to that of BrCD is due to the change in the chemical composition. For a given hematite content, the change in optics of OCD (two-sphere system) compared to OCD′ (two-spheroid system) is due to the difference in system configuration. This is also true for the three-sphere systems as well.
From Table 4, we can also see that the ω 0 of the polluted dust system (with same sized individual sphere/spheroid in the system) is larger if the polluted dust is considered as D′-4 while smaller value is observed for Q ext.
The BCBCBC system shows strong departure in ω 0 compared to dust spheroid (for both 4 and 6% hematite) followed by BrCBrCBrC, BCBCD and BrCBrCD, while BCBCBC system shows strong departure in Q ext compared to dust spheroid (for both 4 and 6% hematite) followed by BCBCD and OCDD-6.
The monodisperse optical properties of the two-sphere BC and dust system (as already been discussed in Figs. 2–4) for the effective radius of 0.1–0.8 µm (corresponding to R BC/R Dust value from 1.5 to 0.9) are used for calculating the size-averaged optical properties. From Table 5, we can see the size-averaged optical properties of two-sphere system (with varying radii of individual spheres) together with their deviation (in percentage) to that of D′-4 and D′-6 spheroids. The percentage departure in ω 0 of BCD system (with varying BC and dust size) compared to dust spheroid weakens as the hematite content in dust reduces while departure in Q ext remains nearly same.
Table 5. The size-averaged optical properties of BC-dust two-sphere system (with varying radii of individual spheres) for hematite range of 0–6% and their percentage deviation compared to that of D′-4 and D′-6
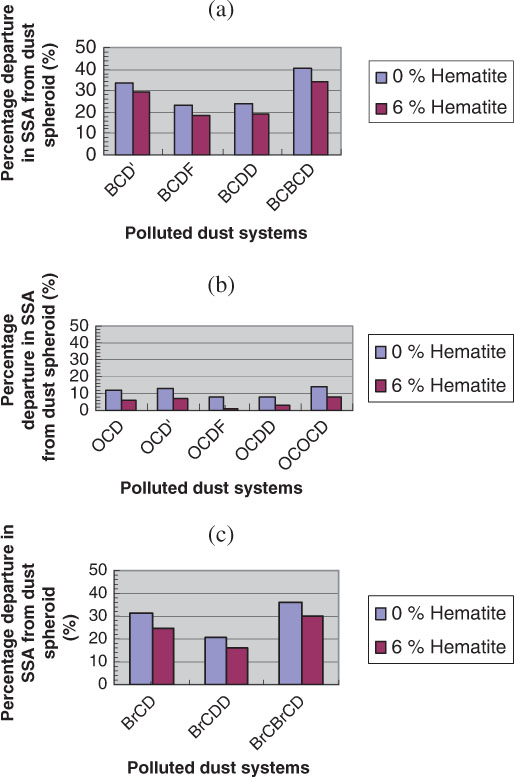
Figure 11 shows the departure in size-averaged ω 0 for the polluted dust systems from that of pure dust spheroids with 0 and 6% hematite. The percentage departure in ω 0 for the polluted dust from the pure dust spheroid D′-0 is found to be higher than that from D′-6. The BCBCD system showed the maximum departure (40 and 34% for polluted dust with 0 and 6% hematite, respectively) from the pure dust spheroid among all the considered dust systems. OCDD-0 and OCDF-0 show nearly the same departure. OCDF-6 system shows the minimum departure from the D′-6 among all the studied systems.
Fig. 11.
The absolute departure in size-averaged ω 0 for the polluted dust systems formed due to semi-external mixing of accumulation mode mineral dust with (a) BC (b) OC and (c) BrC have been shown compared to pure dust spheroid with 0 (D′-0) and 6% (D′-6) hematite.
5. Conclusions
The simulation of optical properties of non-spherical mineral dust aerosols is challenging because of the complex morphological and mineralogical properties of natural dust particles. This complexity further enhances when the dust mixes with the other species present in the atmosphere. It is very important to simulate the optical properties of complex mixing states even if the experimental proof of their existence is not available. In the sense of a sensitivity study the consideration of (more or less) any (reasonable) particle shape/composition would be beneficial to learn about the optical properties.
The simulated optical properties of thus polluted mineral dust, however, are required for a wide range of applications, for example, for the interpretation of remote-sensing and optical in situ measurements, for modelling the radiative properties of the atmosphere, for sensitivity studies of climate and finally for the estimates of climate impacts of dust aerosols. We model the optical properties of mineral dust having semi-external mixture with carbonaceous species. In the study, the ω 0 is found to vary depending on the hematite content (0–6%) for any class of the system, while different system classes show the variation due to their semi-externally mixed heterogeneous combinations. In general, the ω 0 of the pure dust spheroid with 4% hematite content (D′-4) is found to be highest compared to all the systems considered in the study throughout the considered size range. In view of effective absorbance of two-sphere BC-mineral dust systems, hematite starts playing the role compared to that of BC as the R BC/R dust decreases (i.e. with increase of dust sphere size compared with BC sphere in the composite two-sphere system). Compared with ω 0, g is more sensitive towards the particle shape. Increase in hematite from 0 to 6% caused a maximum deviation of ~14% in g for OCD and OCD′ system. The replacement of one dust sphere from OCDD (BrCDD) system with one OC (BrC) sphere reduces the scattering of newly formed OCOCD (BrCBrCD) system for the considered hematite contents. The maximum deviation in the size-averaged ω 0 for all the systems considered in Table 4 (compared to D′-4) is for BCBCBC followed by BrCBrCBrC and BCBCD, while the same in the size-averaged Q ext is for BCDD-6 followed by BCBCD-6 (BCBCBC, OCDD-6) and BrCDD-6.
The modelled polluted dust optics can be used for lidar applications. The Mueller matrix elements which are an intrinsic result of the DDA computations, will be additional information used for the remote-sensing applications. As the polluted dust optics has been modelled for visible wavelength (0.55 µm) at which most of the lidars operate. However, extension to further more wavelengths will help to provide the necessary input for radiative properties estimation. The modelled, size-averaged optical properties of the accumulation mode polluted mineral dust with hematite (0–6%) will be valuable input in the GCM to further reduce the uncertainty in the direct and indirect radiative forcing. To date no GCM accounts for the semi-external mixing for the radiative forcing estimation. The database of the optical properties (such as ω 0, g and Q ext) for the mono-disperse particles can be used for the quantified radiative forcing estimation corresponding to different types of composite particle accounting for particle non-sphericity and heterogeneity. The above database for the mono-disperse particle systems will be open to all for the above remote-sensing purposes and many sensitivity studies pertaining to particle optics.
Acknowledgement
This research is supported through grants from ISRO MT and GBP and DST ICRP programmes.