Fig. 1.
Typical 2-d air mass back-trajectories of three types of air masses at the Martinska station (Middle Adriatic, Croatia): (a) regional, (b) continental and (c) marine.
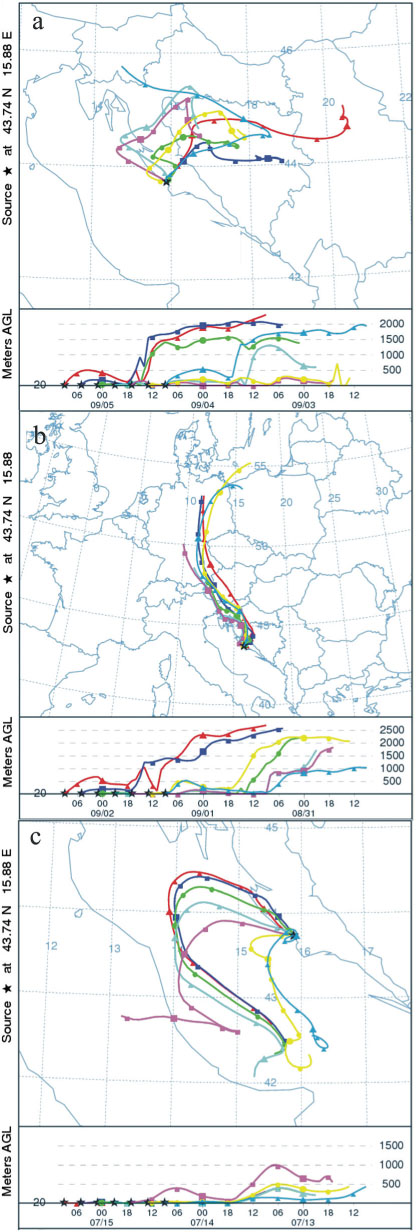
Table 1. Overview of the aerosol sampling and sample grouping according to the air-mass back-trajectory analysis using the NOAA HYSPLIT model.
Fig. 2.
AC voltammetric curves of 0.55 mol dm−3 NaCl and aerosol sample of K-puszta from 1 April 2010 obtained for different accumulation times by stirring at a potential of −0.6 V versus Ag/AgCl. Inset: adsorption isotherm of T-X-100 in 0.55 mol dm−3 NaCl obtained for 30 s of accumulation.
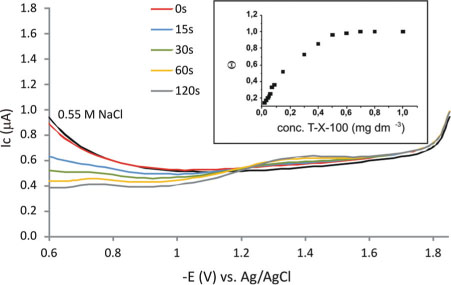
Fig. 3.
Concentrations of SASs in aqueous extracts of the aerosol samples from K-puszta, Zagreb and Middle Adriatic Martinska station influenced by marine, regional and continental air mass inputs. Concentrations of SASs are expressed in equivalents of T-X-100.
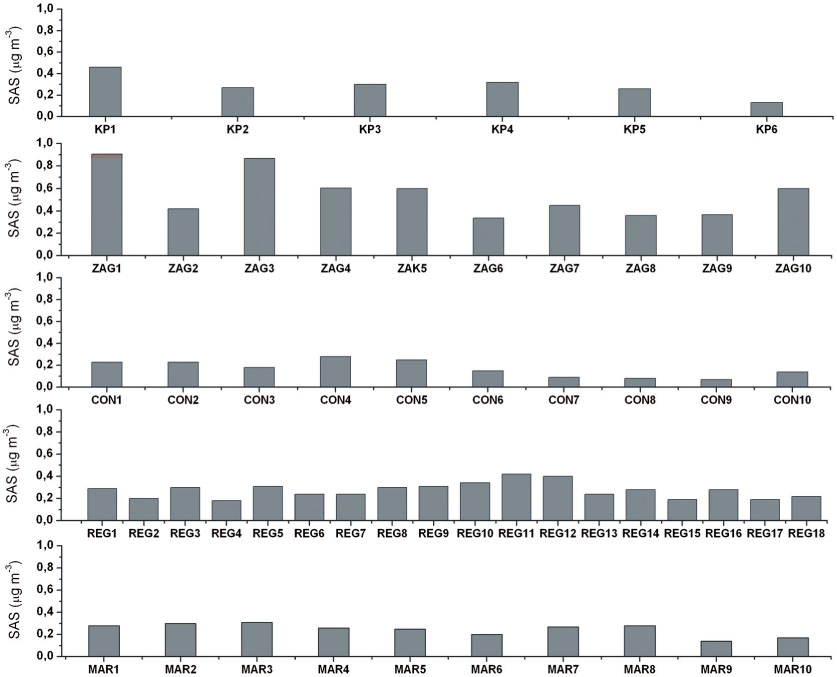
Fig. 4.
AC voltammetric curves of 0.55 mol dm−3 NaCl and selected aerosol samples from different locations. Accumulation time: 120 s.
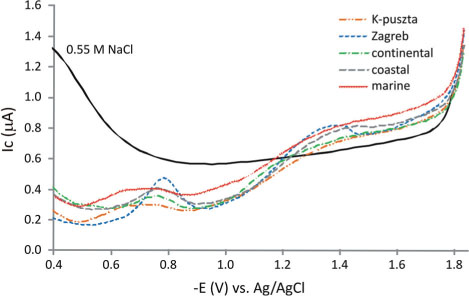
Fig. 5.
AC voltammetric curves of 0.55 mol dm−3 NaCl and water extracted HULIS material obtained for different accumulation times by stirring. The concentration of WSOC was 2.42 µgC dm−3.
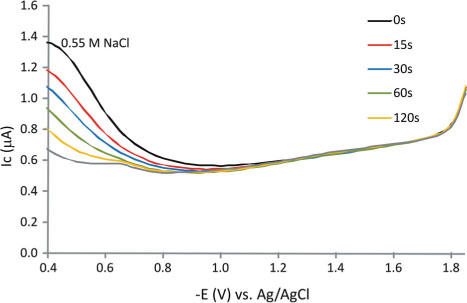
Fig. 6.
Distribution of WSOC concentrations of aerosols from K-puszta, Zagreb and Middle Adriatic Martinska station influenced by marine, regional and continental air mass inputs.
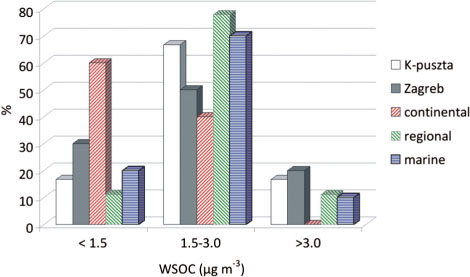
Fig. 7.
Correlation of SAS and WSOC concentrations of aerosol samples from different locations. The lines correspond to isolated HULIS material (in this work) and selected model substances as representatives for organic compounds as WSOC in atmospheric precipitations (Ćosović et al., 2007). Concentrations of SASs are expressed in equivalents of T-X-100.
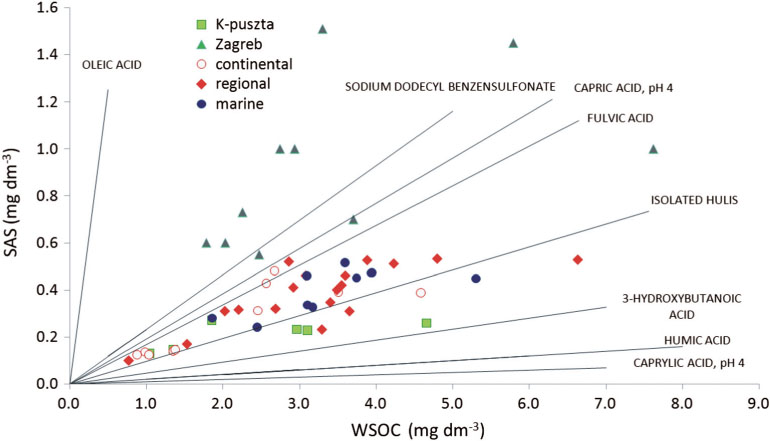
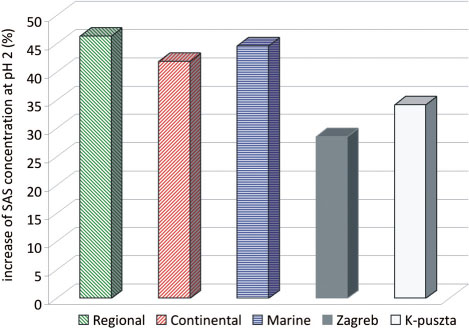
Fig. 8.
The average increase of SAS concentrations upon acidification (pH = 2) of aqueous extracts of the aerosol samples from K-puszta, Zagreb and Middle Adriatic Martinska station influenced by marine, regional and continental air mass inputs.