
1. Introduction
Water-soluble organic carbon (WSOC) constitutes a substantial portion (20–70%) of particulate organic matter in the atmosphere (Facchini et al., 1999; Zappoli et al., 1999; Decesari et al., 2000). Basically, two approaches have been used to characterise this fraction. Water-soluble organic compounds are often analysed by using an individual compound approach, mostly by gas chromatography–mass spectrometry (Facchini et al., 1999; Carvalho et al., 2003). In general, long lists of individual compounds (e.g. dicarboxylic acids, sugars, aliphatic alcohols) are reported, but these constituents altogether account only for few percent of the WSOC content (Facchini et al., 1999), and a substantial portion of polar oxygenated organic compounds remains unanalysed. Candidate water-soluble organic compounds were identified on the basis of their solubility, condensability and atmospheric occurrence. They include aliphatic and aromatic compounds with one or more polar, primarily oxygenated functional groups, for example dicarboxylic acids, oxo acids, hydroxy acids, dicarbonyls, carbohydrates, amino acids, aliphatic amines. However, the separation and identification of all these individual species failed due to the highly complex nature of WSOC. Another approach is the quantification of compound groups on the basis of their hydrophilicity or ionic properties. Although in this case the compound groups cannot be separated into individual constituents, their carbon content can account for up to 70% of WSOC (Decesari et al., 2000; Varga et al., 2001). One of the most important classes of water-soluble organic compounds has been called ‘humic-like substances’ (HULIS) since its physicochemical behaviour resembles that of natural humic matter (Havers et al., 1998; Zappoli et al., 1999; Decesari et al., 2000, 2006; Gelencser et al., 2000; Krivacsy et al., 2000; Fuzzi et al., 2001; Kiss et al., 2002).
Surface-active substances (SASs) play an important role in natural environmental systems since they accumulate at the air–water interface and are present in aerosols and atmospheric precipitations as well, influencing the surface tension of haze and cloud droplets (Shulman et al., 1996; Facchini et al., 1999; Nenes et al., 2002; Kiss et al., 2005). Depression of surface tension could affect cloud droplet formation and cloud properties such as albedo (Facchini et al., 1999), because surface tension considerably affects the Kelvin and also the Raoult term in the Köhler equation (Sorjamaa et al., 2004).
It was previously suggested that SASs can also result in substantial reduction of mass transfer through air/droplet interface (Shulman et al., 1996, 1997; Ervens et al., 2005). As a result, it is expected that such compounds, in general, could impact the critical supersaturation necessary to activate aerosol particles through formation of cloud condensation nuclei (CCN) and cloud microphysics (Capel et al., 1990; Shulman et al., 1996; Kanakidou et al., 2005; VanReken et al., 2005). In addition to climatic effects, surfactants influence the toxicity of aerosol particles at the air–water interface in the lungs (Paur et al., 2011). The determination of the surfactant content plays an important role in many analytical applications. The electrochemical methods offer a simple and sensitive way of SAS qualitative and quantitative characterisation based on the measurement of the electrode double-layer capacity changes at the mercury electrode surface. For the determination of SASs using alternating current (AC) voltammetry, the change of capacity current is measured at selected potential and calibrated by different model substances. Until now, electrochemical methods found a wide application in the study of SASs in natural waters (Ćosović and Vojvodić, 1998) and have been proven as an efficient tool for physicochemical characterisation of natural sea surface microlayer (Gašparović et al., 1998; Kozarac et al., 2003; Frka et al., 2009; Wurl et al., 2009). Recently, the electrochemical methods were successfully used for the investigation of SASs in bulk precipitations (Leko et al., 2004; Ćosović et al., 2007). In general, these methods are simple, rapid and non-destructive as no pre-treatment of the sample is necessary. In this study, AC voltammetry is applied for the first time for the quantitative and qualitative characterisation of the surfactants present in atmospheric aerosol samples.
2. Adsorption of SAS at the mercury electrode–solution interface
Surface active substances have the capability of spontaneous adsorption at different phase boundaries because of their amphiphilic nature. Due to its non-polar and hydrophobic character, the mercury electrode surface–electrolyte solution interface may serve as a good model interface for the adsorption study and determination of the organic SASs that are adsorbed primarily because of hydrophobic expulsion. The adsorption of surfactant molecules at the electrode interface causes changes in the dielectric properties and the thickness of the double-layer capacitance due to replacing the counterions and small water molecules on the electrode surface. As a result, at the potential where the organic compound is maximally adsorbed (−0.6 V versus Ag/AgCl), the capacity current (IC) is lower than the capacity current in a solution of the supporting electrolyte alone (IC0). AC voltammetry is a phase sensitive method, where the out-of-phase mode (phase angle is 90°) enables the determination of the capacity current as the electrochemical response to the applied potential directly related to the double-layer capacitance. The IC value measured by AC voltammetry depends on the adsorbate concentration in the solution, thus adsorption study at the electrode–solution interface may allow quantification of SASs in natural water samples (Ćosović and Vojvodić, 1982) by measuring the extent of adsorption.
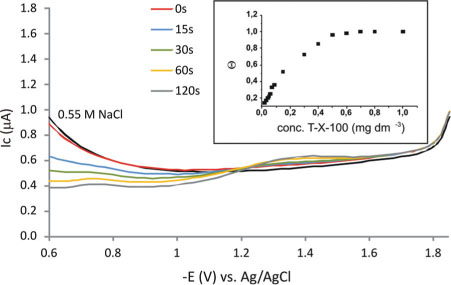
In this study, for quantification of the content of SASs, a calibration plot of a selected standard compound tetra-octylphenolethoxylate (T-X-100) is used as adsorption isotherm at selected accumulation time. The adsorption isotherm is constructed as ΔIC versus concentration plot of T-X-100 in mg dm−3, where ΔIC is a decrease of capacity current at the potential of −0.6 V with respect to the capacity current of the pure electrolyte for accumulation time of 30 s by stirring (insert in Fig. 2). To extend the concentration range, one can use different time periods for accumulation or change the conditions of mass transport of surfactant molecules towards the electrode surface such as, for example, using diffusion controlled process or enhancing transport by stirring the solution. Thus, the concentration of SASs in different samples is expressed as the equivalent amount of model T-X-100. Non-ionic surfactant T-X-100 proved to be a very good model substance used for the study of surfactants in the environmental samples for a number of reasons: stability, commercial availability and adsorption in the potential range similar to that of natural SASs. Thereby, T-X-100 is traditionally accepted as the model substance in a wide range of investigations dealing with surface-active properties measured by electrochemical methods (Ćosović and Vojvodić, 1982, 1998; Kozarac et al., 1986; Leko et al., 2004; Frka et al., 2009; Wurl et al., 2009). On the other hand, there is still no perfect choice of model substance for the atmospheric samples. Although Suwannee River fulvic acid is sometimes used as a standard for atmospheric HULIS, its behaviour as a surfactant differs significantly from that of atmospheric HULIS (Kiss et al., 2005).
Fig. 1.
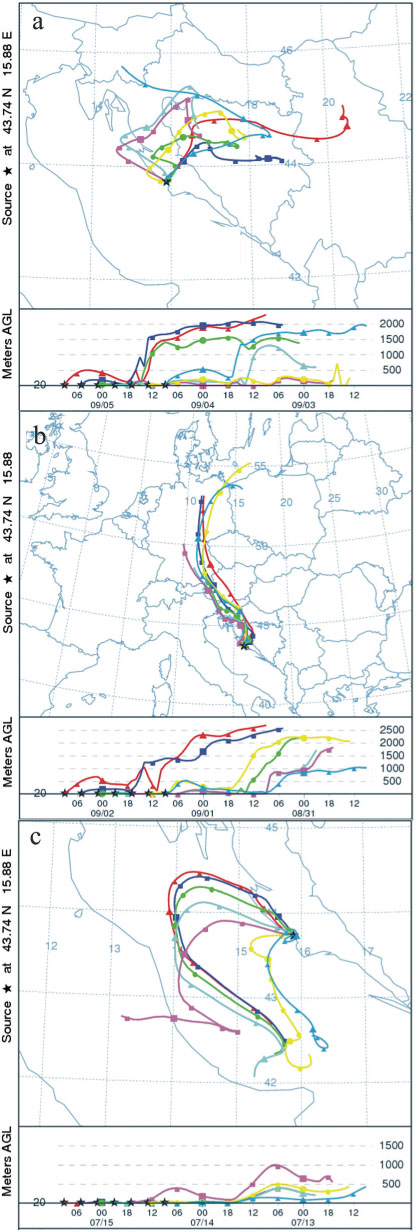
Typical 2-d air mass back-trajectories of three types of air masses at the Martinska station (Middle Adriatic, Croatia): (a) regional, (b) continental and (c) marine.
3. Experimental
3.1. Aerosol sampling
Aerosol samples of PM2.5 were collected for 23 h (from 9:00 a.m. until 8:00 a.m. next day) on Whatman quartz fibre filters using a high-volume sampler (Kálmán Systems, KS-303) with a flow rate of 32 m3 h−1. The flow rate of the sampler is automatically regulated by changing the speed of the pump by frequency control based on the measurement of barometric pressure, temperature and differential pressure measured by a venturi meter. The accuracy of the volume flow measurement is ±2%. Before exposure, the filters were pre-combusted at 650 °C for 5 h and after the sampling these were carefully packed in aluminium foils (pre-heated at 450 °C, 5 h) and stored in a freezer until the analysis. Blank filters were prepared in the same way as filters for sampling but without exposure to air.
Samplings were performed at Middle Adriatic coastal station Martinska (Croatia), city of Zagreb (Croatia) and rural station K-puszta (Hungary). Martinska station (43°44′N, 15°53′E; 10 m above the sea level) is situated in the wider part of the Krka river estuary in front of Šibenik (a town with about 51 000 inhabitants) situated at the Adriatic coast. The climate is Mediterranean, with warm summer and mild winter periods. The whole region is characterised with extensive tourism and mariculture with a low impact of industrial activities. Air temperatures ranged from 12 to 36 °C (mean 25.38±3.38 °C, n=38) during the sampling period while average relative humidity was 46.13±8.47%. Another sampling location was the city of Zagreb, particularly the location of the Ruder Bošković Institute (45°50′N, 15°59′E; 158 m above the sea level). Zagreb is the capital of Croatia, with approximately one million inhabitants, characterised by the continental climate and precipitation distributed more or less uniformly all over the year. Heavy traffic is the main source of organic pollutants in spring and summer, while a substantial amount of autumn and winter pollutants besides traffic came from heating (Šišović et al., 2002). Air temperatures ranged from 6.5 to 24.2 °C (mean 14.85±5.67 °C) during the sampling period, while relative humidity ranged from 23 to 98% (mean 71.45±30.93%). Aerosol samples were also collected on a forest clearing at K-puszta on the Great Hungarian Plain (46°58′N, 19°33′E; 136 m above the sea level, about 80 km SE of Budapest), an established European Monitoring and Evaluation Program and Global Atmospheric Watch station, a representative of the rural situation in Central Europe. Air temperatures ranged from 1 to 22 °C (mean 12.92±7.05 °C) during the sampling period, while the average relative humidity was 77.50±9.52%.
Daily aerosol samples have been collected continuously during the campaigns at the Martinska station, K-puszta site and in Zagreb city (Table 1). Only the aerosol samples from Martinska and K-puszta stations were grouped according to the air-mass back-trajectory analyses (using the NOAA HYSPLIT model), as the traffic and other anthropogenic combustion sources are dominant local sources of all air pollution compounds in urban air of Zagreb. Based on the air-mass trajectory analysis, the samples collected at the Martinska station during both campaigns were divided into three groups: marine, continental (air masses from Central Europe) and regional (air masses mostly from Middle Adriatic coastal background area or nearby local area of Croatia and Bosnia and Herzegovina). Fig. 1 gives example trajectories for each type of air masses. Based on air-mass back-trajectory analysis six samples from K-puszta were chosen to be representative of the particular rural site during the sampling period. HULIS material was isolated from two K-puszta samples collected during summer 2008, which were considered as rural influenced by air masses from a long-range transport over the continent.
Table 1. Overview of the aerosol sampling and sample grouping according to the air-mass back-trajectory analysis using the NOAA HYSPLIT model.
3.2. Sample pre-treatment
The water-soluble aerosol fraction was extracted by placing half of the filters (A=66 cm2) in 0.13–0.2 dm−3 of high purity deionised water from a MilliQ system (Millipore Corp.) for 24 h. The extracts were then filtered through 0.7 µm Whatman GF/F filters pre-combusted at 450 °C for 5 h and directly used for electrochemical measurements and WSOC analysis. The samples of the filtered extracts for WSOC analysis were preserved by adding 100 µL of 2 g dm−3 HgCl2.
Humic-like substances was isolated with the one-step procedure described by Varga et al. (2001) from two filters collected at K-puszta station. The pH of the aqueous extract was adjusted to 2 with HCl, and the separation of HULIS from other dissolved components was performed on an Oasis HLB (1 g) column (WATERS) activated with methanol and conditioned with 0.01 M HCl prior to the application of the samples. The HULIS fraction was then eluted with methanol and dried at room temperature. Prior to the analysis, HULIS was re-dissolved in 0.05 dm−3 of MilliQ water.
3.3. Sample analysis
Electrochemical measurements were performed with an electrochemical analyser µAutolab-type II (Eco Chemie B.V., The Netherlands) equipped with GPES 4.6 software (Eco Chemie B.V., The Netherlands). A standard polarographic Metrohm cell of 50 cm3 equipped with a three-electrode system was used. A hanging mercury drop electrode (HMDE, Metrohm, Switzerland) with the surface area A=0.01245 cm2 was used as a working electrode, Ag/AgCl/3 mol dm−3 KCl as the reference electrode and a platinum coil as the auxiliary electrode. A saturated solution of NaCl was added to the water-soluble aerosol sample to adjust 0.55 mol dm−3 electrolyte solution prior to the measurement. Sodium chloride (Kemika, Croatia) was heated at 450 °C for 5 h and purified with charcoal to remove any organic impurity. Phase sensitive AC voltammetry (out-of-phase signal, frequency 77 Hz, amplitude 10 mV) was used for the quantification of SASs in water-soluble fraction of the aerosol samples. Concentration of SASs is expressed as the equivalent amount of the selected standard of tetra-octylphenolethoxylate (T-X-100 in mg dm−3). Sample measurements were performed under the same experimental conditions used for the standard substance. The detection limit of SAS determination is 0.02 mg dm−3 equivalent of T-X-100. The relative standard deviation obtained for multiple analyses of the same solution containing SASs at the level of 0.1 mg dm−3 is less than 5%. SAS concentrations in blank filters used during the campaigns were always below the detection limit of 0.02 mg dm−3.
A sensitive high-temperature catalytic oxidation analyser TOC-VCPH (Shimadzu, Japan) with platinum-coated silica catalyst and a non-dispersive infrared detector for CO2 measurements was used for WSOC measurements. The sample was acidified with 2 M HCl to pH 2–3 in order to eliminate the inorganic carbonates. The concentration of each sample was calculated as an average of three to five replicates. The average MilliQ blank was found to be 0.03 mg dm−3 (n=33) with high reproducibility (1.6%).
Normalised SAS concentration (SAS/WSOC) values were calculated by dividing the concentration of SASs in mg dm−3 as the equivalent amount of T-X-100 with the obtained WSOC content in mg dm−3 for a particular aerosol sample.
The pH was measured by standard electrode method with a digital Metrohm 691 pH-meter (Metrohm Ltd, Herisau, Switzerland).
4. Results and discussion
4.1. Determination of the concentration of surface-active material in atmospheric aerosol samples
Herein we recommend a novel analytical approach (out-of-phase AC voltammetry) for the direct quantitative and qualitative characterisation of the surface-active material in the atmospheric aerosol. For the illustration of the method, a typical capacity current versus potential curves obtained for one aerosol sample from K-puszta station are shown in Fig. 2. Surfactants were accumulated at the electrode surface at the initial potential of −0.6 V, by stirring for 15, 30, 60 and 120 s before application of the potential scan. As the accumulation time is increasing the adsorption of SASs is also increasing, resulting in progress of lowering the IC values. Namely, at the potential of −0.6 V the hydrophobic surfactants are strongly adsorbed and the difference of capacity current value with respect to the baseline of pure 0.55 mol dm−3 NaCl as an electrolyte (ΔIC) was measured as a result of the adsorption, as described in detail in Section 2. The quantity of SASs present in the sample is determined from the calibration curve of the selected standard tetra-octylphenolethoxylate T-X-100. AC voltammetry (out-of-phase mode) enabled determination of SAS concentrations from 0.02 mg dm−3 and construction of the calibration curves of the T-X-100 in the concentration range from 0.02 to 1 mg dm−3 for different accumulation times. In Fig. 2 (inset), a T-X-100 calibration curve is shown, which was obtained for the accumulation of 30 s and was used in this work for expressing the content of SASs in mg dm−3 as the equivalent amount of T-X-100 in the aerosol samples. Usually, the SAS content of aqueous environmental samples (sea water, rainwater, rivers and lakes) is expressed in mg dm−3 as the equivalent amount of T-X-100. As we applied AC voltammetry for quantification of SASs in daily collected aerosol samples, it seemed rational to express the obtained SAS concentrations in µg m−3 of T-X-100 equivalents, taking into account the total volume of air from which the aerosol was collected. However, it should be pointed out that the obtained SAS concentrations are not absolute values but concentrations that should always be referred to the model compound calibration and therefore cannot be used to calculate the mass fraction of SASs in the aerosol mass.
Fig. 2.
AC voltammetric curves of 0.55 mol dm−3 NaCl and aerosol sample of K-puszta from 1 April 2010 obtained for different accumulation times by stirring at a potential of −0.6 V versus Ag/AgCl. Inset: adsorption isotherm of T-X-100 in 0.55 mol dm−3 NaCl obtained for 30 s of accumulation.
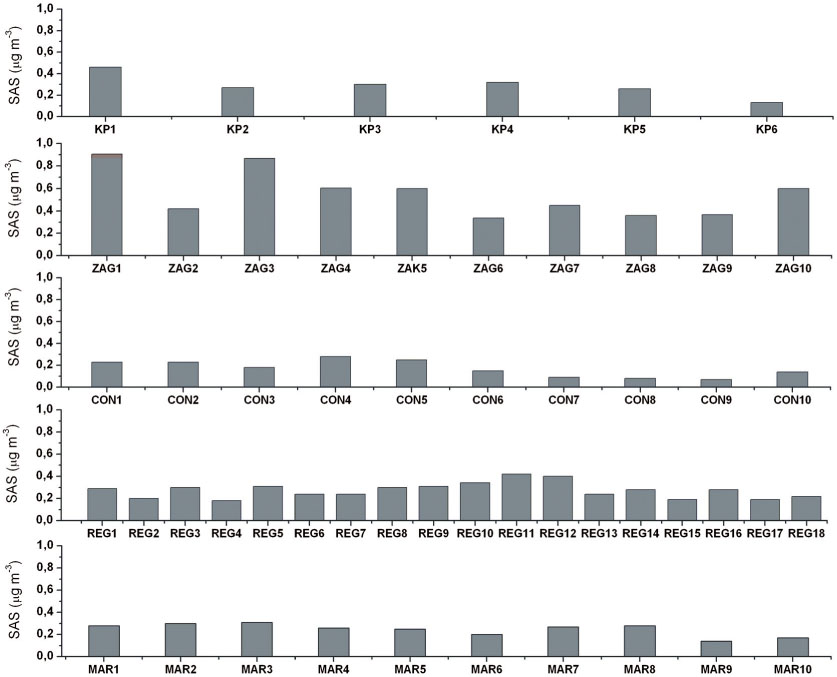
Thus, the aerosol samples collected in different seasons from different sampling sites were analysed for SASs, and the results are shown in Fig. 3. The highest SAS concentrations ranging from 0.34 to 0.91 µg m−3 (mean 0.55±0.21 µg m−3, n=10) were detected in urban samples. The SAS concentrations of marine, regional and continental aerosol samples from Martinska were more uniform and ranged from 0.14 to 0.31 µg m−3 (mean 0.25±0.06 µg m−3, n=10), 0.18 to 0.42 µg m−3 (mean 0.27±0.07 µg m−3, n=18) and 0.07 to 0.28 µg m−3 (mean 0.17±0.075 µg m−3,n=10), respectively. The SAS concentrations in the K-puszta aerosols ranged from 0.13 to 0.46 µg m−3 (mean 0.29±0.11 µg m−3, n=6). The elevated T-X-100 equivalent SAS concentrations in Zagreb can be explained either by a higher concentration of SASs itself or merely by the fact that they are stronger surfactants as a consequence of their different chemical properties. Namely, even small amounts of highly surface-active compounds like long-chain saturated and unsaturated fatty acids and non-ionic or anionic surfactants could make significant contribution to the surface-active character of the complex mixture of WSOC in atmospheric aerosols. The reason for this difference in chemical properties will be discussed in Section 4.2.
Fig. 3.
Concentrations of SASs in aqueous extracts of the aerosol samples from K-puszta, Zagreb and Middle Adriatic Martinska station influenced by marine, regional and continental air mass inputs. Concentrations of SASs are expressed in equivalents of T-X-100.
The main advantage of the electrochemical method of phase sensitive AC voltammetry is the direct application to the aqueous aerosol extract without the requirements of any further sample preparation in comparison to the methods that have been thus far commonly used in the surfactant analysis of aerosols. Those methods implicate sample pre-treatment with the purpose of the surfactant isolation by chloroform extraction steps. They are based on the formation of a chloroform extractable ion-association complex between the anionic or cationic surfactants and cationic (disulfine blue) or anionic (methylene blue) dyes, followed by spectrophotometric measurement of the intensity of the extracted coloured complex as applied by Chitikela et al. (1995), Oppo et al. (1999), Latif and Brimblecombe (2004) and Roslan et al. (2010).
Another advantage of the applied electrochemical method is its sensitivity. In numerous studies, the decrease in surface tension due to surface-active organic compounds has been considered (Shulman et al., 1996; Li et al., 1998; Facchini et al., 1999). In the past few years, the surface tension of cloud water (Hitzenberger et al., 2002; Decesari et al., 2005), fog water and aerosol extract (Capel et al., 1990; Facchini et al., 2000; Decesari et al., 2005; Kiss et al., 2005) as well as that of the solution of individual organic compounds (Shulman et al., 1996; Ervens et al., 2004; Tuckermann and Cammenga, 2004; Varga et al., 2007) and mixtures of organic and inorganic compounds (Frosch et al., 2011) were studied, leading to a basic knowledge on their surface-tension effect. In these studies, surface tension was measured with interfacial tensiometers or drop shape analysers. However, these instruments are orders of magnitude less sensitive than AC voltammetry. Tensiometers and drop shape analysers can be used for the investigation of polluted fog samples or the aqueous extract of aerosol samples collected at a polluted site and/or for several days, but the detection of surfactants in cloud water and rainwater or in the aqueous extract of size-segregated aerosol samples is not possible with these instruments (Facchini et al., 2000; Decesari et al., 2005). Such samples have to be concentrated under vacuum at elevated temperature in order to reach a concentration level where the deviation from the surface tension of pure water can be measured (Decesari et al., 2005). The high sensitivity of AC voltammetry enables the simple quantification of SASs in cloud water, rainwater and daily aerosol samples without necessity for sample concentration, thus saving time and avoiding the risk to change the composition of the sample. Further advantage of this method is that the results from different locations can be compared. This is not the case with tensiometry, where the surface tension values cannot be calculated for dry aerosol. Therefore, the results from different studies cannot be linked because the surface tension values of the aqueous extract depend on the sampling conditions and sample preparation (air volume sampled, filter area extracted, amount of water used, etc.) This problem can be eliminated with the electrochemical method since the comparison of different samples can be executed by using an arbitrary standard (e.g. T-X-100).
4.2. Characterisation of surfactants in the aqueous extracts of aerosol samples
Adsorption study at the electrode–solution interface may allow quantification of SASs on relative scale by measuring the extent of adsorption, while a molecular characterisation of naturally occurring organic substances is possible by analysing the shapes of the voltammetric curves of the samples and comparing them with the selected model substances. Namely, at the potential of around −0.6 V, decrease of IC in comparison to IC of pure electrolyte indicates SAS adsorption. When there is no further decrease of IC with SAS accumulation, the total adsorption occurs when the electrode surface is completely covered with the SAS material. By scanning the electrode to more negative potentials, the charge of the electrode surface becomes favourable for displacement of SASs with water molecules since the SASs do not have enough adsorption energy gain to remain on the mercury surface. In voltammograms, the SAS desorption could be followed through the increase of IC values until those of the pure electrolyte at more negative potentials. Furthermore, the voltammograms of different compounds could be characterised by the presence of characteristic peaks usually representing the reorientation of the adsorbed surfactant material at the electrode surface due to the change of the electrode surface affinity in relation to the applied potential. Thus, the overall shape of the IC-E voltammogram is characteristic of the specific adsorption behaviour of the surfactant compound at the mercury electrode surface due to its structure and hydrophobicity. Some typical voltammetric curves obtained for different aerosol samples are shown in Fig. 4. The curves presented were obtained after accumulation of SASs for 120 s when the electrode surface was completely covered with SAS material (θ≈1) and no further decrease in capacity current occurred with increasing accumulation time.
Fig. 4.
AC voltammetric curves of 0.55 mol dm−3 NaCl and selected aerosol samples from different locations. Accumulation time: 120 s.
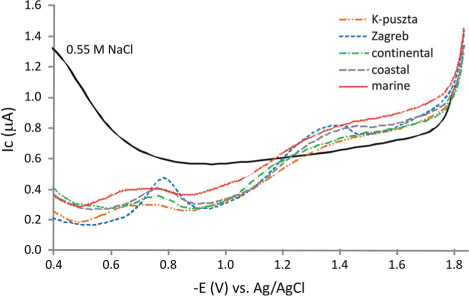
For most of the aerosol samples investigated, the characteristic broader peak in the potential range from −0.65 to −0.85 V was present. We can assume that this peak reflects the presence and effects of a specific surface-active material characteristic for all investigated aerosol samples. Namely, the occurrence of the characteristic reorientation peak indicates the presence of the SA material, which possessed similar adsorption behaviour despite the fact that it is obtained for different aerosol samples. However, the shape and the position of the peak maximum was not identical, indicating the slight difference in the chemical composition of the SASs present in different samples. In a study of model humic acid (Sigma-Aldrich), Ćosović et al. (2007) found a similar desorption peak around −0.75 V. Furthermore, a characteristic small peak around −0.8 V was also observed previously at higher electrode coverage in the rainwater samples from Zagreb and Šibenik (Middle Adriatic), indicating the presence of atmospheric humic-like material in the rainwater (Ćosović et al., 2007). The appearance of compounds of similar adsorption behaviour in the aerosol extracts and rainwater samples can be explained by the fact that water can extract surfactants from the aerosol particles acting as CCN.
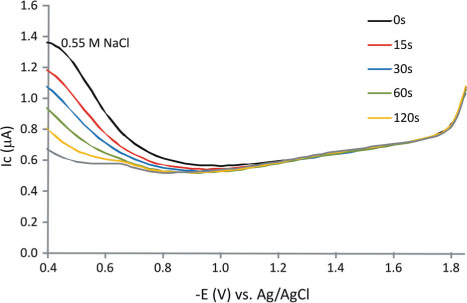
In addition to the aqueous aerosol extracts, adsorption behaviour of isolated HULIS was also investigated by AC voltammetry. The voltammograms of HULIS are shown in Fig. 5. The adsorption of HULIS at the electrode surface proportionally increased with the accumulation time, confirming that HULIS material exhibits significant surfactant nature previously observed by several authors through the reduction of the surface tension of aqueous atmospheric samples (Facchini et al., 2000; Decesari et al., 2001; Kiss et al., 2005; Salma et al., 2006; Taraniuk et al., 2007; Wex et al., 2007). The appearance of the characteristic peak at the potential of approximately −0.65 V was clearly seen when the electrode surface was completely covered with adsorbable HULIS material (i.e. for 120 s of accumulation). This is in accordance with the finding that HULIS are significant surface-active constituents of the water-soluble organic fraction of the atmospheric aerosol (Kiss et al., 2005).
Fig. 5.
AC voltammetric curves of 0.55 mol dm−3 NaCl and water extracted HULIS material obtained for different accumulation times by stirring. The concentration of WSOC was 2.42 µgC dm−3.
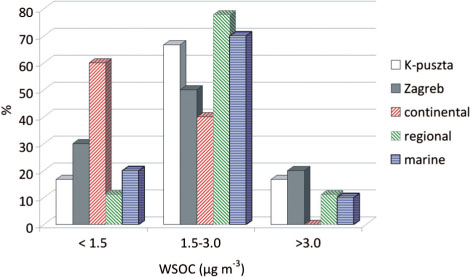
The concentrations of WSOC ranged from 0.91 to 3.65 µg Cm−3 (mean 2.28±0.99 µg Cm−3), 1.09 to 4.6 µg Cm−3 (mean 2.09±1.11 µg Cm−3), 0.52 to 2.66 µg Cm−3 (mean 1.39±0.69 µg Cm−3), 1.21 to 3.84 µg Cm−3 (mean 2.37±0.72 µg Cm−3) and 1.11 to 3.08 µg Cm−3 (mean 2.099±0.56 µg Cm−3) in aerosols from Zagreb, K-puszta, continental, regional and marine samples from Middle Adriatic site, respectively. The frequency distribution of WSOC in different aerosol samples is shown in Fig. 6. The lower WSOC values (<1.5 µg Cm−3) were the most frequently determined in samples from Martinska influenced with continental air masses. Distribution of WSOC was more uniform for the rest of the samples from Martinska (regional and marine), Zagreb and K-puszta containing most of the values between 1.5 and 3.0 µg Cm−3 of WSOC. In general, the average WSOC concentrations detected in this study were in the same range as those previously found during the late spring-early autumn period in other areas such as Aspvreten, Central Sweden; K-puszta, Hungary; San Pietro Capofiume, Po Valley, Italy; Paris, France; St. Louis, USA, and urban sites in valleys of the French Alps (Zappoli et al., 1999; Ruellan and Cachier, 2001; Kiss et al., 2002; Sullivan et al., 2004; Jaffrezo et al., 2005).
Fig. 6.
Distribution of WSOC concentrations of aerosols from K-puszta, Zagreb and Middle Adriatic Martinska station influenced by marine, regional and continental air mass inputs.
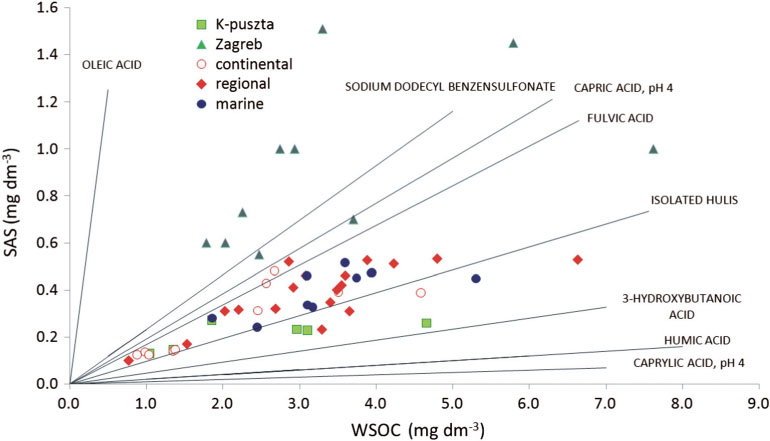
The exact chemical nature of candidate surface-active components in atmospheric aerosol is still not clear. Several studies showed that surface-active components of both marine and continental aerosols are dominated by aliphatic hydrocarbons and their amphiphilic derivatives (Peterson and Tyler, 2002). This was supported by the study of Gilman et al. (2004), which indicated that the carbon length of amphiphilic compound is the most important factor in determining its interfacial stability and longevity. In Fig. 7, we compared aerosol samples with isolated HULIS and selected model substances as representatives for organic compounds of WSOC in atmospheric precipitations (Leko et al., 2004). It should be noted that the linear slope in the whole concentration range is only a rough approximation. Despite the fact that the samples were collected at different seasons, for the aerosol samples collected at the Martinska and K-puszta stations the normalised SAS concentrations fall between the lines of capric acid (C10) at pH = 4 and 3-hydroxybutanoic acid. The best agreement of all aerosol samples (63%, n=54) investigated in this work was found with fulvic acid and atmospheric HULIS isolated from aerosol samples collected at K-puszta pointing to the similar hydrophilic/hydrophobic nature of surface-active material present. Only 13% of all investigated samples (n=54) had higher SAS/WSOC ratios shifted to the more hydrophobic compounds such as fatty acids. All those samples were collected in the urban area of Zagreb. This difference can be explained by the joint effect of different sources and photochemical activity. In an urban environment like Zagreb, predominantly non-polar organic compounds are emitted into the atmosphere from traffic and some other industrial sources (Baek et al., 1991, 1992; Rogge et al., 1993). These compounds participate in photochemical reactions and consequently they are transformed into compounds bearing polar functional groups. These compounds having both polar and non-polar parts can act as SASs. Near urban sources the aerosol constituents are more hydrophobic and consequently show stronger surfactant nature.
Fig. 7.
Correlation of SAS and WSOC concentrations of aerosol samples from different locations. The lines correspond to isolated HULIS material (in this work) and selected model substances as representatives for organic compounds as WSOC in atmospheric precipitations (Ćosović et al., 2007). Concentrations of SASs are expressed in equivalents of T-X-100.
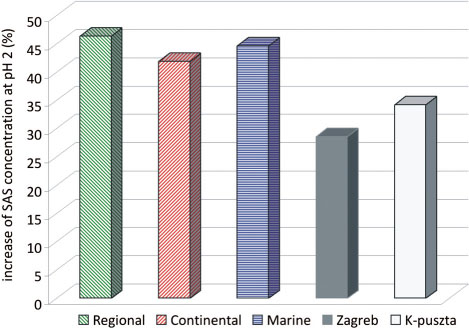
To get more insight into the chemical nature of SASs in the investigated samples, their T-X-100 equivalent concentrations at two different pH values were determined. It is known that the adsorption of SASs at the mercury electrode surface is influenced by pH. The influence of pH on the adsorption behaviour of SASs at the mercury electrode surface was observed in the case of fulvic acid, while there was no effect of pH on the adsorption of hydrophobic and neutral T-X-100 (Vojvodić et al., 1994). The increase in equivalent concentration of SASs with a decrease in pH reflects the gradual protonation of acidic sites. In very acidic solution (pH = 1 − 2), the anionic (and therefore very hydrophilic) surface-active material becomes hydrophobic and therefore more adsorbable. Thus, the SAS concentration determined by the electrochemical method is dependent on the pH of the solution, which is, in the case of this study, influenced by the chemical nature of the aerosol organics dissolved in MilliQ water. Therefore, our intention was to get insight into the original variations among aqueous aerosol extracts by avoiding buffering the sample solutions. All investigated aerosol extracts were originally slightly acidic, that is their ‘original’ pH values were in the range from 4.98 to 6.25 (mean 5.25±0.22, n=54), with no statistically significant differences among the samples influenced by different air masses. Upon acidifying the aerosol samples to pH = 2, a stronger adsorption effect was observed. Thus, the equivalent SAS concentrations at pH = 2 were in the range from 0.39 to 1.32 µg m−3 (mean 0.73±0.33 µg m−3, n=10) and 0.2 to 0.63 µg m−3 (mean 0.39±0.14 µg m−3, n=6) in urban and rural samples, respectively. In acidic media, the SAS concentrations of marine, regional and continental aerosol samples from Martinska ranged from 0.22 to 0.44 µg m−3 (mean 0.35±0.07 µg m−3, n=10), 0.27 to 0.79 µg m−3 (mean 0.40±0.14 µg m−3, n=18) and 0.10 to 0.39 µg m−3 (mean 0.24±0.11 µg m−3, n=10), respectively. An increase in the equivalent SAS concentration at a lower pH was characteristic for all investigated samples ranging from 28.6 to 46.4% (Fig. 8). The minimum increase in acidic medium was detected for the samples collected in Zagreb (28.6%), while the average increase was more pronounced for the Martinska aerosols being in the narrow range from 41.9 to 46.4% depending on the source of the air masses and for K-puszta samples (34.2%). This supports the statements that SASs in aerosol samples are predominantly of anionic type, that is negatively charged. These findings are in good agreement with the literature, where polyacidic compounds and highly polyconjugated acidic compounds like HULIS were found to be significant surfactants in atmospheric aerosol (Facchini et al., 2000; Kiss et al., 2005).
Fig. 8.
The average increase of SAS concentrations upon acidification (pH = 2) of aqueous extracts of the aerosol samples from K-puszta, Zagreb and Middle Adriatic Martinska station influenced by marine, regional and continental air mass inputs.
5. Conclusions
AC voltammetry (out-of-phase mode) was applied as a new approach for the qualitative and quantitative characterisation of surfactants in the aqueous extract of atmospheric aerosol samples, and the method was tested on aerosol samples collected at various locations: K-puszta (continental rural site in Hungary), Martinska (Middle Adriatic coastal area in Croatia) and Zagreb (urban site in Croatia). The non-urban samples were classified on the basis of back-trajectories into groups representative of continental, marine and regional (originating from Croatia and/or Bosnia and Herzegovina) air masses. The high sensitivity of this electrochemical method enabled the reliable quantification of SASs (expressed as equivalent of T-X-100) in PM2.5 Hi-Vol aerosol samples collected for 23 h. This was done without laborious and time-consuming sample pre-treatment, which is another advantage of this method.
The highest SAS concentrations were detected in the urban samples of Zagreb, while lower values were characteristic for the non-urban samples being in the ranges from 0.34 to 0.91 and 0.07 to 0.46 µg m−3 equivalent of T-X-100, respectively. It should be noted that there was no significant difference between the average SAS concentrations obtained for the aerosols of non-urban sites influenced by various air masses. In addition to the aqueous aerosol extracts isolated HULIS were also investigated. It can be concluded from the voltammograms that HULIS exhibit significant surfactant nature.
By analysing the shapes of voltammetric curves a broad peak was found in the potential range from −0.65 to −0.85 V characteristic for all aerosol samples as well as for isolated HULIS. However, the different shapes and the positions of the peak indicated the difference in the chemical composition of the SASs present in various samples.
The SAS concentrations was normalised to the WSOC content, and it was found that the normalised surfactant concentration for the non-urban samples ranged from 0.08 to 0.16 in most cases, while for the urban samples this value was typically higher than 0.24. This difference was explained by the elevated emission of non-polar compounds from traffic in urban environment followed by photochemical reactions.
Additional information on the chemical nature of SASs was obtained by quantitatively studying SASs at different pH values. Upon acidifying the aerosol samples to pH = 2, an increase in the equivalent SAS concentration was observed for all investigated samples (ranging from 28.6 to 46.4%), indicating predominantly the anionic type of SASs in the aerosol samples.
The advantage of the AC voltammetry method is its simplicity and sensitivity that enables a direct analysis of SASs in aerosol extracts, rain and cloud water without the need for sample concentration. In the case of aerosol samples, better temporal (and also size) resolution can be achieved. Furthermore, the qualitative information on the chemistry of surfactants can also be obtained by the method as demonstrated in this study. Finally, different aerosol samples can be compared by using the calibration in T-X-100.
6. Acknowledgements
The financial support of the FP-6 project European Super-sites for Atmospheric Aerosol Research (EUSAAR, RII3-CT-2006-026140), the bilateral intergovernmental research project ‘Complex investigation of organic aerosols in rural, urban and marine environment’ (OMFB-01452/2009) and of the Croatian Ministry of Science, Education and Sports project ‘Nature of organic matter, interaction with traces and surfaces in environment’ (Grant No. 098-0982934-2717) is gratefully acknowledged. We wish to thank Dr Elvira Bura-Nakić for significant assistance during the sample collection at the Martinska station.