Fig. 1.
Annual distributions of BC aerosol burden for year 2000: (a) BCBurden Mean: 3.362×10⁻¹ mg m−2 LMDZ (GEIA); (b) BCBurden Mean: 1.421×10⁻¹ mg m−2 LMDZ (BOND); (c) BCBurden Mean: 3.60902×10⁻¹ mg m−2 Median (AeroCom); (d) BCBurden Mean: 4.46869×10⁻¹ mg m−2 GISS (AeroCom); (e) BCBurden Mean: 5.34016×10⁻¹ mg m−2 GOCART (AeroCom) and (f) BCBurden Mean: 3.40439×10⁻¹ mg m−2 CAM (AeroCom).
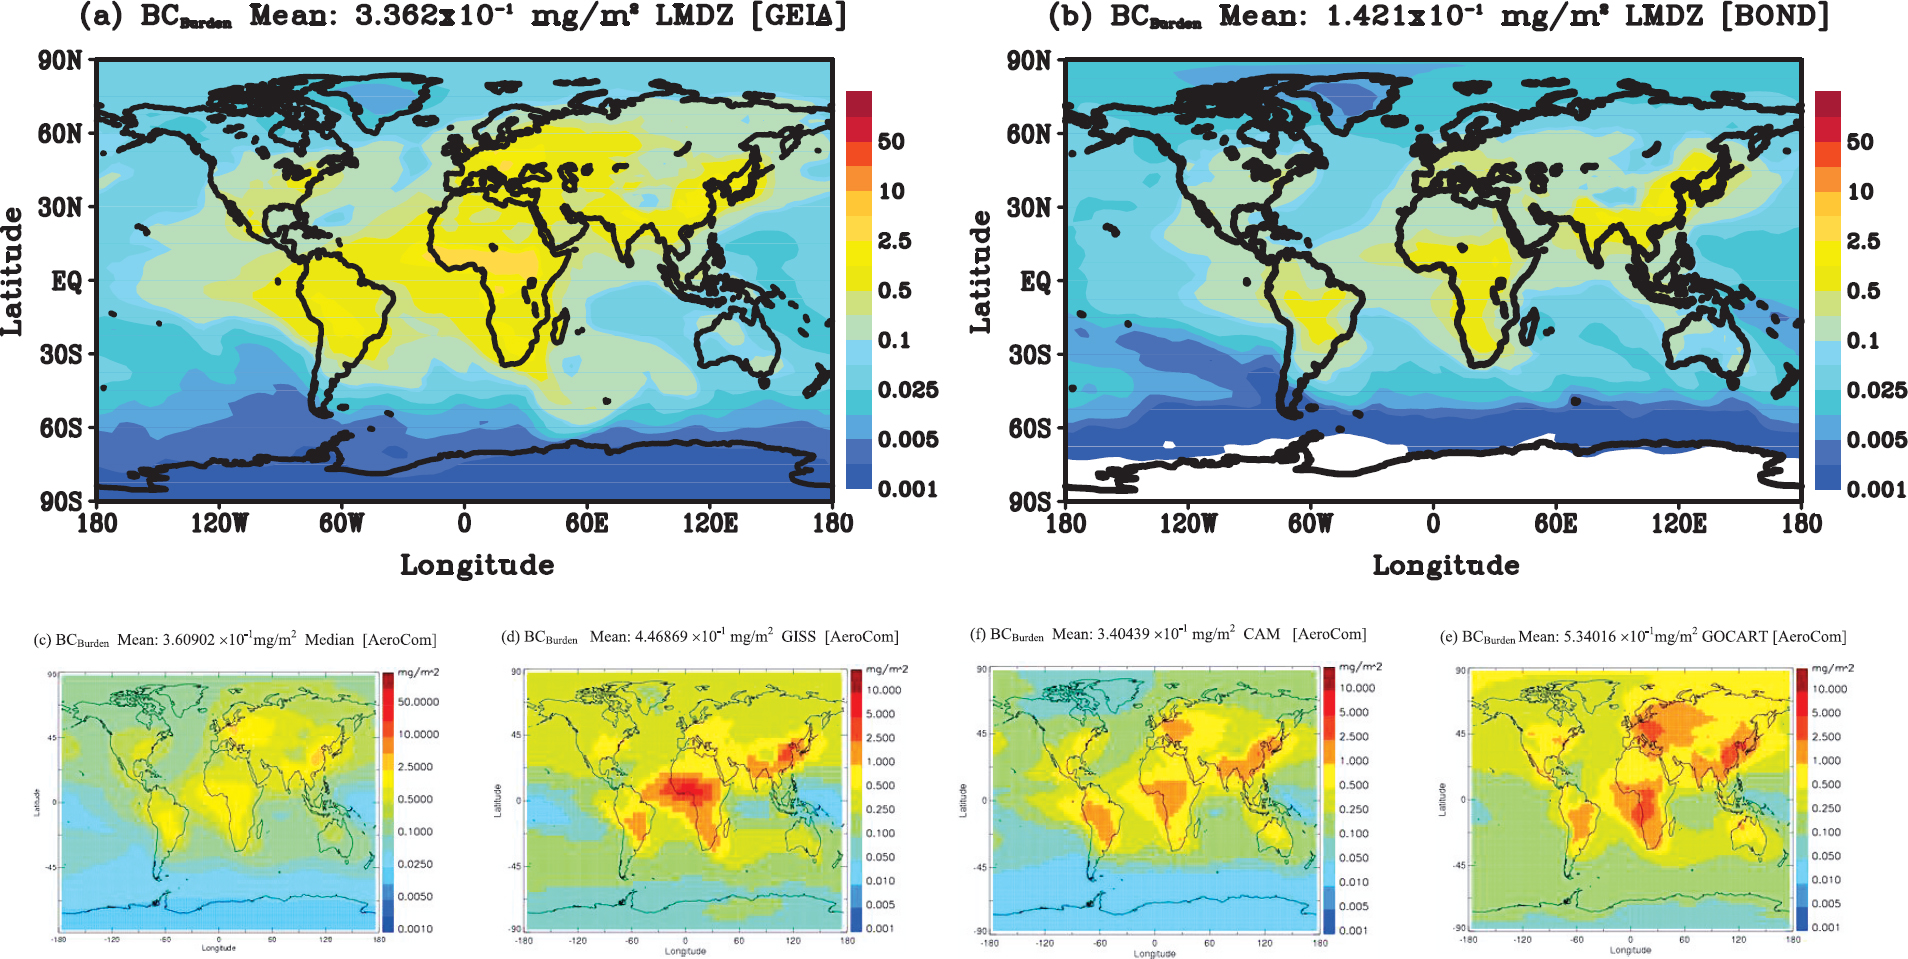
Fig. 2.
Annual distributions of OM aerosol burden: (a) OMBurden Mean: 3.32 mg m−2 LMDZ (GEIA) and (b) OMBurden Mean: 1.03 mg m−2 LMDZ (BOND).
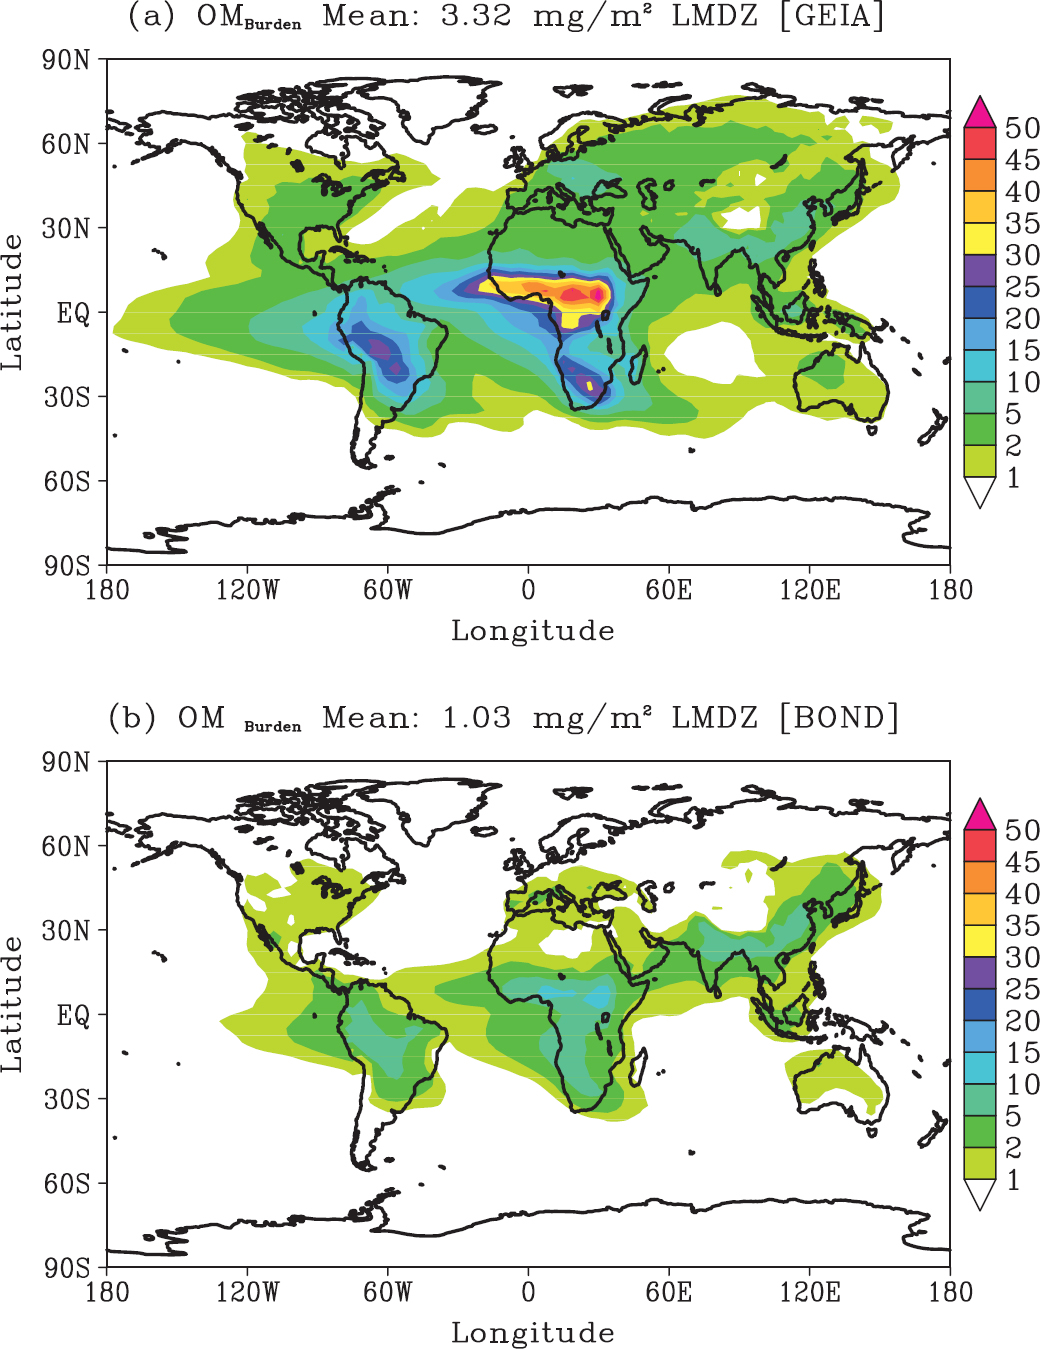
Fig. 3.
Annual averages of carbonaceous aerosol (BC + OM) burden: (a) (BC + OM)Burden Mean: 3.61 mg m−2 LMDZ (GEIA); (b) (BC + OM)Burden Mean: 0.84 mg m−2 LMDZ (BOND) and (c) NDs of Burden (GEIA and BOND).
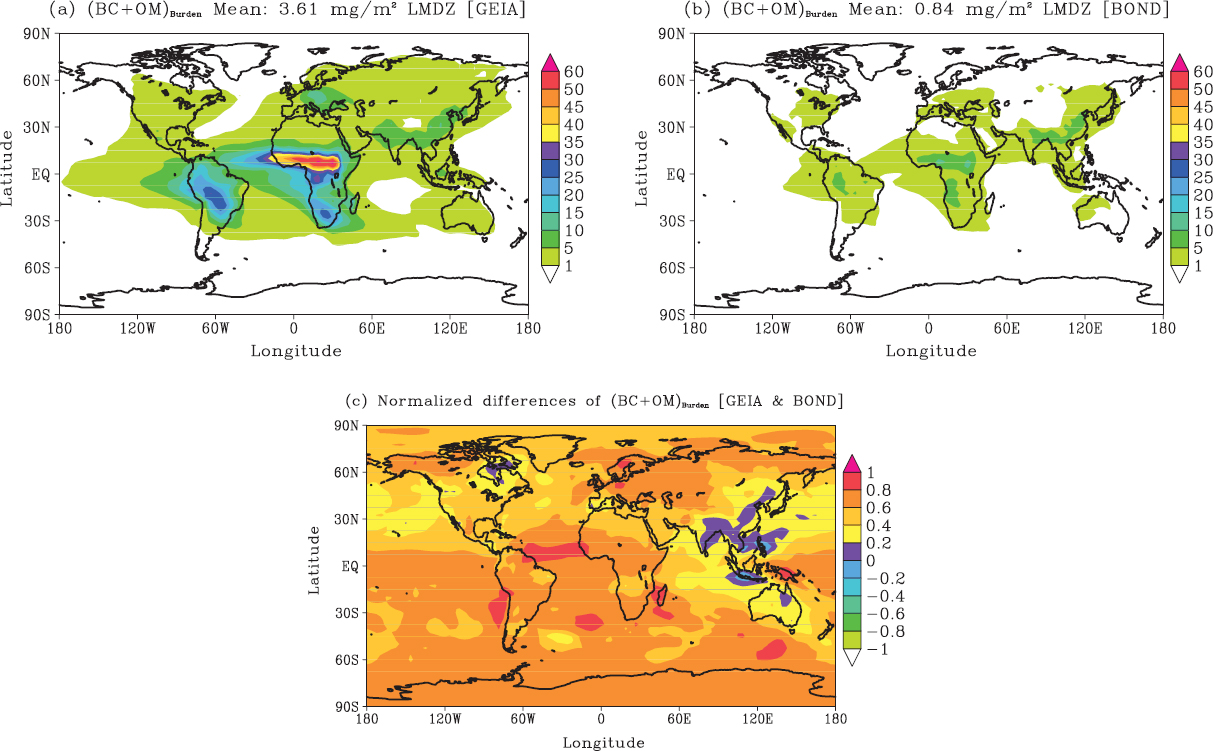
Fig. 4.
Annual distributions of AOD (550 nm) of BC aerosols for year 2000: (a) BC AOD (550 nm) Mean: 3.15967×10⁻³ LMDZ (GEIA); (b) BC AOD (550 nm) Mean: 1.33626×10⁻³ LMDZ (BOND); (c) BC AOD (550 nm) Mean:3.6180×10⁻³ Median (AeroCom); (d) BC AOD Mean: 4.38695×10⁻³ GISS (AeroCom); (e) BC AOD Mean: 5.36252×10⁻³ GOCART (AeroCom) and (f) BC AOD Mean: 3.11874×10⁻³ CAM (AeroCom).
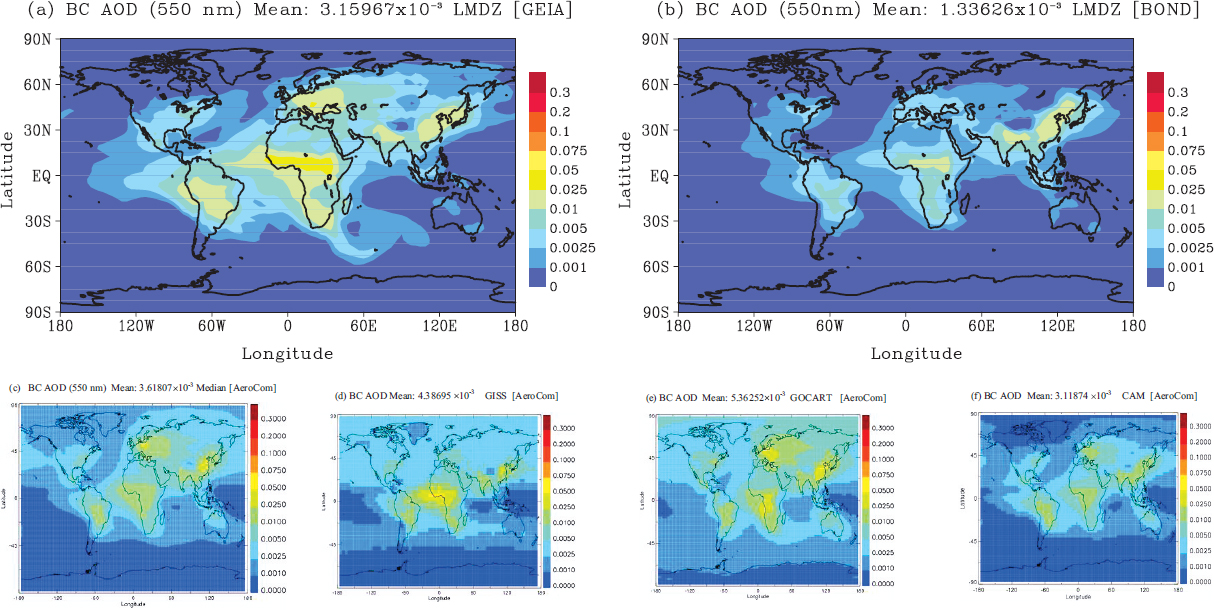
Table 1. Physical and optical properties at (550 nm) of dry aerosol (BC and OM)
Fig. 5.
Annual distributions of AOD (550 nm) of OM: (a) OM AOD (550 nm) Mean: 0.023 LMDZ (GEIA); (b) OM AOD (550 nm) Mean: 0.076 LMDZ (BOND) and (c) NDs of AODOM (GEIA and BOND).
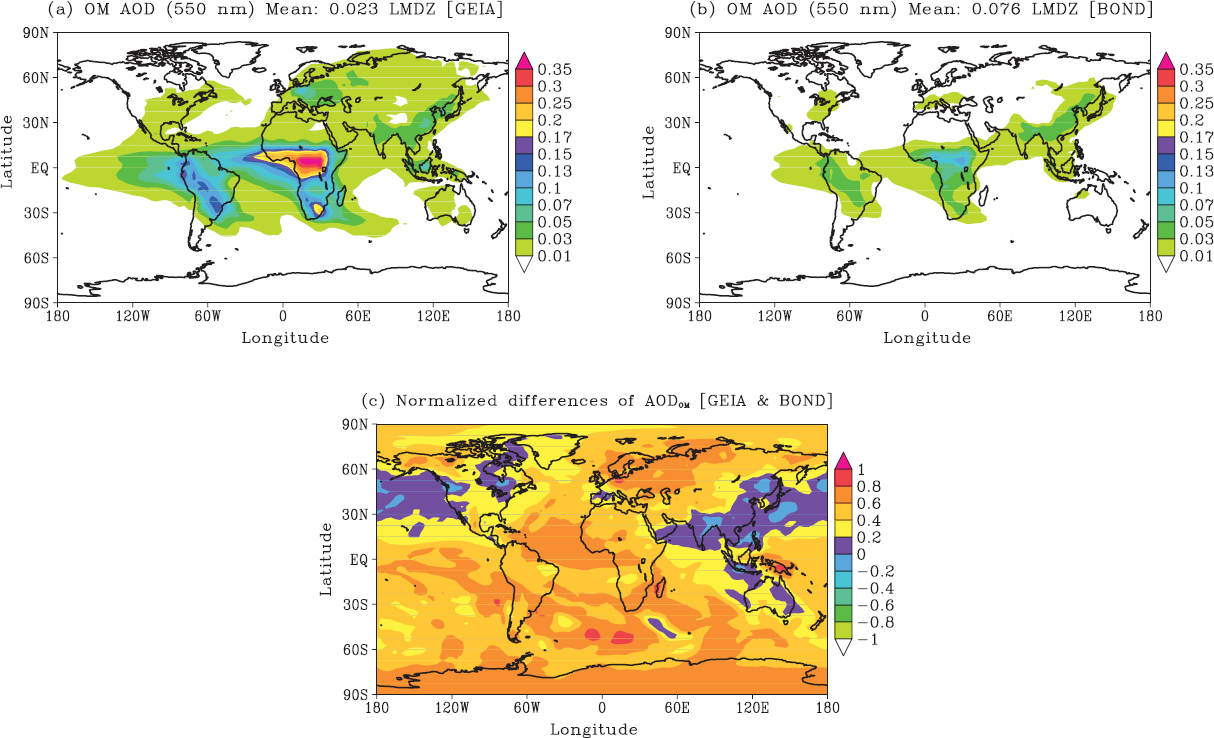
Fig. 6.
Annual distributions of AOD (550 nm) of Carbonaceous (BC + OM) aerosols: (a) AODBC + OM (550 nm) Mean: 0.004 LMDZ (GEIA); (b) AODBC + OM (550 nm) Mean: 0.001 LMDZ (BOND) and (c) NDs of AODBC + OM (GEIA and BOND).
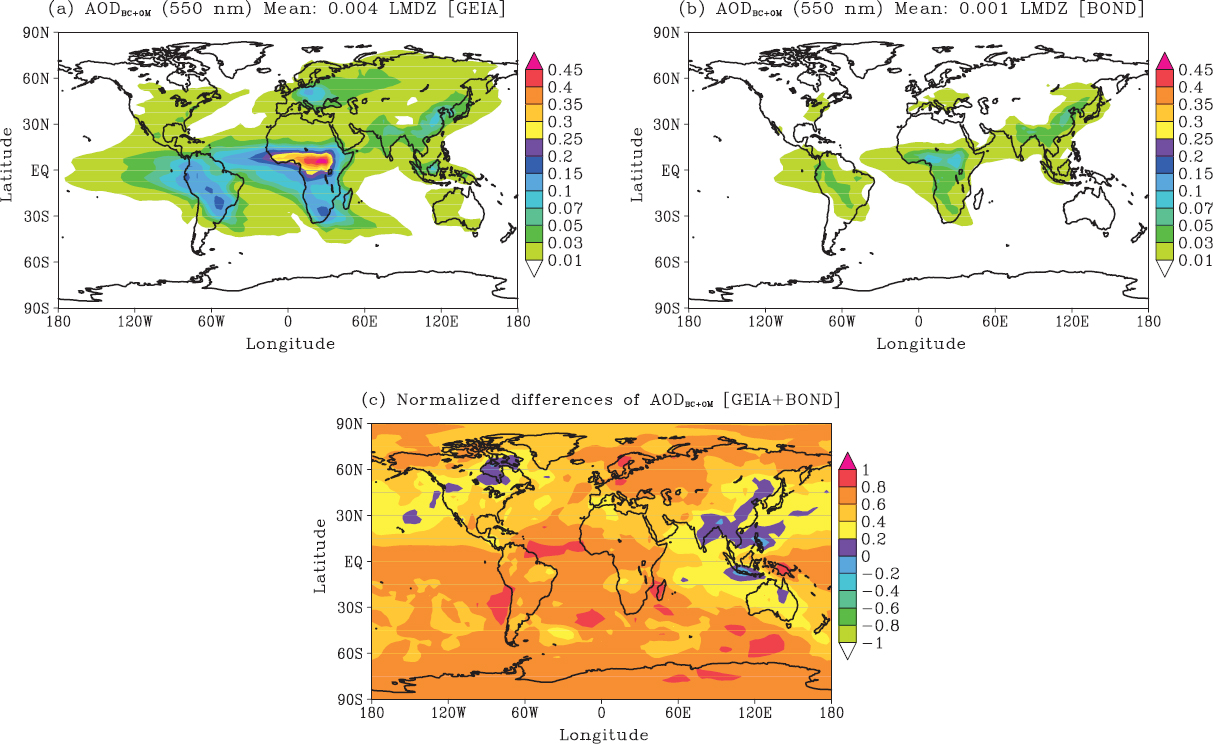
Fig. 7.
Annual distributions of TOA DRF for BC aerosols: (a) TOA DRF BC Mean: +0.33 W m−2 LMDZ (GEIA); (b) TOA DRF BC Mean: +0.14 W m−2 LMDZ (BOND) and (c) NDs of TOA DRFBC (GEIA and BOND).
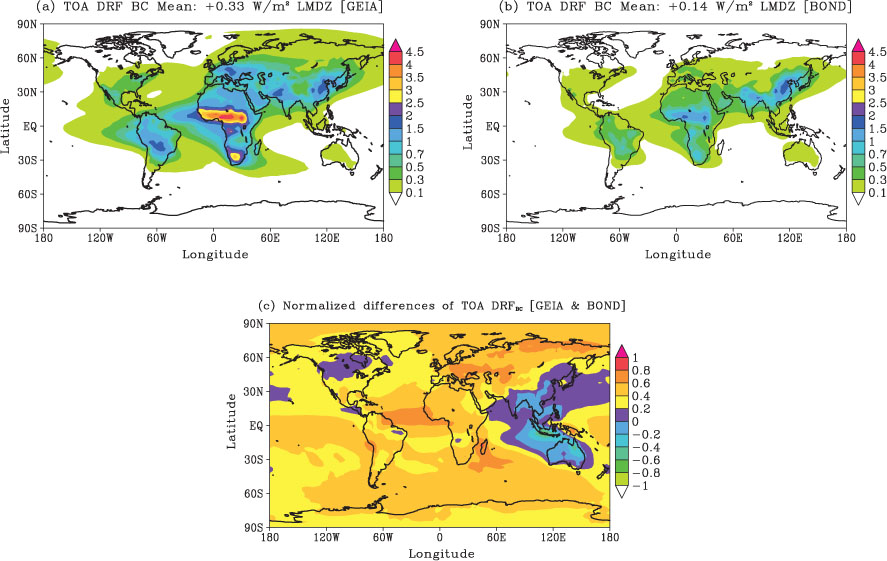
Table 2. Comparison of predicted DRF of BC aerosols with other estimates (W m−2)
[i] FF = fossil fuel; BB = biomass burning.
Fig. 8.
Annual distributions of TOA DRF for OM aerosols: (a) TOA DRF OM Mean: −0.44 W m−2 LMDZ (GEIA); (b) TOA DRF of OM Aerosols = − 0.11 W m−2 (BOND) and (c) NDs TOA DRFOM (GEIA and BOND).
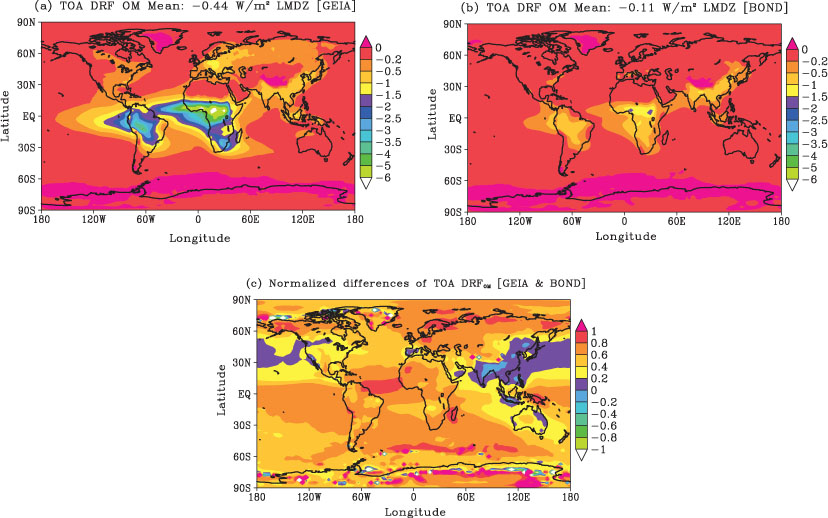
Table 3. Comparison of predicted DRF of OM aerosols with other estimates (W m−2)
[i] FF = fossil fuel; BB = biomass burning.
Fig. 9.
Annual distributions of TOA DRF of carbonaceous (BC + OM) aerosols: (a) TOA DRF (BC + OM) Mean: −0.014 W m−2 LMDZ (GEIA) and (b) TOA DRF (BC + OM) Mean: +0.118 W m−2 LMDZ (BOND).
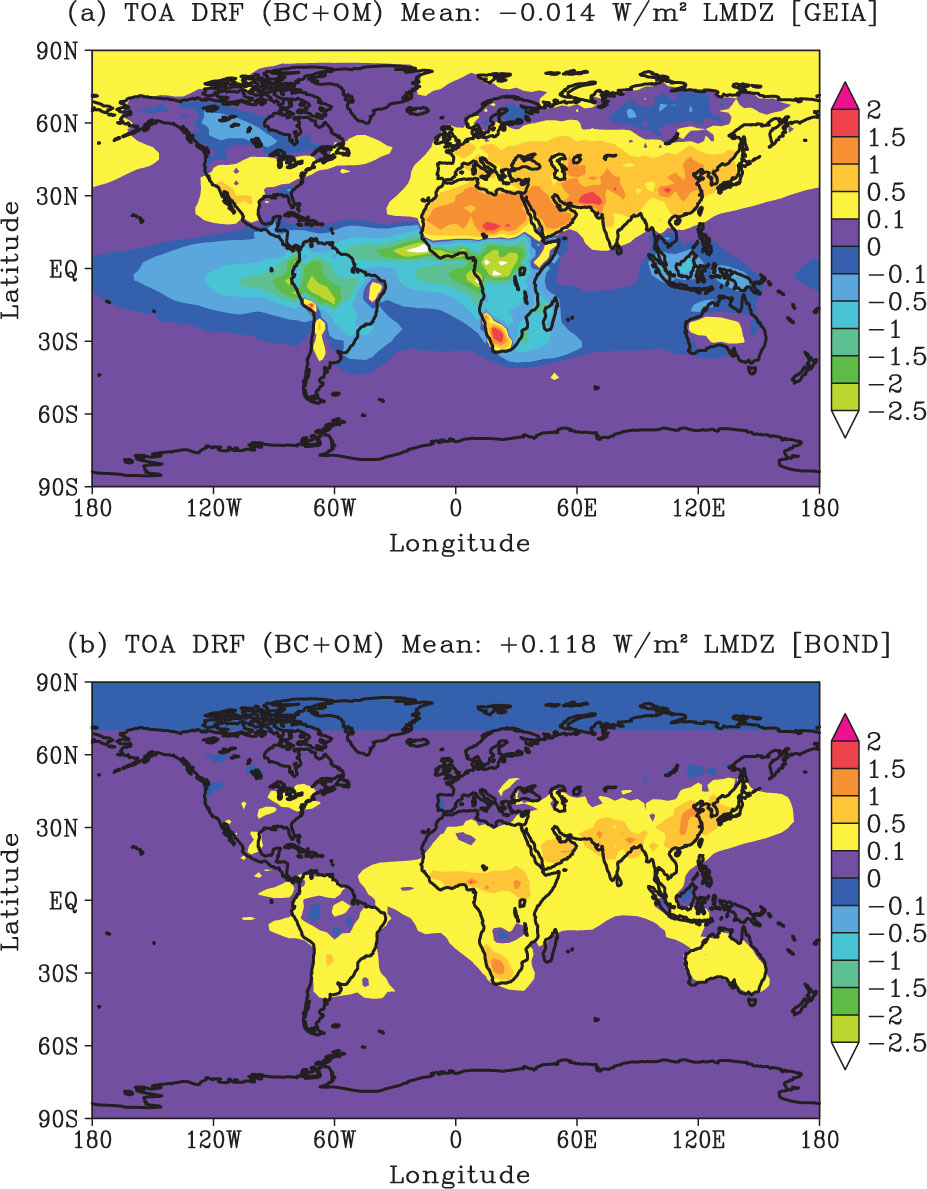
Table 4. Comparison of emissions between GEIA and BOND inventories
Fig. 10.
Annual distributions of SRF of carbonaceous (BC + OM) aerosols: (a) SRF (BC + OM) Mean: −1.49 W m−2 LMDZ (GEIA); (b) SRF (BC + OM) Mean: −0.51 W m−2 LMDZ (BOND) and (c) NDs SRF (BC + OM) (GEIA and BOND).