
Table 1. Channel specification for the humidity sounder SAPHIR around the water vapour absorption band at 183GHz, in terms of frequency, bandwidth and radiometric noise
H1183.31±0.202001.821.44H2183.31±1.193501.011.05H3183.31±2.705000.930.91H4183.31±4.007000.880.77H5183.31±6.6012000.810.63H6183.31±11.0020000.730.54
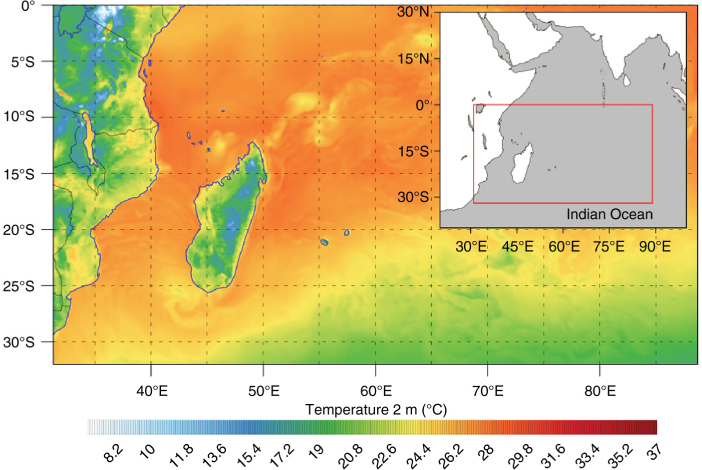
Fig. 1
ALADIN-Réunion domain with a 6-h forecast of 2-m temperature valid at 0000 UTC 15 January 2012. This domain is also displayed within a larger area covering the Western Indian Ocean.
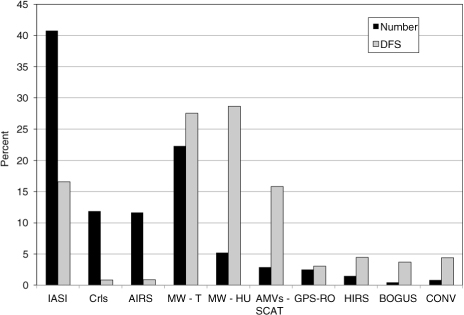
Fig. 2
Percentage of observation types assimilated in ALADIN-Réunion over 1day (four analysis cycles) on 30 January 2015 together with the corresponding percentage of information content (DFS: degree of freedom for signal). The total number of observations is 437691 and the total value of the DFS is 26585.
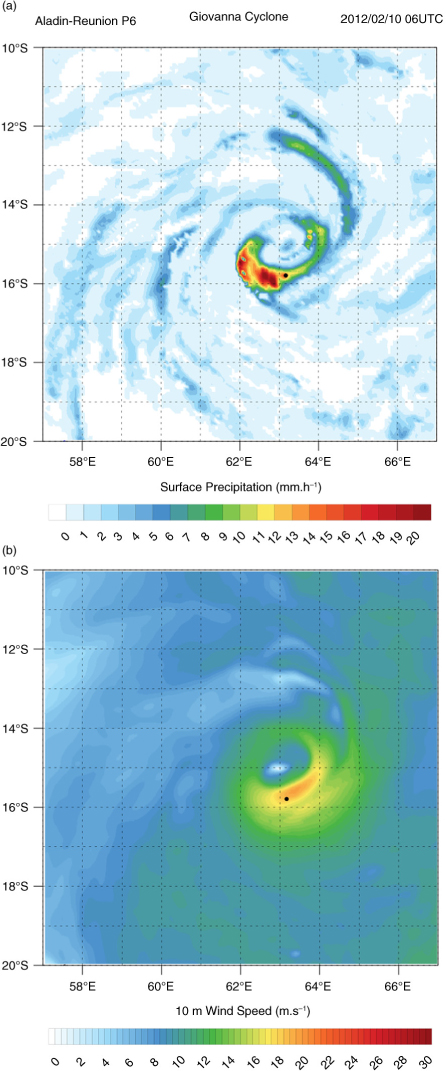
Fig. 3
(a) Instantaneous surface precipitation rate and (b) 10-m wind speed simulated by a 6-h forecast of the ALADIN-Réunion model (10 February 2012 at 0600 UTC) over an area encompassing the tropical cyclone Giovanna. The black dot corresponds to the location of the atmospheric profiles shown in Fig. 4.
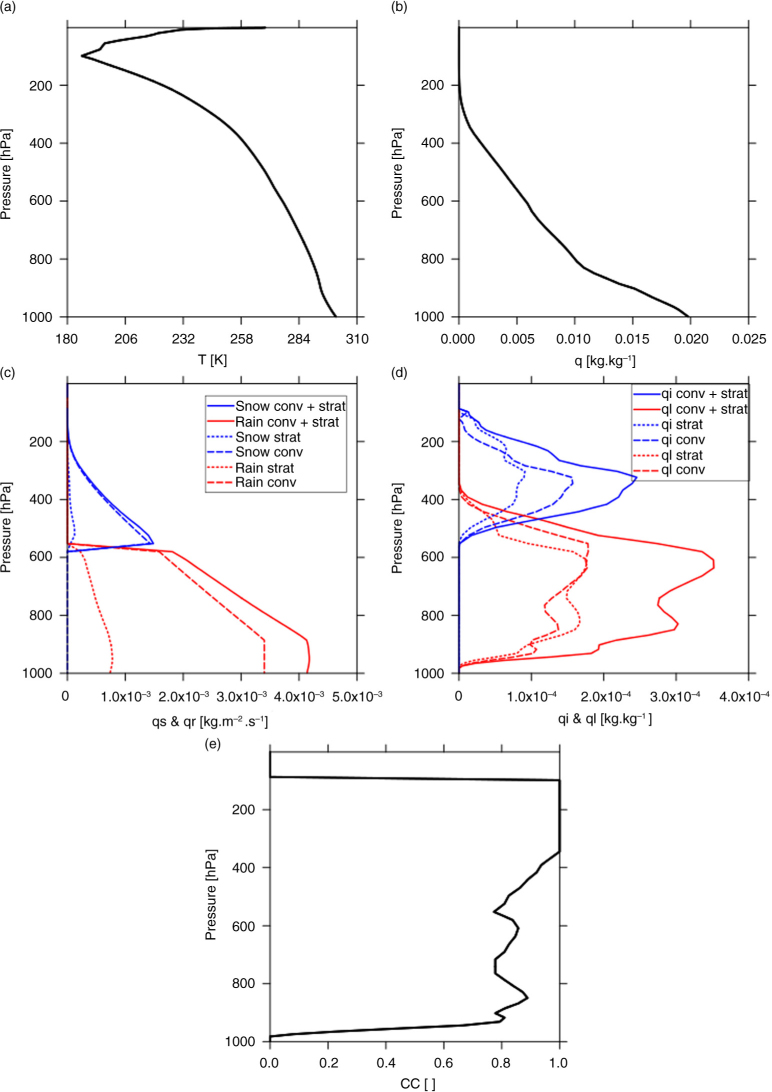
Fig. 4
Atmospheric profiles from a 6-h forecast of the ALADIN-Réunion model (10 February 2012 at 0600 UTC) at a location given in Fig. 3, for (a) temperature (T), (b) specific humidity (q v ), (c) liquid and solid precipitation fluxes including stratiform and convective contributions (q r , q s ), (d) cloud liquid and ice water contents (q l , q i ), and (e) cloud cover (CC).
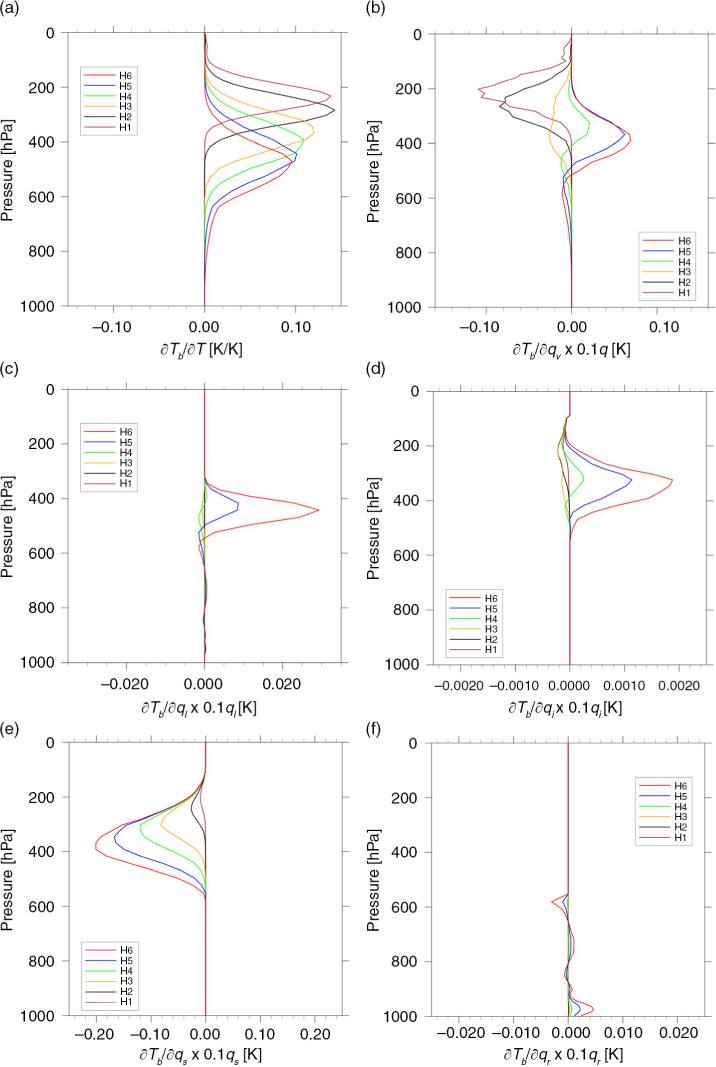
Fig. 5
Scaled Jacobians of SAPHIR brightness temperatures T b (i.e. multiplied by a reasonable perturbation size to produce a T b change in K) with respect to (a) temperature , (b) specific humidity , (c) cloud liquid water content , (d) cloud ice water content , (e) snow water content and (f) rain water content for the profiles shown in Fig. 4.
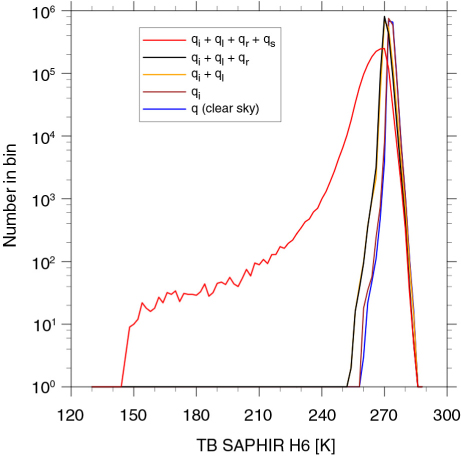
Fig. 6
Distributions of simulated SAPHIR T b (Channel 6) over the ALADIN-Réunion domain in a nadir viewing geometry (February 2012; sample size: 1440000 profiles) with RTTOV-SCATT by introducing progressively hydrometeors (cloud and precipitation) on clear-sky profiles. The introduction of frozen precipitation corresponds to the red curve.
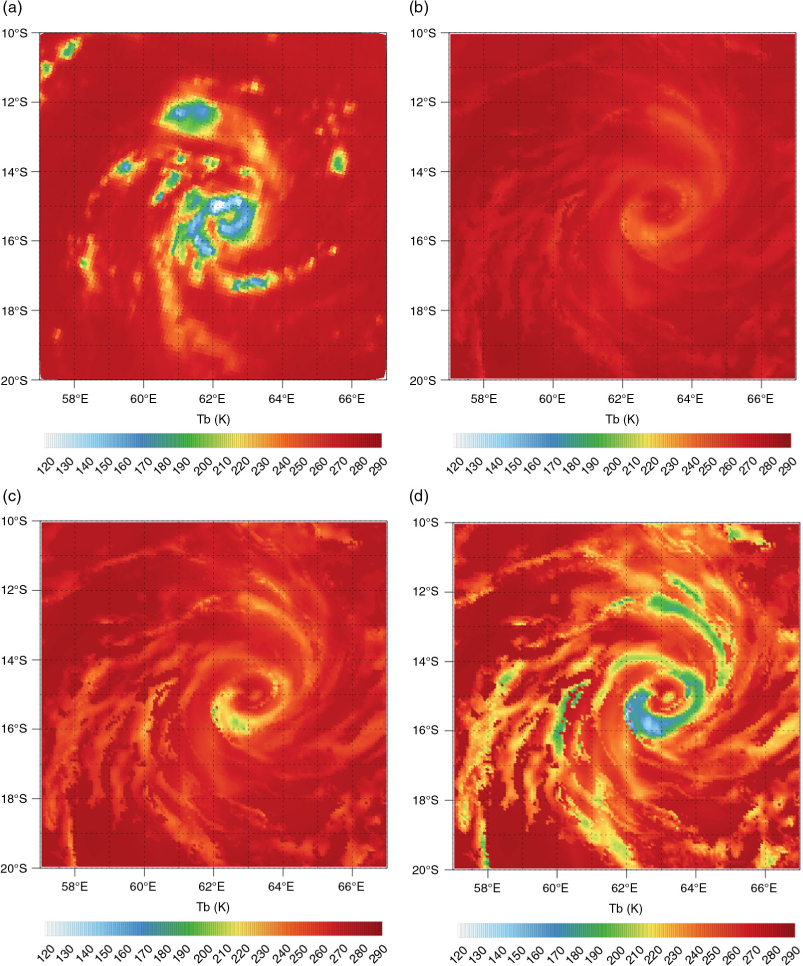
Fig. 7
(a) Observed SAPHIR T b (H6) for cyclone Giovanna (10 February 2012 at 0600 UTC), and simulated T b with ALADIN-Réunion 6-h forecast and RTTOV-SCATT assuming various snow radiative properties: (b) Mie spheres and exponential PSD, (c) ‘Sector snowflake’ and Field et al. (2007) PSD, (d) ‘Block hexagonal column’ and Field et al. (2007) PSD.
Table 2. Coefficients of a mass-diameter law: m=αD β (Kulie et al., 2010) for various snow and ice particles from a database of radiative properties in the microwave spectrum (Liu, 2008)
Long hexagonal column37.093Short hexagonal column116.123Block hexagonal column229.663Thick hexagonal plate122.663Thin hexagonal plate33.2633-bullet rosette0.322.374-bullet rosette0.062.125-bullet rosette0.072.126-bullet rosette0.092.13Sector snowflake0.0021.58Dendrite snowflake0.011.90
Table 3. Definition of six criteria proposed by Staelin and Chen (2000), Hong et al. (2005), Qiu et al. (2005) and Funatsu et al. (2007) for rain occurrence based on various thresholds applied to three SAPHIR channels (H2, H3 and H5) adapted from AMSU-B channels
StaelinH5<260KFunatsu(H5-H2)≤8KHong DCT(H2-H5) and (H2-H3) and (H3-H5)≥0KHong DCO(H2-H5)>(H2-H3)>(H3-H5)>0KQiu CI1(H3-H5)>−2K and (H3-H5)>(H2-H5) and (H3-H5)>(H2-H3)Qiu CI2(H3-H5)>(H2-H3)+Hong DCT
Table 4. Categorical scores of rain occurrence following various criteria using SAPHIR channels (Table 3) against a precipitation threshold above 1mm/h from the TMPA 3B40RT product over the month of February 2012 within the ALADIN-Réunion domain (811 472 collocated values)
Staelin1.270.640.500.36Funatsu1.190.640.470.38Hong DCT0.230.190.190.17Hong DCO0.060.040.200.04Qiu CI10.340.220.350.18Qiu CI20.180.140.190.13
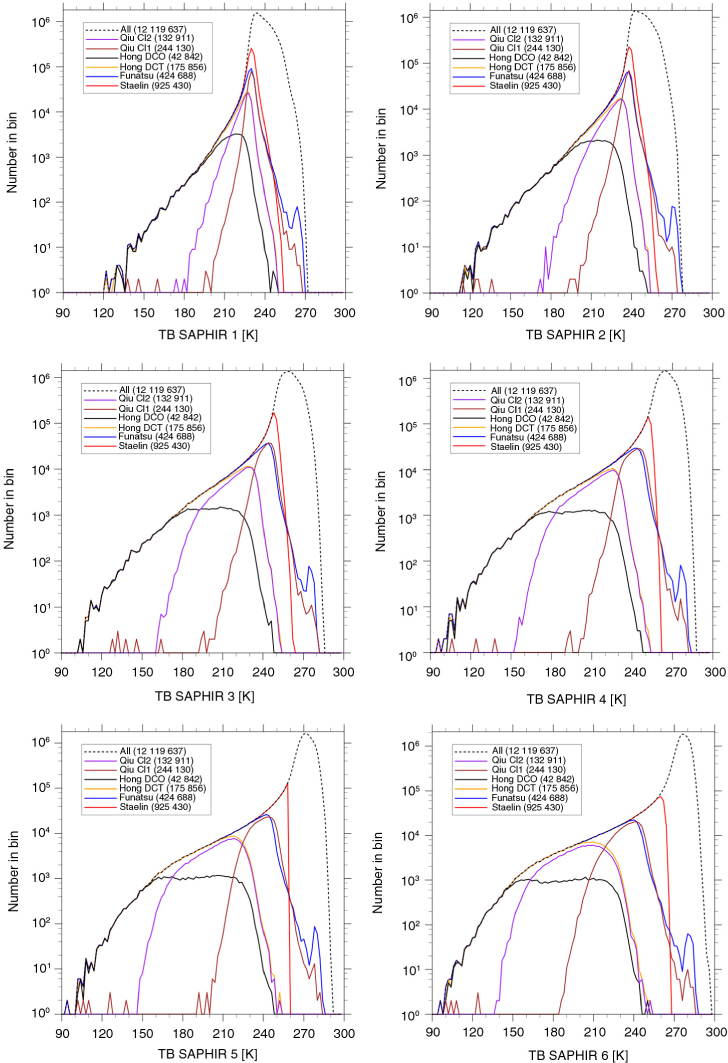
Fig. 8
Distributions of observed SAPHIR T b for the six channels in February 2012 over the ALADIN-Réunion domain. The dashed curves represent the distributions with all observations (clear-sky and cloudy scenes) and the coloured curves represent the distributions of T b kept by the various rain occurrence criteria summarized in Table 3.
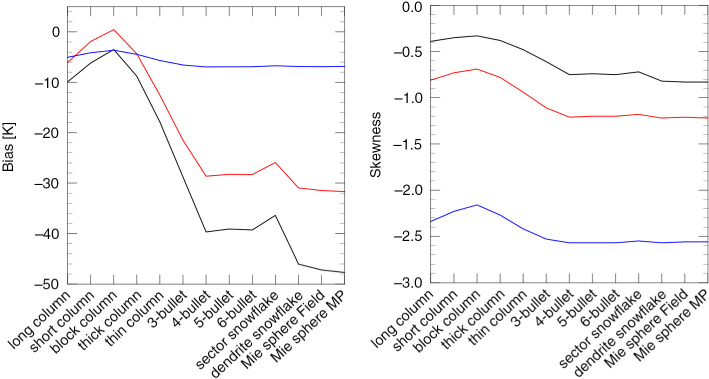
Fig. 9
Differences between observed and simulated (6-h forecasts from ALADIN-Réunion in February 2012) SAPHIR T b for three channels (H1: blue curves; H4: red curves; H6: black curves) for rainy grid points and rainy satellite pixels with varying radiative properties of snow particles according to Liu (2008), with also Mie spheres using either Marshall-Palmer (MP) or Field et al. (2007) PSDs. The differences are measured in terms of bias (left panel), and skewness (right panel).
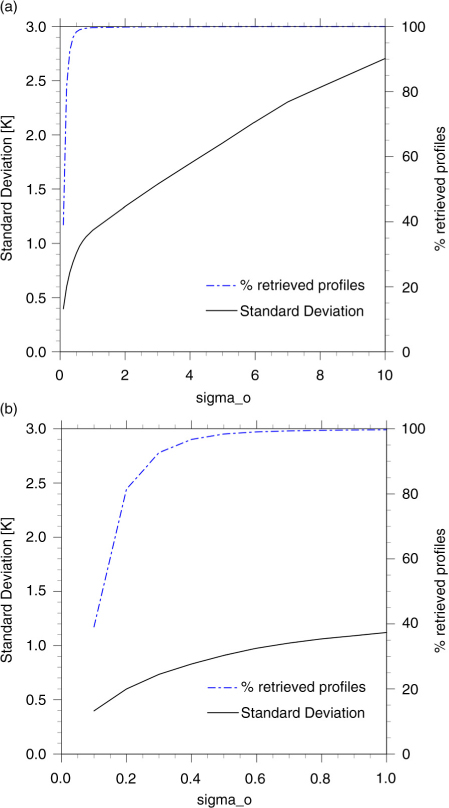
Fig. 10
Sensitivity of the Bayesian inversion to the specification of observation error on retrieved SAPHIR T b s for the tropical cyclone Benilde (31 December 2011 at 0000 UTC) described by the fraction of profiles that can be inverted and by the standard deviation between observed and retrieved brightness temperatures, for values ranging between (a) 0.1 and 1K and (b) 1 and 10K.
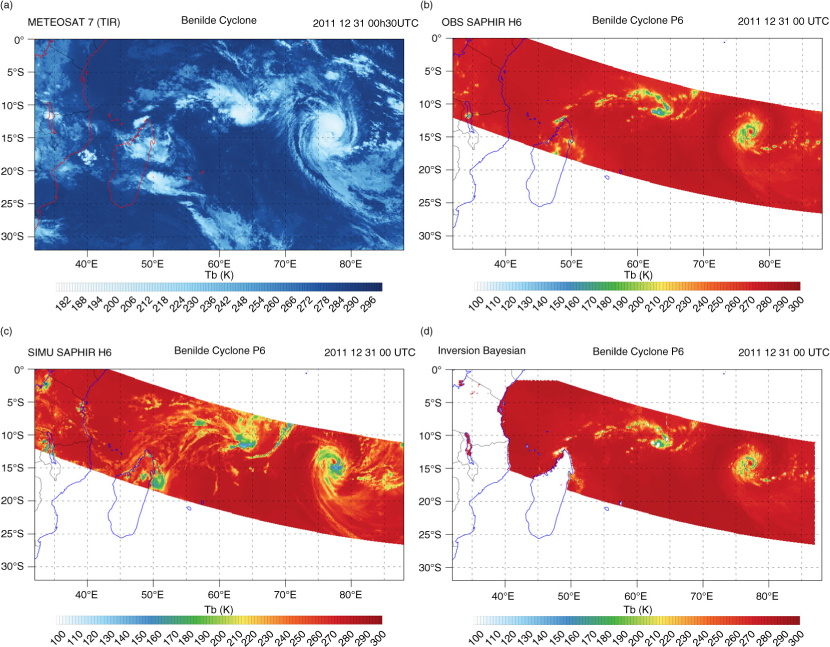
Fig. 11
(a) Observed METEOSAT-7 Infra-Red brightness temperature at 11.5µm at 0000 UTC 31 December 2011 for tropical cyclone Benilde. (b) Observed, (c) simulated and (d) retrieved with a Bayesian inversion of channel H6 microwave SAPHIR brightness temperature for the same event.
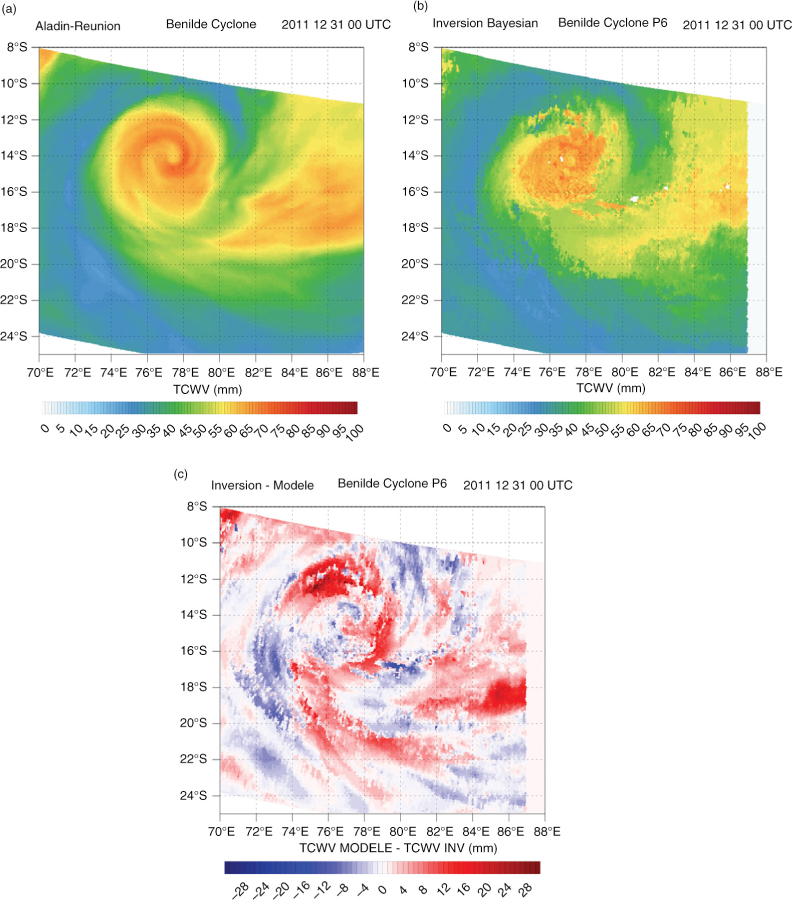
Fig. 12
TCWV (expressed mm) from a 6-h forecast of the ALADIN-Réunion model (a), produced by the Bayesian inversion of SAPHIR T b (b) together with the difference of the two fields (showing the corrections induced by the SAPHIR observations) (c) over the tropical cyclone Benilde (31 December 2011 at 0000 UTC).
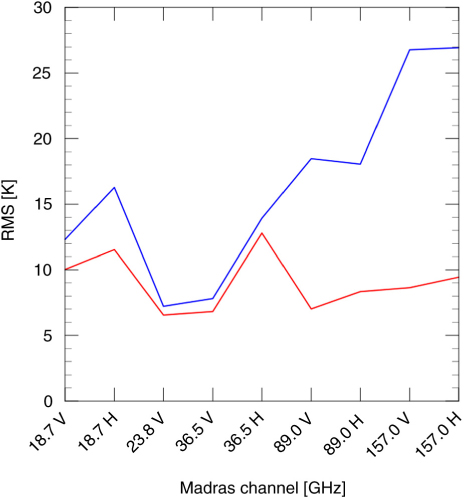
Fig. 13
RMS differences between observed and simulated all-sky MADRAS brightness temperatures with atmospheric profiles from a 6-h forecast of the ALADIN-Réunion model (blue curve) and profiles derived from a Bayesian inversion using all-sky SAPHIR brightness temperatures (red curve) (31 December 2011 at 0000 UTC).