
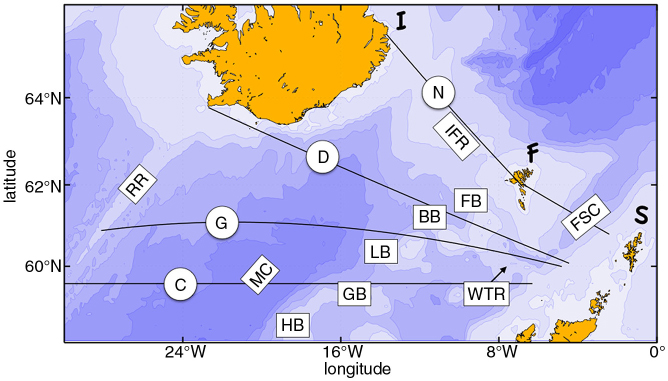
Fig. 1
Map of Nuka Arctica and Norröna routes: the constant latitude (C), great circle (G), diagonal (D) tracks and Norröna (N) tracks. Additional abbreviations are the Iceland Faroes Ridge (IFR), Faroes Shetland Channel (FSC), Hatton Bank (HB), George Bligh Bank (GB), Lousy Bank (LB), Bill Bailey's Bank (BB), Faroes Bank (FB), Wyville-Thomson Ridge (WTR) and Maury Channel (MC).
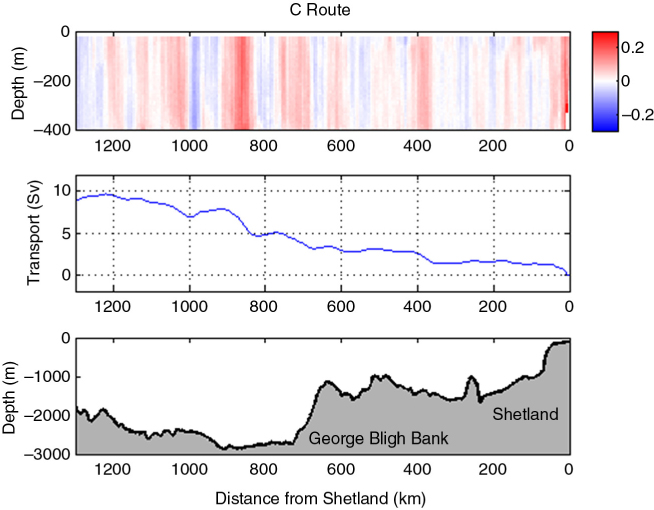
Fig. 2
Mean cross transect velocity in m s−1 (top), cumulative transport to 400 m (middle) and topography (bottom) with distance from Scotland for the C route. The section ends at the RR crest.
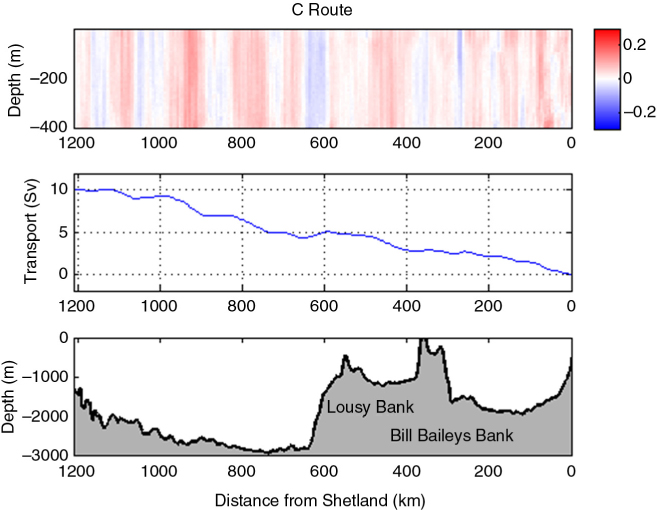
Fig. 3
Mean cross transect velocity in m s−1 (top), cumulative transport to 400 m (middle) and topography (bottom) with distance from Scotland for the Great Circle Nuka Arctica route.
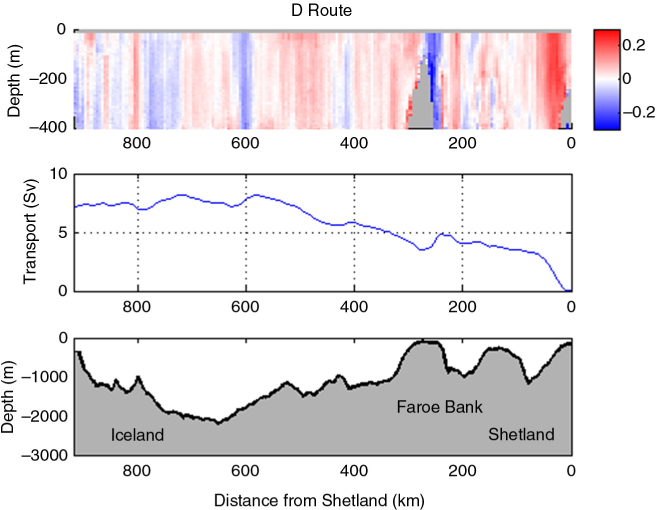
Fig. 4
Mean cross transect velocity in m s−1 (top), cumulative transport to 400 m (middle) and topography (bottom) with distance from Scotland for the Diagonal Nuka Arctica route.
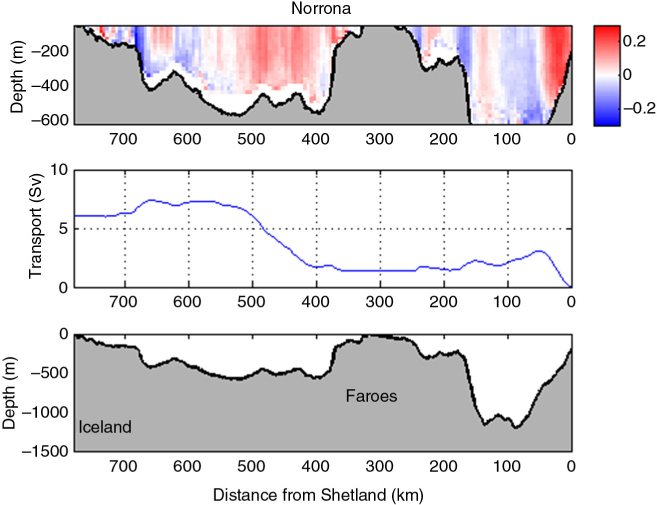
Fig. 5
Mean across transect velocity in m s−1 along the Norröna route (top), cumulative transport to 400 m (middle) and along route topography (bottom).
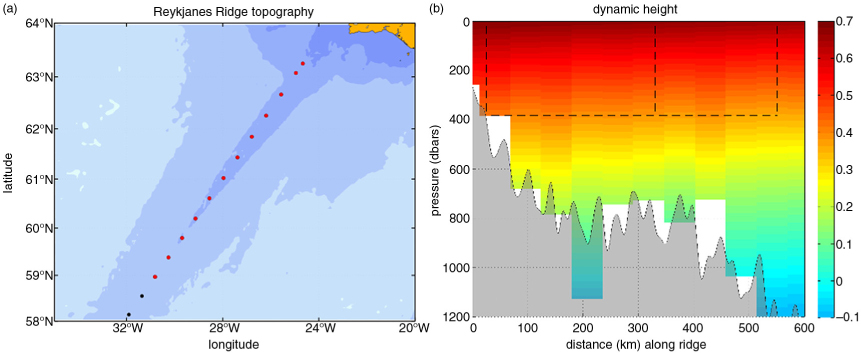
Fig. 6
(a) Locations of CTDs along the RR and (b) dynamic height relative to an estimated dynamic height at 1000 dbars using all stations that reach to the depth (in the figure and to the south). The transport through the dashed box is ~1.5 Sv. The lines at 330 and 550 km correspond to where the G and C routes cross the RR at 61°N and 59.5°N, respectively.
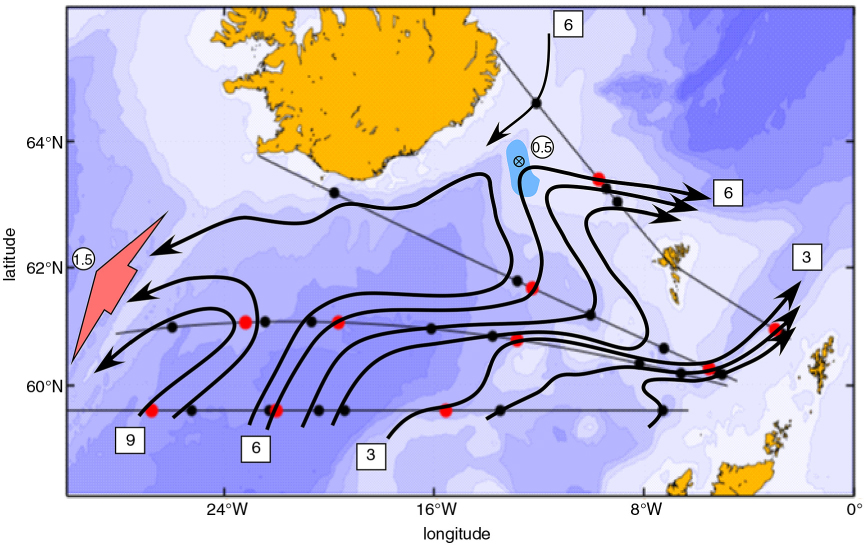
Fig. 7
Cumulative transport in Sv (beginning on the eastern side) for the C, G, D and N(orröna) routes. Black dots indicate each Sv change in cumulative transport (summing from east to west along each route) and red dots indicate each third Sv. The wide pink arrow indicates the flow across the RR and the blue area indicates schematically the loss of overflow water at 400 m depth.