
1. Introduction
With the advent of new and accurate measurement of currents in the northeastern North Atlantic, a more robust description is emerging of the structure and variability of Atlantic Water (AW) entering the Nordic Seas. These waters generally originate in the North Atlantic Current (NAC), which bifurcates southeast of the Reykjanes Ridge (RR) with branches flowing poleward on both sides of the ridge. The western rather well-defined branch is ultimately bound for the Labrador Sea where it contributes to the production of intermediate depth Labrador Sea water (e.g. Chafik et al., 2014). The eastern branch becomes the major source of all water entering the Nordic Seas (Orvik and Niiler, 2002), but the pathways by which the water reaches the Iceland–Faroes–Scotland ridge (IFSR) are clearly influenced by the complex banks topography west of Scotland (Fig. 1, Hansen et al., 2008).
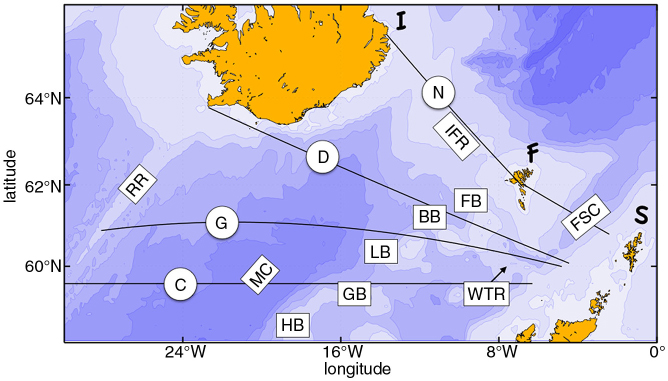
Fig. 1
Map of Nuka Arctica and Norröna routes: the constant latitude (C), great circle (G), diagonal (D) tracks and Norröna (N) tracks. Additional abbreviations are the Iceland Faroes Ridge (IFR), Faroes Shetland Channel (FSC), Hatton Bank (HB), George Bligh Bank (GB), Lousy Bank (LB), Bill Bailey's Bank (BB), Faroes Bank (FB), Wyville-Thomson Ridge (WTR) and Maury Channel (MC).
On the basin scale, the near surface water entering the Iceland Basin from the NAC flows relatively unimpeded through the Iceland Basin west of Hatton bank, much of which will cross the Iceland–Faroes Ridge into the southern Norwegian Sea. But some water will split off through the banks towards Scotland, and the remainder will curve west following the Iceland slope and the RR (Bower et al., 2002). Some of this recirculating water, which increases in strength with depth, may upon reaching the deeper gaps in the RR, south of 60°N, cross over into the Irminger Sea (Bower et al., 2002).
To the east, water with a strong Mediterranean component enters the Rockall Trough from the south, potentially as part of a northward flowing shelf edge current (Reid, 1979; Iorga and Lozier, 1999; Orvik and Niiler, 2002). Within the Rockall Trough, there is little evidence for significant flow north as the study by Bower et al. (2002) did not observe any drifter tracks entering the Rockall Trough from the NAC. Indeed, the water within the Rockall Trough is Eastern North Atlantic Water, clearly distinguishable by its high salinity (McCartney and Mauritzen, 2001; New and Smythe-Wright, 2001). However, north of the Rockall Trough opening at the western end of the Wyville-Thomson Ridge (WTR), the mean flow at 37 m depth is eastward plausibly feeding the Slope Current from the west rather than from the Rockall Trough (McCartney and Mauritzen, 2001), but much remains to be determined about the circulation in this region of complex topography. McCartney and Mauritzen (2001) provide a comprehensive overview and synthesis of the hydrographic literature of the northeast Atlantic, and in their review make it quite clear that most water entering the Faroes–Shetland Channel must come from the NAC and not the Mediterranean outflow. This paper supports their conclusion. Also of interest is the study by Sarafanov et al. (2012), which gives a very detailed synthesis of the 3-D circulation between Greenland and Scotland from eight CTD sections along 59.5°N.
In this paper, we take a very different approach; instead of hydrography we use data from hull-mounted acoustic Doppler current profilers (ADCPs) in two vessels, the M/V Nuka Arctica and M/F Norröna, in commercial service to synthesise the mean flow in the top 400 m. The data come from four different routes: a constant latitude (C) section at 59.5°N, a great circle (G) section at roughly 61°N between Scotland and Greenland, a diagonal (D) section from Scotland to Iceland and a section at the entrance to the Nordic Seas between Iceland, the Faroes and Scotland (N route), all shown in Fig. 1. By combining the high resolution (~5 km), repeat scans of currents along four routes, we seek to construct a detailed representation of the major pathways of AW through the Iceland Basin and banks region from 59.5°N to the IFSR.
Chafik et al. (2014) use the Nuka Arctica C route ADCP data and satellite altimetry to describe the spatial and temporal characteristics of poleward flows between Greenland and Scotland over the top 400 m. Of particular note in the Chafik et al. (2014) study is the strong role of the RR in separating topographically bound flows towards the Nordic and Labrador Seas. We focus here on the flow east of the RR as the principal source of water entering the Nordic Seas across the IFSR. According to Chafik et al. (2014), the total transport across the C route can be decomposed into three primary flows, from west to east, they are a 4.5 Sv flow over the Maury Channel, a 1.2 Sv flow just east of George Bligh Bank and 1.7 Sv flow along the Scottish slope. They propose that these two latter currents combine at the entrance to the Faroes–Shetland Channel as the Slope Current. A major fraction of the Maury Channel flow crosses the Iceland–Faroes Ridge with the remainder turning west and south following the RR.
Expanding upon the findings of Chafik et al. (2014), we include here the Nuka Arctica data along its great circle (G) and diagonal (D) routes. The G route runs rather parallel to the Chafik et al. (2014) (C) route and as such serves as valuable independent measure of how well transport can be estimated by ship-mounted ADCPs over these great distances. The diagonal route (D) is central to this study, for it helps delineate the flow patterns between the C and G transects to the south and the Norröna route along the IFSR. In the next section, we briefly describe the data and methods. Section 3 presents the spatial structure of the currents and the corresponding transport integrals for the three Nuka Arctica routes and the Norröna route. In Section 4, we discuss the findings and synthesise these into a chart of mean transport through the northeast Atlantic. A brief summary of our findings is given in Section 5.
2. Data and methods
Data for this study rely on ADCP velocities obtained by two ships of opportunity in the North Atlantic. One vessel, the M/F Norröna, is a high-speed ferry operated by Smyril Lines that makes weekly round trips from Denmark to Iceland via the Faroes Islands. It has been operating a hull-mounted 75 kHz ADCP reaching to about 500–600 m depth since March 2008. Here we will use data through June 2012. A complete description of the data collection, methods and early results can be found in Rossby and Flagg (2012) and Childers et al. (2014). The other vessel, the Royal Arctic Lines M/V Nuka Arctica, operates on a 3-week schedule between Greenland and Denmark with occasional stops in Iceland. The Nuka Arctica data used here come from a hull-mounted 150 kHz ADCP that profiles to ~400 m. Velocity data were collected by the Nuka Arctica nearly one decade prior to the Norröna observations, between 1999 and 2002, using methods summarised in Knutsen et al. (2005) and Chafik et al. (2014).
The 3-s ping ensembles are averaged into 5 km lateral by 8 m depth bins for the Nuka Arctica sections and 5 km lateral by 20 m depth bins along the two Norröna transects. The transports across each transect both along the Nuka Arctica and Norröna lines are defined here as the volume flux in Sverdrups (1 Sv = 106 m3 s−1) normal to the transect and can be represented as
where A bin is the area of each bin and u bin is the velocity normal to it. The westward integrations start just inshore of the Slope Current (roughly at the 100 m isobath) west of Shetland and include all flow to the bottom or 400 m depth whichever comes first. The reason for 400 m (or the bottom) is to create a well-defined control volume through which all water flows. We can determine flows across four routes between the RR and Iceland in the west and the Scotland slope in the east. How well these integrals agree will give us a measure of internal consistency, and potential volume flux divergence and its causes. But just as important, these transport integrals give us useful information on allowable pathways through the region. For this concept to be useful, it is assumed that the flow in the top 400 m is approximately non-divergent, which in fact appears to be the case. Each vessel crossing contributes one degree of freedom (DoF) in the transport uncertainty calculations for each route. The transport estimates are most robust along the more frequently used C and G routes and less so over the D route since an intermediate stop in Iceland was made on only 10 occasions during the sampling period. The Norröna operates along very well-defined routes from the Faroes to Iceland and Denmark. In the first years, she often sailed north of the Shetlands to Bergen Norway, but for the last several years almost exclusively operates the same non-stop route to Denmark passing through the Shetlands to the northern tip of Denmark (see Childers et al., 2014 for a detailed description of the Norröna operation).
Crucial to these long-distance integrations is the accuracy of vessel heading and speed so that vessel velocity can be accurately removed from the ADCP vectors. This is achieved with GPS-heading devices that give heading to better than 0.1° accuracy. The ADCP is calibrated against bottom tracking whenever and wherever possible (see Appendix A in Chafik et al., 2014 for further details). Integrating this instrumental uncertainty over the upper 400 m and across the full distance of each section leads to a SE of the transport integrals of about 1.4, 0.94 and 1.58 Sv for the C, G and D routes, respectively. The D uncertainty is greater due only to 10 DoF at the end of the integral compared to 25 and 41 for C and G, respectively. Across the Norröna section, instrumental uncertainties are smaller, resulting in 0.2 Sv of total uncertainty.
In addition to the ADCP velocity data, a single high-resolution CTD section along the crest of the RR is used to estimate a westward geostrophic flux across the ridge.
3. Results
Proceeding east from the RR, topography varies considerably but the same general pattern applies to all three Nuka Arctica routes: first, the broad deep Iceland Basin with the Maury Channel in its centre (C and G), then the complex bank region and finally the Scottish slope, which unfortunately is rendered rather complex due to the WTR that juts west just south of the entrance to the Faroes–Shetland Channel. We now examine the mean cross-route velocity and transport integrals for each route.
3.1. The C route
Poleward flow occurs in the central Iceland Basin (~3 Sv) and along the western slope of Hatton Bank (~2 Sv) as shown in Fig. 2. There are two other concentrated flows, one near 400 km and another at the Shetland slope, both about 1.5 Sv. The integral peaks at ~9.5 Sv before decreasing to ~8.5 Sv due to southward flow along the eastern RR (Chafik et al., 2014).
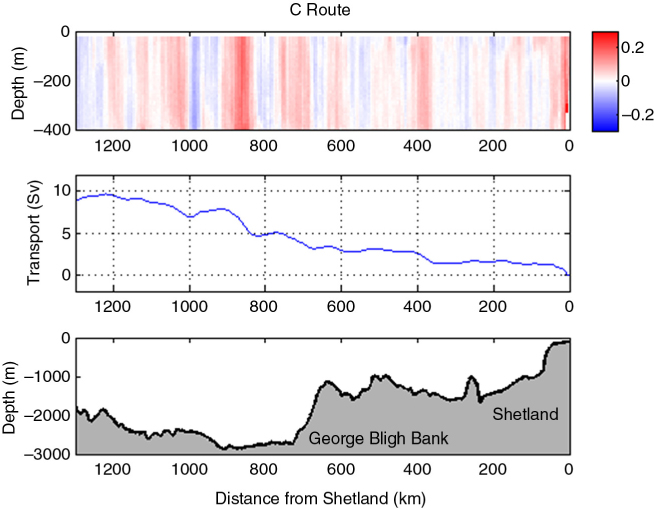
Fig. 2
Mean cross transect velocity in m s−1 (top), cumulative transport to 400 m (middle) and topography (bottom) with distance from Scotland for the C route. The section ends at the RR crest.
3.2. The G route
It starts at the Scottish slope just north of the WTR with only a gradually increasing Slope Current northward (Fig. 3). The topography of the inshore region influences the stability of the Slope Current and inshore on the shelf are some currents, which may join the Slope Current in the FSC (Burrows and Thorpe, 1999; Burrow et al., 1999), but which we do not include in the integration on the grounds that the bulk of a well-defined 400 m deep Slope Current at the C route is not likely to move up on the shelf, and then offshore again at the D route (next). Thus, the slope flow shows up here more diffuse in the first 100 km. We speculate that the WTR topography may force some of the Slope Current seen at the C line to deviate west and around the ridge. Another 2 Sv increase in transport occurs between 400 and 500 km. About 4 Sv transport takes place in the deep Iceland basin. This G integral peaks about 0.5 Sv higher than that for the C route. The close agreement lies well within expected uncertainties. This is an encouraging indication that ADCP velocities can be integrated over O (103) km distances to estimate transport (Chafik et al., 2014; Worst et al., 2014). Unlike for the C route, there is no indication of a southward flow on the eastern slope of the RR in Fig. 3; however, this is largely due to the vector orientation used. Unlike in the Knutsen et al. (2005) and Chafik et al. (2014) papers where the vectors are shown parallel to the ridge crest, the integration is taken normal to the curved route of the G section. Some southward flux along the ridge at ~1200 m is present, but it is only visible in the parallel velocity component for this section.
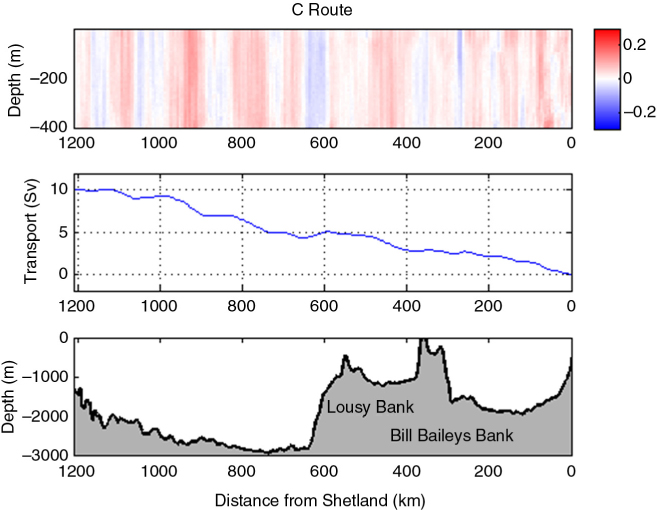
Fig. 3
Mean cross transect velocity in m s−1 (top), cumulative transport to 400 m (middle) and topography (bottom) with distance from Scotland for the Great Circle Nuka Arctica route.
3.3. The D route
Here, the Slope Current has strengthened to ~3 Sv for the Shetland Slope Current (Fig. 4). The maximum poleward flow barely reaches 8 Sv at about 600 km before decreasing somewhat towards the Iceland slope. Only 10 sections contribute to the full integral for this section so the uncertainty of integration is estimated to be 1.58 Sv. Nonetheless, the well-defined growth of the integral out to the deepest part of the basin with a slight decrease approaching Iceland is consistent with a cyclonic circulation there (e.g. Bower et al., 2002). Some of the ripples in the integral may reflect inadequate averaging, but the strong north–south flow to either side of Faroes Bank at ~260 km appears to be robust.
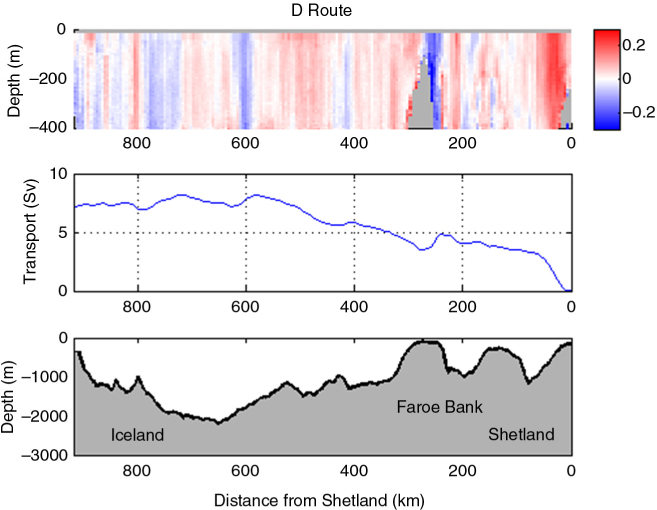
Fig. 4
Mean cross transect velocity in m s−1 (top), cumulative transport to 400 m (middle) and topography (bottom) with distance from Scotland for the Diagonal Nuka Arctica route.
3.4. The Norröna route
This route covers the inflow into the Nordic Seas between Scotland and Iceland on both sides of the Faroes Islands (Fig. 5). Here, the Slope Current has increased to 3.1 Sv in the top 400 m, but there is a southward flow on the western side of the Faroes–Shetland Channel such that the net inflow in the top 400 m is just under 2 Sv. The total transport in the top 400 m is slightly greater than that reported in Childers et al. (2014) above the 27.8 isopycnal, since the isopycnal depth is generally >400 m, resulting in an overall larger outflow through the central channel in that paper, but only a slightly higher Slope Current transport. The southward flow on the Faroes Shelf and Slope does not show up south of the FSC and is larger than moored observations from the more southerly Faire Isle Munken Line (Berx et al., 2013) suggesting that some of it, perhaps 0.5–0.7 Sv, joins the Slope Current and the rest circulates to the west, ending up south of the Faroes. Almost 6 Sv of water flows north between the Faroes and Iceland. However, some of this inflow is the source of the southward flow in the FSC. We note that there is close agreement between the nearly 1 Sv of northward transport over western Faroes Shelf and the southward flux through the western FSC perhaps flowing in a closed-loop around the Faroes, and that the additional increase over the IFR is ~4.4 Sv or slightly greater than that in the Slope Current in the top 400 m.
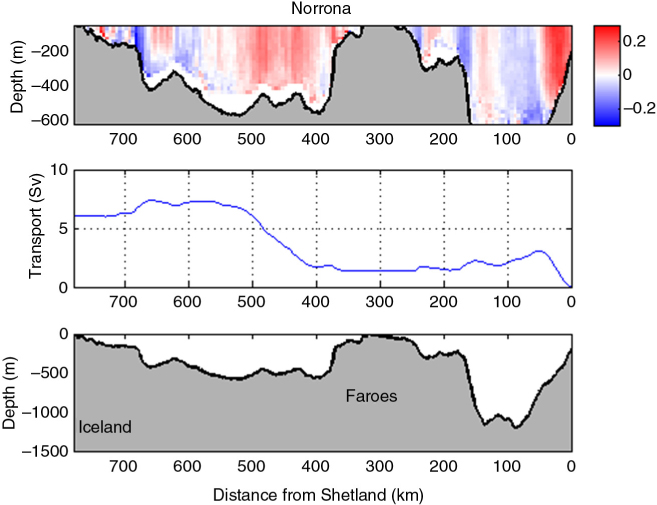
Fig. 5
Mean across transect velocity in m s−1 along the Norröna route (top), cumulative transport to 400 m (middle) and along route topography (bottom).
4. Discussion
4.1. The integrals
We are encouraged that the C and G integrals (Figs. 2 and 3) are comparable at ~8.5 and 10 Sv, respectively. That they are not closer may be due to two factors. First, the complex slope topography involving the WTR may be deflecting the Slope Current (or parts of it) around the ridge making it less well-defined (space–time variable). Exchanges with the North Sea O(0.5 Sv) also occur through the Fair Isle Gap and East of Shetland Inflows (Holt and Proctor, 2008), although their magnitude is considerably smaller than the transport different between the two sections. Second, and more important, the combined RMS uncertainty of the two integrals: √(1.422+0.942)=1.69 Sv is comparable to the difference so we might not expect much better agreement. The D integral at 7.4 Sv has the largest uncertainty (1.58 Sv), intermediate between the 10 Sv for the G route and 6 Sv for the Norröna route. While the uncertainty of the differences is substantial, the successive decrease from south to north suggests an internal consistency. Is this pattern real, and if so where does the extra water go? One possibility is leakage across the RR between Iceland and the C, G routes especially as Bower et al. (2002) noted cross-RR flow occurring through fracture zones farther south. Using AVISO altimetry, Chafik et al. (2014) noted a ~0.02 m (non-monotonic) free surface tilt between 62.5°N and 59.5°N consistent with an east-to-west cross ridge flow. This tilt along a 430 km ridge segment could balance a 0.7 Sv flow in the top 400 m, but this is putting great demands on the absolute accuracy of the altimetry.
There exists one hydrographic section taken right along the ridge crest from Iceland to the Charlie-Gibbs fracture zone. We have used this to estimate cross-ridge transport in the top 400 m relative to a likely dynamic height field at 1000 dbars. Figure 6a shows the location of the stations, and Fig. 6b shows dynamic height referenced to a linear fit to all casts that reach to 1000 dbars. The fit is also extended into shallower water as if there were no bathymetry to provide a reference for the casts that reach to 400 m and thus our control volume. Summing up all velocities inside the dashed box yields a cross-ridge transport of ~1.5 Sv. This is, to our knowledge, the only along-ridge section in existence. The transport is of the expected sign, and given the RMS uncertainty of the integrals could account for the difference in transport between C, G and D lines.
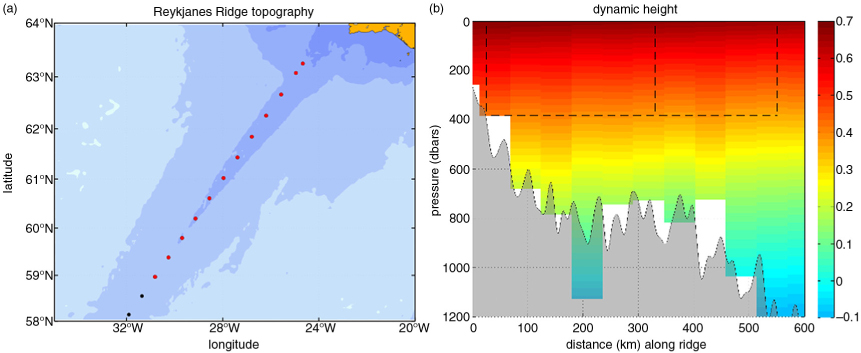
Fig. 6
(a) Locations of CTDs along the RR and (b) dynamic height relative to an estimated dynamic height at 1000 dbars using all stations that reach to the depth (in the figure and to the south). The transport through the dashed box is ~1.5 Sv. The lines at 330 and 550 km correspond to where the G and C routes cross the RR at 61°N and 59.5°N, respectively.
The 7.4–6 Sv difference in transport between D and the Norröna section is interesting. At the Iceland end, there is a southward flow from the Iceland Sea (into the control volume of ~1 Sv at 780 km along the N line, Fig. 5). The surface part of this flow turns northeast as the cold side of the Iceland–Faroes Front with the remainder continuing south across the ridge. The N-line section also shows areas at depth with southward flow. Using σt≥27.8 kg m−3 as the definition of overflow water (Hansen and Østerhus, 2000) flowing south at <400 m depth, we obtain a transport ~0.5 Sv. By definition, this water will exit our control volume as an overflow at 400 m depth. Østerhus et al. (2008) estimate that about 1 Sv overflows to the south between Iceland and the Faroes, and Childers et al. (2014) obtain a similar result. Beaird et al. (2013) suggest 0.8 Sv as a lower bound for total IFR overflow. The 0–400 m integral does not include any of the Faroes Bank Channel overflow water since it does not reach below the σt≥27.8 kg m−3 density surface (Rossby and Flagg, 2012). In summary, we have: 8.5±1.4 Sv flowing in across the C route and 6±0.5 Sv leaving across the Norröna line. We estimate 1.5 Sv exiting the control volume across the RR, and 0.5 Sv sinking below 400 m south as overflow waters south of the IFR. This leaves 0.5 Sv excess, which is small in light of the long C-route integral.
If the excess – however uncertain – is real, two possibilities come to mind. The first one is that there have been some transport changes between the Nuka Arctica (1999–2002) and Norröna (2008–2012) programmes. The Nuka Arctica programme has been restarted in 2012, and in time we should have updated information on transport along the C and G lines. The other would be wintertime cooling and mixed layer deepening throughout the region to O(500) m or more depths (Monterey and Levitus, 1997; Marshall and Schott, 1999). There is clear evidence for wintertime mixing from CTD casts in the area lending credence to the suggestion of intermediate water formation in the Iceland Basin. While this is highly speculative, it could account for the suggestive evidence of a residual systematic decrease in transport in the top 400 m from south to north. Improved observation coupled with numerical simulations could shed valuable light on these questions. Ekman pumping does not contribute to the decrease. In fact, the positive windstress curl leads to an Ekman upward vertical velocity of O(10−6) m s−1 (Isemer and Hasse, 1987).
4.2. Mapping the transport integrals
Contours derived from the transport integrals are shown on a map of the region (Fig. 7). We highlight each additional Sv (black dots) while also highlighting the 3, 6 and 9 Sv points (red dots), being mindful that especially the D integral has a greater uncertainty than the others.
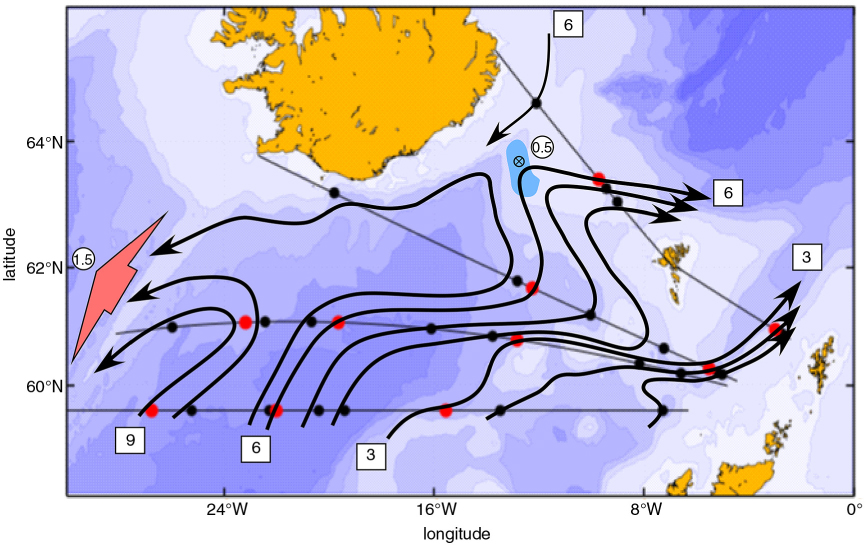
Fig. 7
Cumulative transport in Sv (beginning on the eastern side) for the C, G, D and N(orröna) routes. Black dots indicate each Sv change in cumulative transport (summing from east to west along each route) and red dots indicate each third Sv. The wide pink arrow indicates the flow across the RR and the blue area indicates schematically the loss of overflow water at 400 m depth.
Despite the temporal gap in the data from the Nuka Arctica and Norröna, the Shetland Slope Current has about the same strength in both the Nuka Arctica D line and the Norröna FSC route. In both cases, the current transports more than 3 Sv towards the Nordic Seas as a wedge-shaped flow hugging the Scottish slope. Given the tightness of the transport integrals, we are confident that the 3 Sv contour must turn sharply east from the G to the D line near the WTR, indicating that the increase in the Slope Current from C to, G to D, N is due to a flow from the west. Some support of this can be seen in fig. 24 of McCartney and Mauritzen (2001), which shows mean flow from a number of current meters in the area. However, it should be noted that the small transport east of the Rockall Plateau may also be the result of the timing of the observations, since the position of the NAC varies interannually and could directly impact the flow divergence of the poleward fluxes on the eastern side (Jakobsen et al., 2003).
5. Summary and outlook
By using all data from the Nuka Arctica crossings to Greenland and Iceland together with the Norröna data (Childers et al., 2014), we are able to expand upon the analysis of Chafik et al. (2014) to establish a mean path of AW between 59.5°N and the IFSR. All transport integrals are taken from the surface to 400 m and from the Scottish slope to either the RR in the west or Iceland in the northwest. As Fig. 7 shows the four integrals fanning out from Scotland reveal a substantial flow north along the Maury Channel and along the western Hatton Bank slope. The latter flow follows the topography east and north along the slopes of George Bligh Bank, Lousy Bank and Bill Bailey's Bank. About 2 Sv of this water reaches and adds to the flow north along the Scottish slope. The transport north in the Maury Channel appears to bifurcate with one branch turning west and south along the RR. The other branch turns east before curving northwest along the Iceland–Faroes Ridge and crossing the ridge into the Nordic Seas. The overall decrease in transport in the top 400 m from 59.5°N to the IFSR suggests a leakage of ~1.5 Sv across the RR into the Irminger Sea, and a loss due to the overflow to greater depths of dense waters from the Nordic Seas.
Thus, we can determine transport at all using vessel-mounted ADCPs is due to the repeat sections that reduce the natural variability and the GPS attitude (compass) instrument that allows us to determine and remove vessel speed and heading such that we know water velocity at the O(0.01) m s−1 accuracy. The result is that we can through repeat sampling using these two vessels in regular service, the Nuka Arctica and the Norröna, integrate velocity over O(103) km distances and obtain mean transport to 1–1.5 Sv uncertainty. The consistency of the integrals suggests robustness to the findings. Both vessels continue to operate an ADCP (both 75 kHz), and as the database grows the integrals will increase in accuracy, and we will be able to examine interannual variability in greater detail.
6. Acknowledgements
The authors express their sincere thanks to the Royal Arctic Line Ltd for enabling the ADCP measurement programme to take place on the Nuka Arctica. Financial support for the field work came from the Norwegian Research Council, the Wallenberg Foundation, the Fisheries Laboratory of the Faroes Islands, the Danish Meteorological Institute, the University of Stockholm, the University of Bergen and Dean M. Leinen of the Graduate School of Oceanography at the University of Rhode Island. CS thanks the Lauritz Meltzer University Foundation for a grant to reprocess and archive all the original data, an activity that was expertly handled by Ms. S. Anderson-Fontana. We thank Capt. Jógvan i Dávastovu of the Smyril Line for his and Smyril Line's support and encouragement for the continuing Norröna project. S. Anderson-Fontana handled the excellent support and processing of the Norröna ADCP data. The National Science Foundation has supported the Norröna programme through grants 04552274 and 1060752 to Stony Brook University and through grants 0452970 and 1061185 to the University of Rhode Island.