
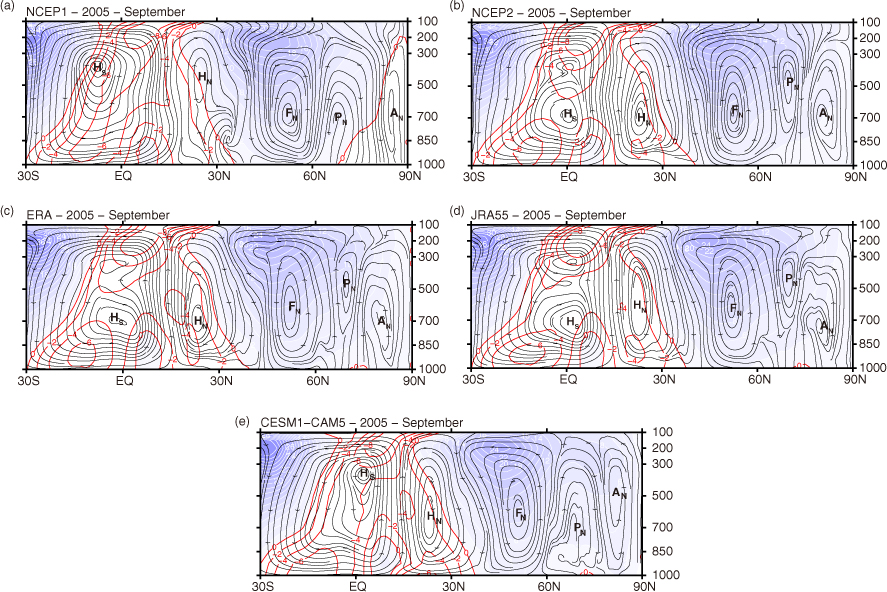
Fig. 1
Five zonally averaged meridional cells described by the vertical–latitude sections of streamline and westerly (shading, 2 m s−1 interval) or easterly (red line, 2 m s−1 interval) velocities calculated in September 2005 using the monthly-mean (a) NCEP R1, (b) NCEP R2, (c) ERA Interim, (d) JRA-55 and (e) CESM1-CAM5. Symbols of HN, FN, PN and AN indicate the Hadley, Ferrel, Polar and Arctic cells in the Northern Hemisphere, while HS indicates the Hadley cell in the Southern Hemisphere.
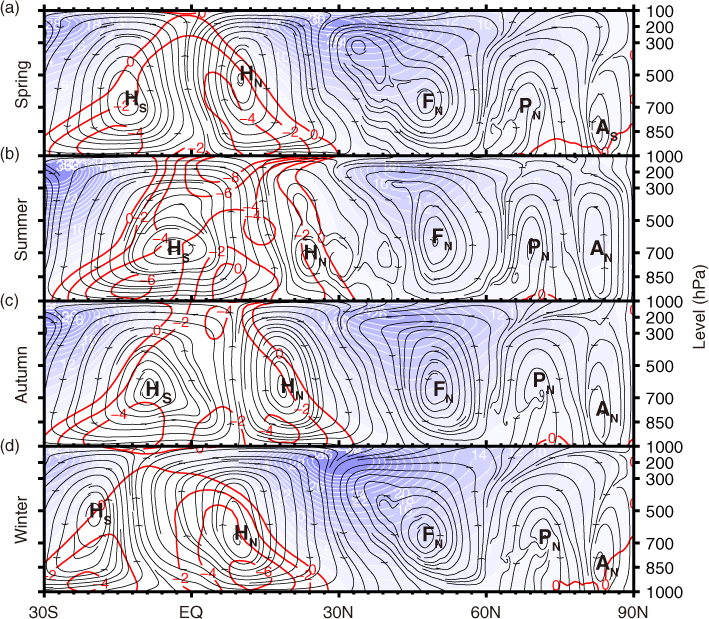
Fig. 2
Five zonally averaged meridional cells described by the vertical-latitude sections of climatic seasonal-mean streamline and westerly (shading, 2 m s−1 interval) or easterly (red line, 2 m s−1 interval) wind velocities averaged over 30 yr (1981–2010) using the ERA-Interim reanalysis product in the boreal (a) spring, (b) summer, (c) autumn and (d) winter.
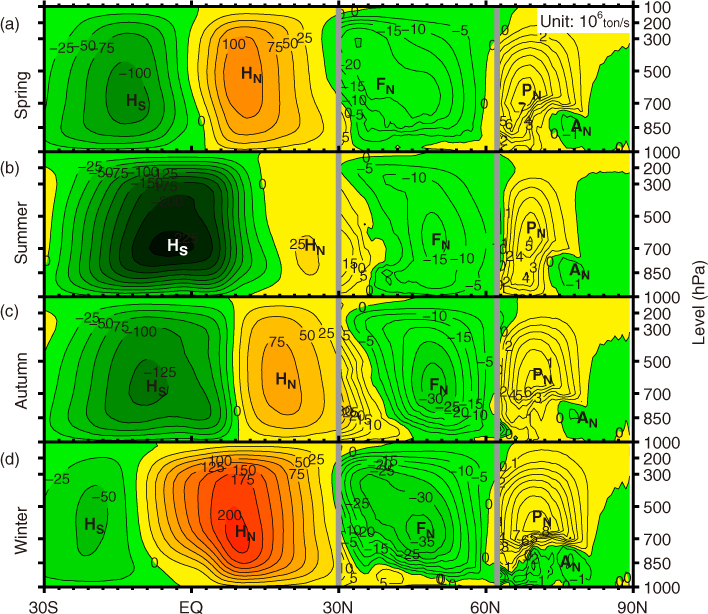
Fig. 3
Five zonally averaged meridional cells described by the vertical-latitude section of climatic seasonal-mean MSFs (yellow-red shading for positive and green shading for negative) averaged over 30 yr (1981–2010) by the ERA Interim reanalysis product in the boreal (a) spring, (b) summer, (c) autumn and (d) winter. The MSF interval is 25×106 ton s−1 between 30°S and 30°N, 5×10⁶ ton s−1 between 30 and 62.25°N and 1×10⁶ ton s−1 between 62.25 and 90°N. Symbols of HN, FN, PN and AN indicate the Hadley, Ferrel, Polar and Arctic cells in the Northern Hemisphere, while HS indicates the Hadley cell in the Southern Hemisphere.
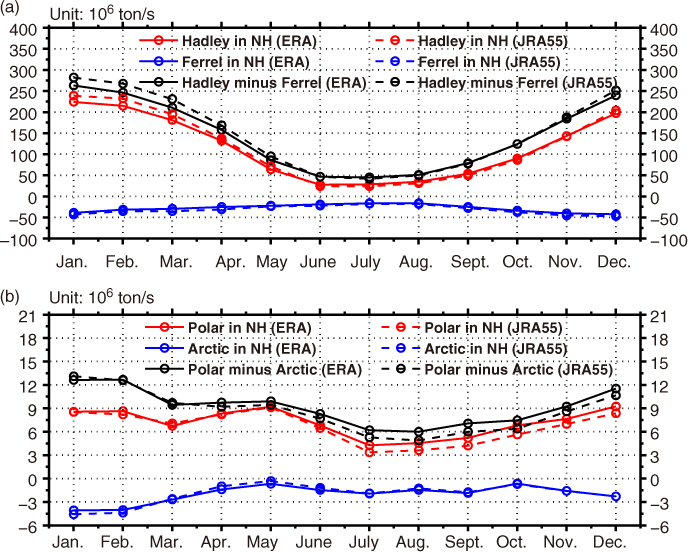
Fig. 4
Monthly-mean intensities of the four cells in the Northern Hemisphere. The MSF intensities (red and blue lines, 106 ton s−1) of (a) the Hadley and Ferrel cells and their differences (black line, 106 ton s−1) based on ERA and JRA55 reanalysis products; (b) same as (a) but for the Polar and Arctic cells.
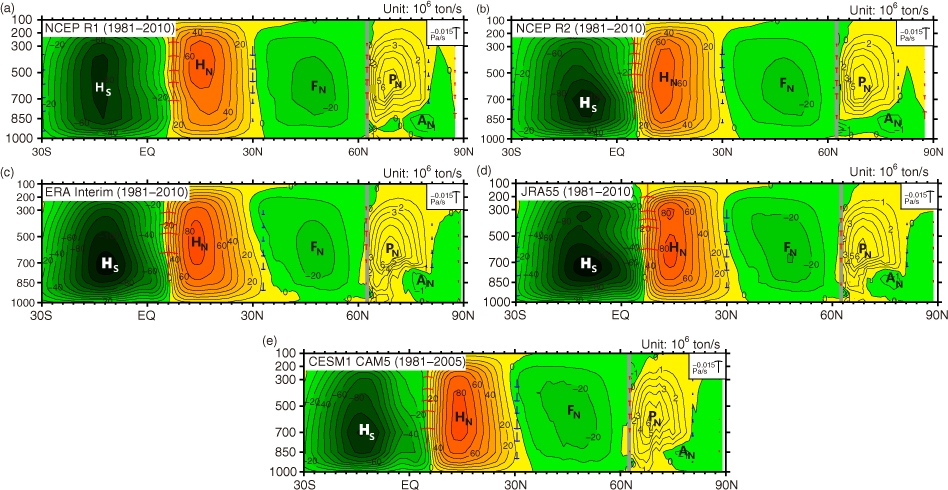
Fig. 5
Same as Fig. 3 except the climatic annual-mean MSFs (106 ton s−1) averaged over 30 yr (1981–2010) were calculated by the four reanalysis products of (a) NCEP R1, (b) NCEP R2, (c) ERA Interim, (d) JRA55 and (e) the ensemble mean data of three CESM1 CAM5 historical runs over 25 yr (1981–2005), respectively. Red and blue arrows indicate ascending and descending pressure velocities (−0.015 Pa s−1), respectively.
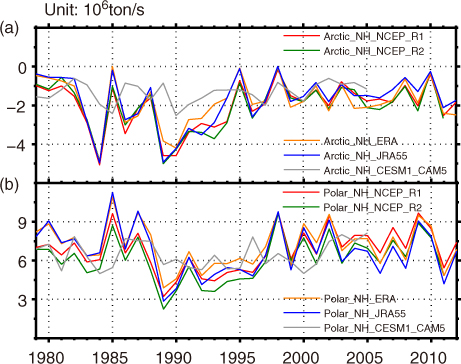
Fig. 6
Annual-mean central MSF intensity series of Polar and Arctic cells from 1979 to 2012. The intensity (106 ton s−1) series of (a) the Polar cell and (b) the Arctic cell were calculated with annual-mean MSF from the four reanalysis products (NCEP R1, NCEP R2, ERA Interim, and JRA55) and the ensemble mean of three historical runs (CESM1 CAM5).
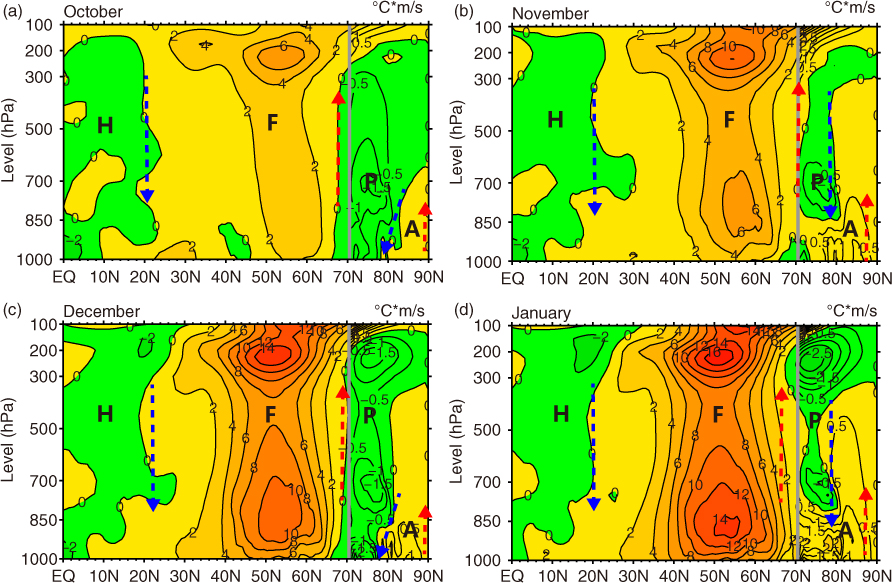
Fig. 7
Northward eddy heat flux (, yellow-red shading for positive and green for negative, 2°C m s−1 interval in mid-low latitudes and 0.5°C m s−1 interval in the Arctic) calculated from a 30-yr (1981–2010) average of ERA Interim reanalysis product in the Northern Hemisphere in (a) October, (b) November, (c) December, and (d) January. Letters H, F, P and A are central locations of the Hadley, Ferrel, Polar and Arctic cells, respectively. From ‘H’ to ‘F' −<0, i.e. , so there is a descending branch flow (blue dashed arrow) between them while from ‘F’ to ‘P’ there is an ascending branch flow (red dashed arrow).
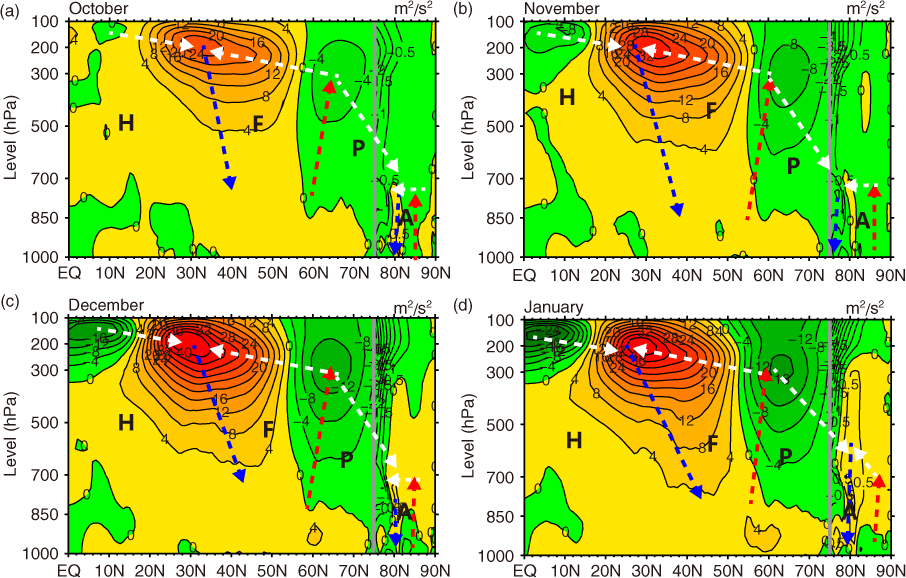
Fig. 8
Same as in Fig. 7 except of the northward eddy momentum flux ((yellow-red shading for positive and green for negative, 4 m2s−2 interval in mid-low latitudes and 0.5 m2s−2 interval in the Arctic) calculated from a 30-yr (1981–2010) average of ERA Interim reanalysis in the Northern Hemisphere in (a) October, (b) November, (c) December, and (d) January. From an ascending flow (red dashed arrow) to a descending flow (blue dashed arrow), >0, i.e. , so there is a southerly wind component (white dashed arrow) otherwise a northerly wind component.
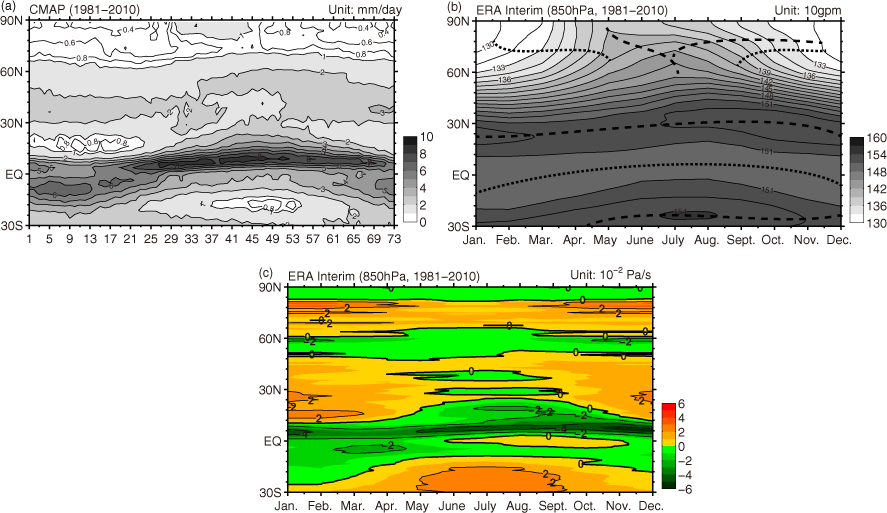
Fig. 9
Meridional (30°S–90°N) and time sections of (a) climatic pentad (1–73) precipitation (grey shading, 1 mm d−1 interval) using the enhanced CMAP dataset, (b) monthly-mean geopotential height (grey shading, 30 gpm interval) and (c) vertical pressure velocity (yellow-red for positive and green for negative, 1×10⁻² Pa s−1 interval) at 850 hPa using the ERA-Interim reanalysis product averaged over 30-yr (1981–2010). Low precipitation rate (<1 mm d−1) along the sub-polar zone separates two high precipitation (>1 mm d−1) zones, respectively, in the Arctic and middle latitudes (a). Three height ridges (dashed line) separate a low-pressure centre in the Arctic and two height troughs (dotted line), respectively, in the equator and middle latitudes (b). Two major descending flow zones (red shading) in the sub-polar and the sub-tropical regions separate three ascending flow zones (green shading) in the Arctic, middle latitudes and tropical regions, respectively (c).
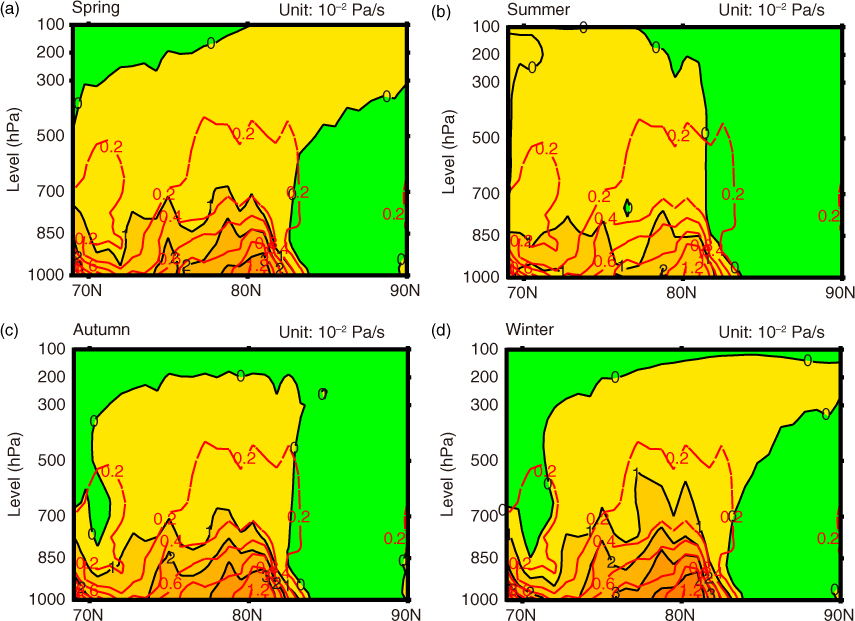
Fig. 10
Climatic seasonal-mean vertical velocity. Vertical and meridional sections of zonally averaged descending (yellow) and ascending (green) pressure velocities (solid line, 1×10⁻² Pa s−1 interval) and standard deviation (red dashed line, 0.2×10⁻² Pa s−1 interval) between 69 and 90°N and from 100 to 1000 hPa in the boreal (a) spring, (b) summer, (c) autumn and (d) winter using a 30-yr average (1981–2010) of the ERA-Interim reanalysis product.
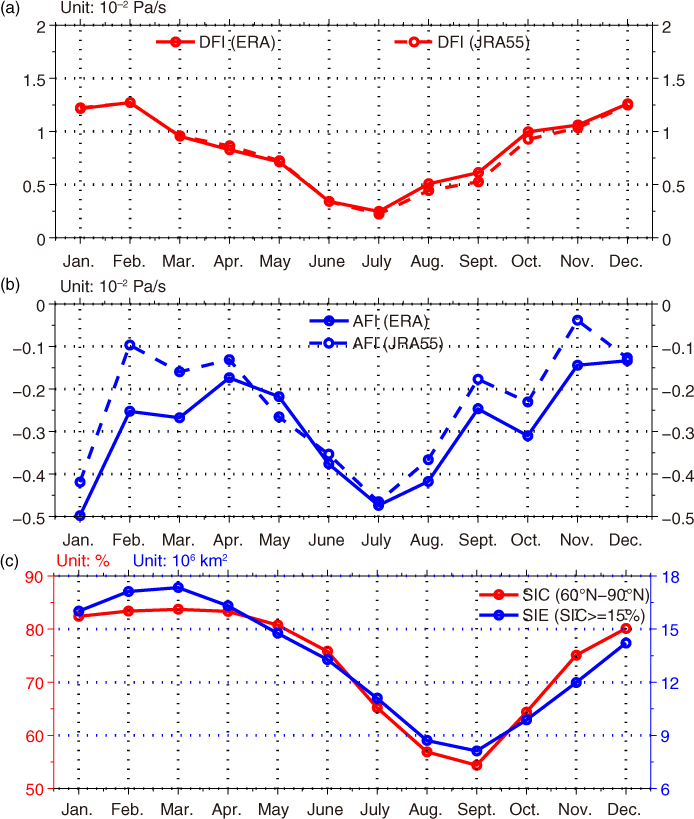
Fig. 11
Seasonal series of (a) the monthly-mean descending flow intensity (DFI) (10−2 Pa s−1) averaged over 500–850 hPa from 75 to 83°N based on ERA and JRA55 reanalysis products, (b) the monthly-mean ascending intensity (AFI) averaged over 500–850 hPa from 85 to 90°N, and (c) sea ice concentration (SIC,%) and sea ice extent (SIE, the area of sea ice with SIC > 15%,106 km2) averaged over the latitude band of 60–90°N based on the HadISST dataset.
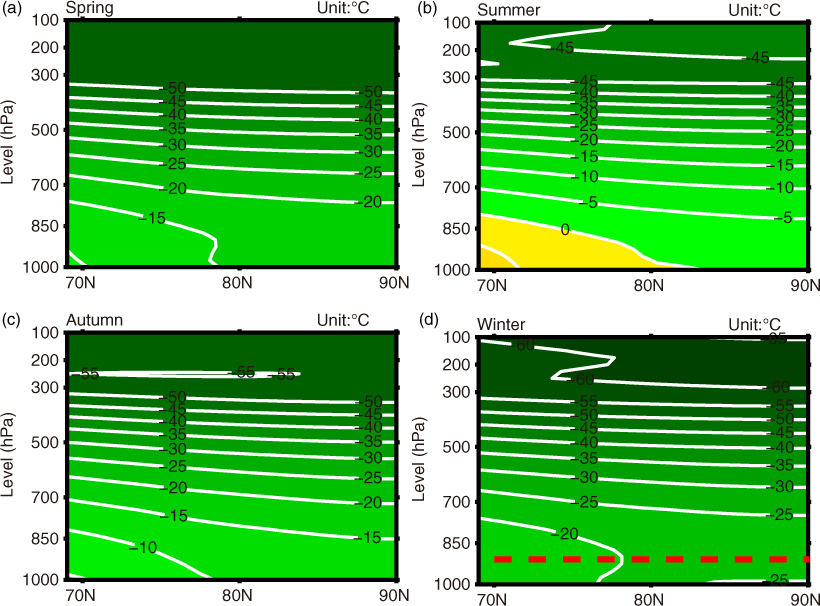
Fig. 12
Vertical and meridional sections of zonally averaged climatic seasonal-mean temperature (5°C interval) between 69 and 90°N and from 100 to 1000 hPa in the boreal (a) spring, (b) summer, (c) autumn and (d) winter using a 30-yr average (1981–2010) of the ERA-Interim reanalysis product. In (d), below the red dashed line (925 hPa) is the temperature inversion layer.
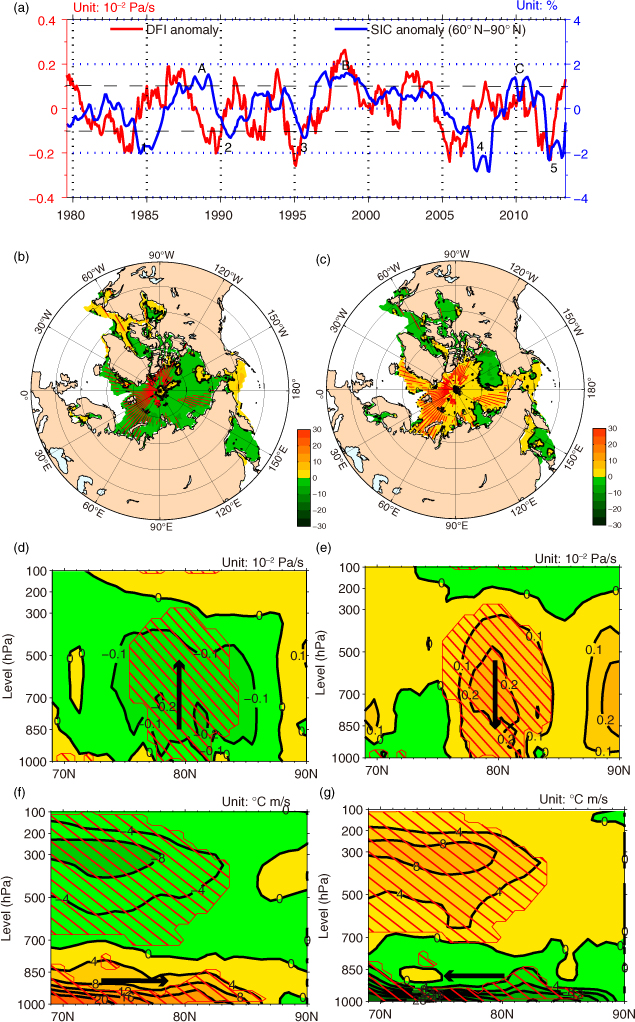
Fig. 13
DFI and SIC anomalies from time series to spatial distributions. (a) Monthly-mean time series of the DFI anomalies (red line, 10−2 Pa s−1) and the SIC anomalies (blue line,%) averaged over the latitude band of 60–90°N after removing their linear trends from 1979 to 2013 and calculating the 15-month running mean; (b) Composite average of SIC anomalies (yellow-red shading for positive and green for negative, 5% interval) by five warm cases with 15 consecutive months centred in January 1985, September 1990, September 1995, September 2007, and September 2012; Same as (b) but for (c) three cold cases centred in October 1988, June 1998, and April 2010; (d) Composite average of DFI anomalies (yellow as descending, green as ascending, 0.1×10⁻² Pa s−1 interval) with 15 consecutive months centred in July 1983, June 1989, December 1994, December 2005, and January 2012; Same as (d) but for (e) three descending flow anomalies centred in January 1987, April 1998, and February 2010; (f) same as (d) but for composite average of meridional temperature advection anomaly (yellow as warm advection, green as cold advection, 4°C m s−1 interval); (g) same as (f) but for three periods in (e). In (a), the numbers denote five warm events while the capital letters (A, B and C) are three cold events. In (d) and (e), the arrows indicate the anomalous ascending and descending flows, respectively. In (g) and (f), the arrows indicate the anomalous warm and cold advection, respectively. The red-lined area in the last six panels covers the region reaching the 95% confidence level.