
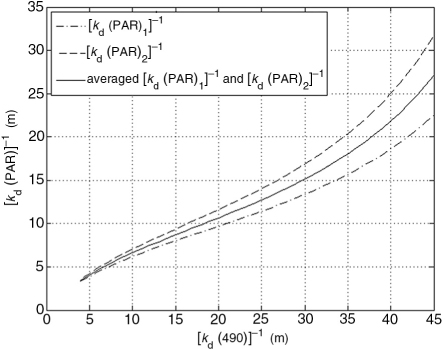
Fig. 1
The relationship of attenuation depth (m) at 490 nm and different estimates of depth of photosynthetically active radiation (PAR).
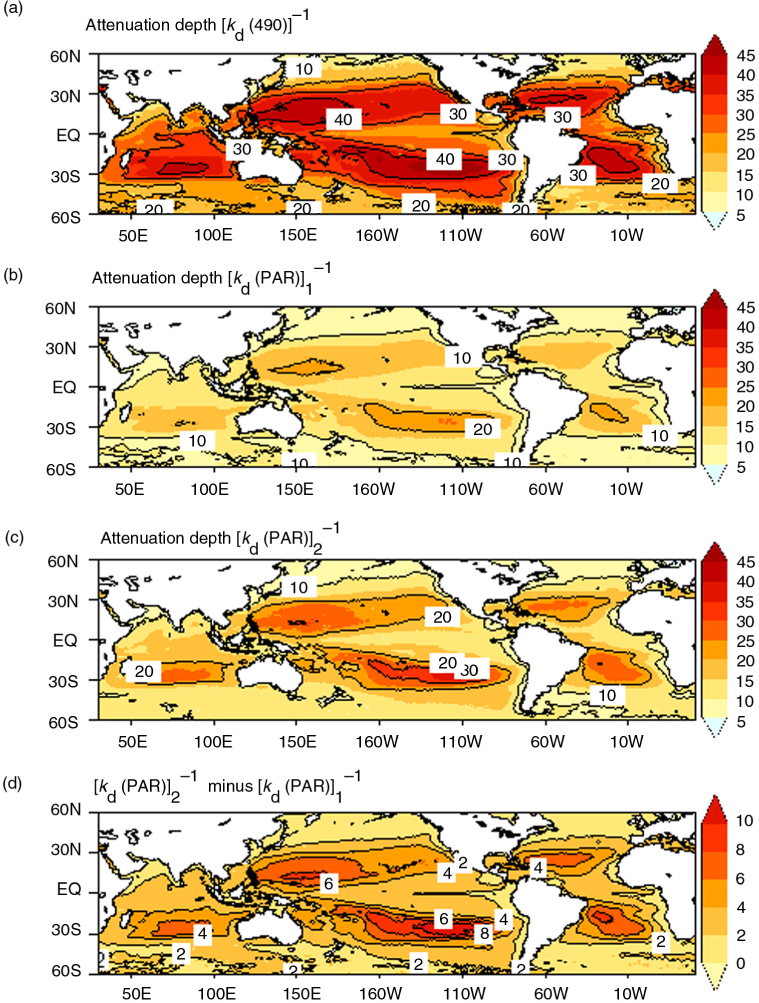
Fig. 2
Attenuation depths (m) for 490 nm (a), (b) and (c) estimated from SeaWiFS during the period of 1997–2010 and (d) is the differences between and .
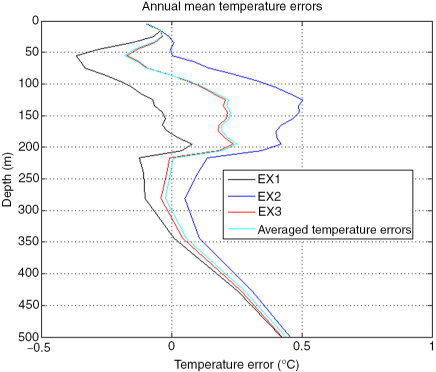
Fig. 3
The mean temperature errors (°C) averaged zonally within 30°S–30°N for EX1 (blue), EX2 (black), EX3 (red) and the mean temperature of both EX1 and EX2 (cyan).
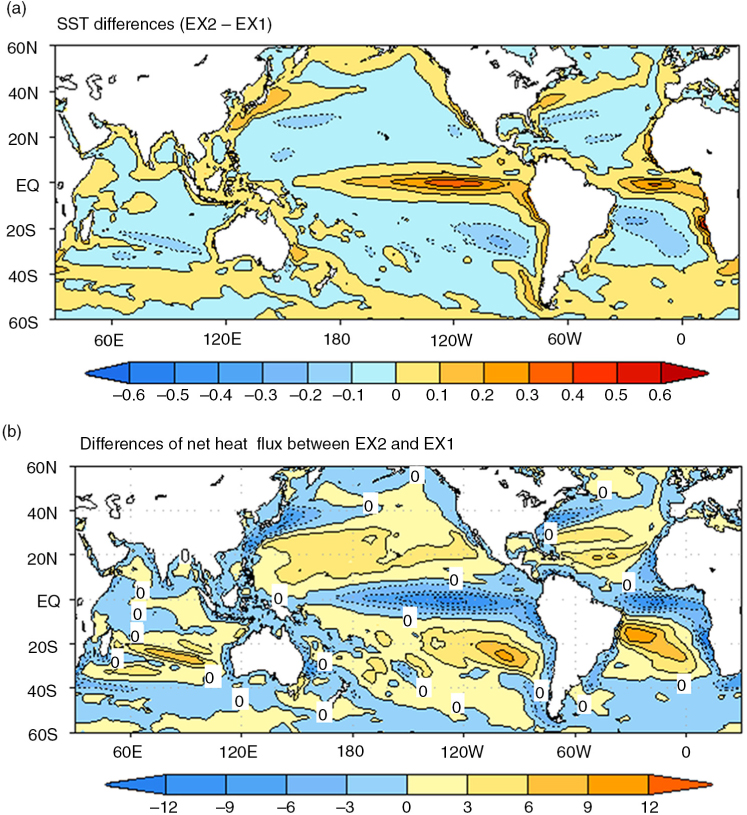
Fig. 4
The differences of annual mean SST (°C) (a) and net heat fluxes (w/m2) (b) between EX1 and EX2.
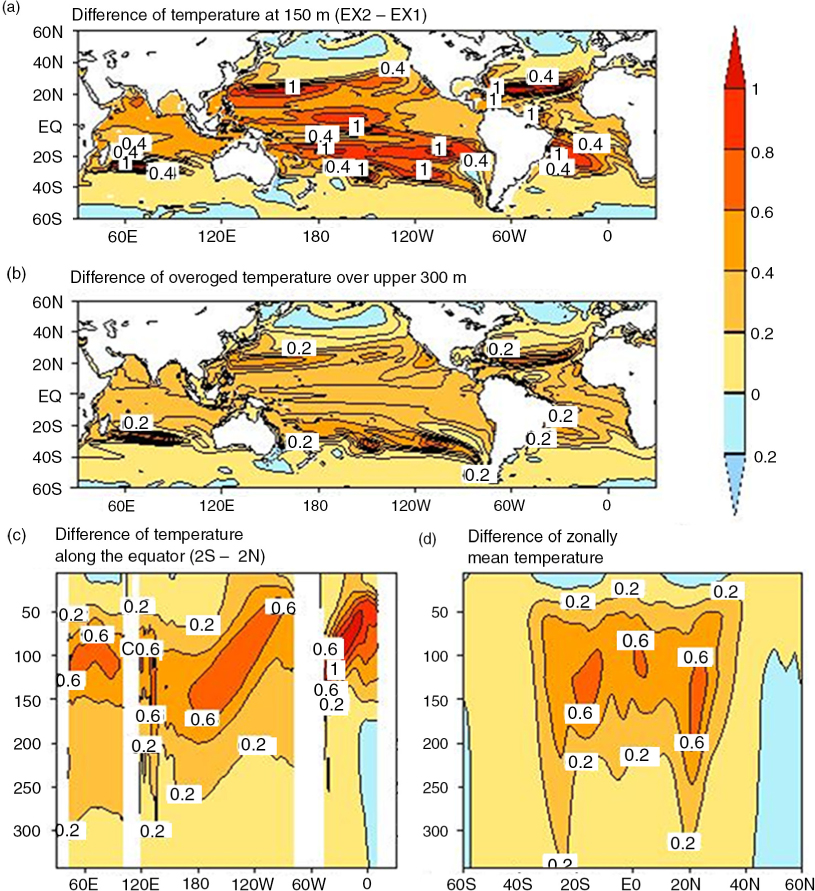
Fig. 5
The differences of annual mean temperature (°C) at 150 m (a); over upper 300-m oceans (b); along the equator (c) and zonal mean (d).
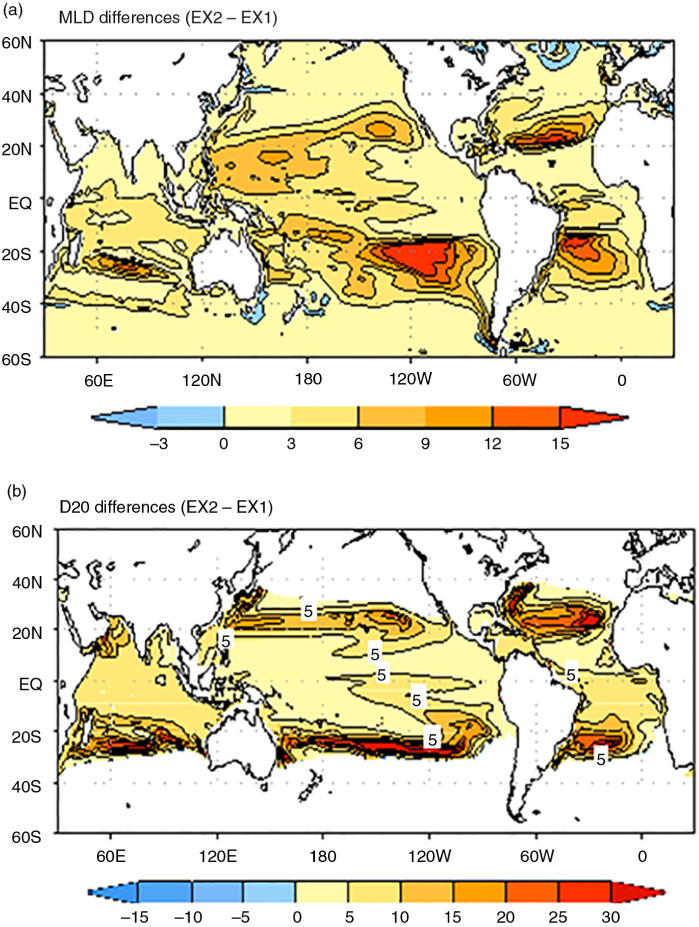
Fig. 6
The differences of mixed layer depth (a) and the 20° isotherm depth (b) between EX1 and EX2 (unit: m).
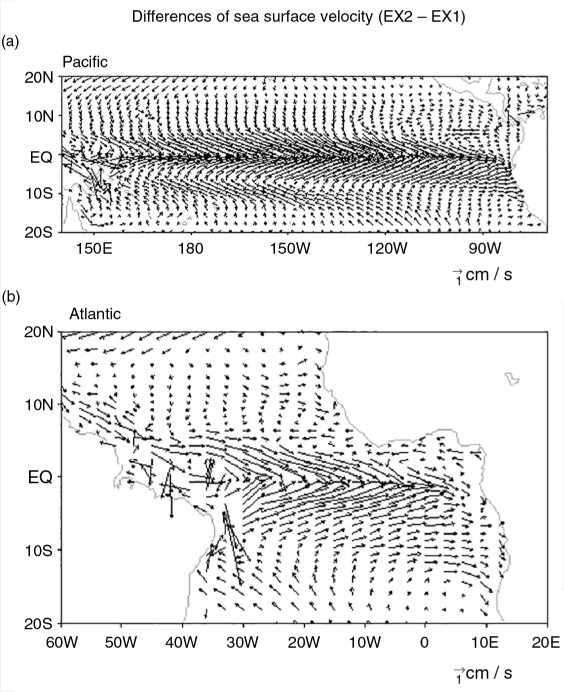
Fig. 7
Differences of sea surface velocity (cm/s) in the Pacific (a) and Atlantic (b) between EX1 and EX2.
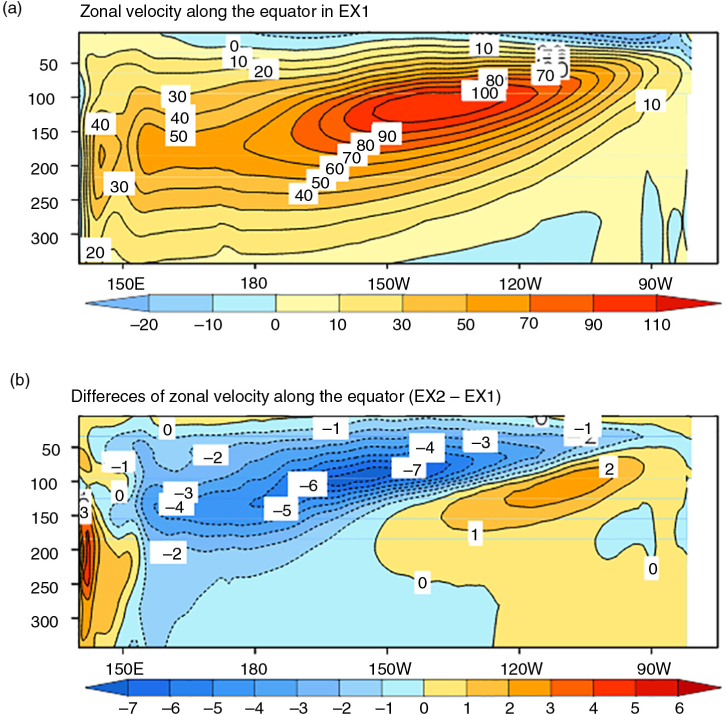
Fig. 8
(a) Annual mean zonal velocity (cm/s) along the equator in EX1 and the differences between EX1 and EX2 (b).
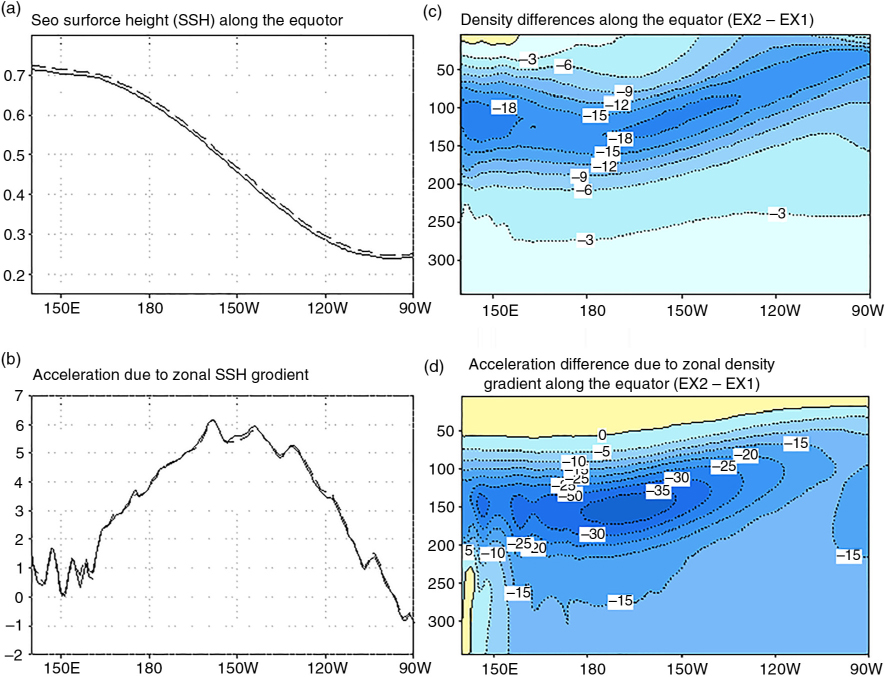
Fig. 9
(a) Annual mean sea surface height (m) (SSH) along the equator in EX1 (solid) and EX2 (dashed). (b) Same as (a) but with (10−7 m s−2). (c) The differences of annual mean density (10−2 kg m−3) along the equator between EX2 and EX1. (d) Same as (c) but with (10−7 m s−2).
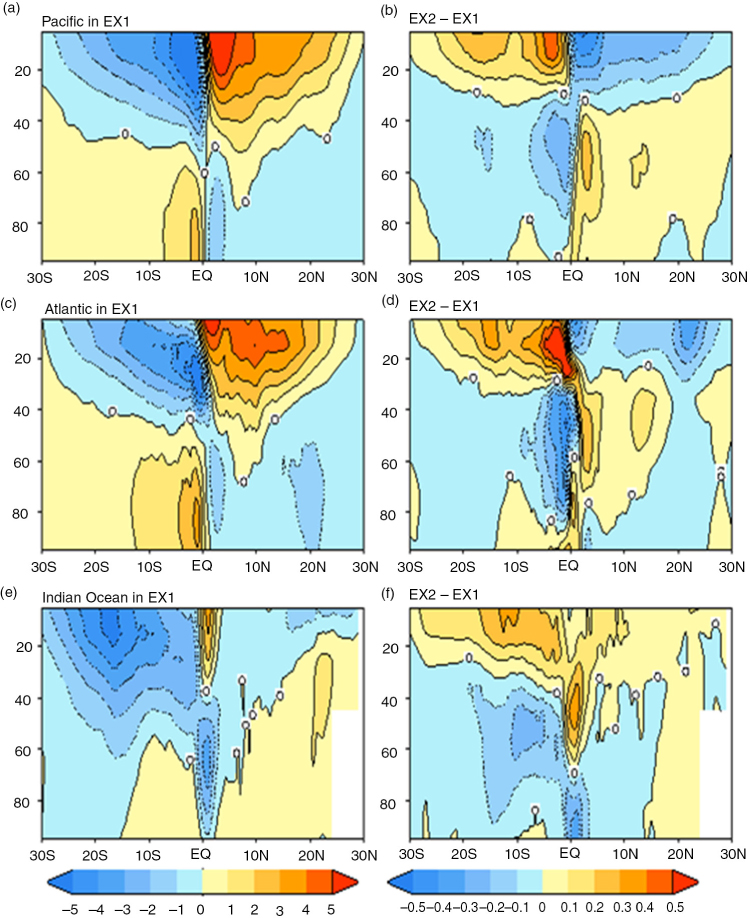
Fig. 10
(a) Annual mean meridional velocity zonally averaged in the Pacific (a), Atlantic (c) and the Indian Ocean (e) in EX1 in the left panel and their corresponding differences between EX1 and EX2 in (b)(d)(f) in the right panel (unit: cm/s).
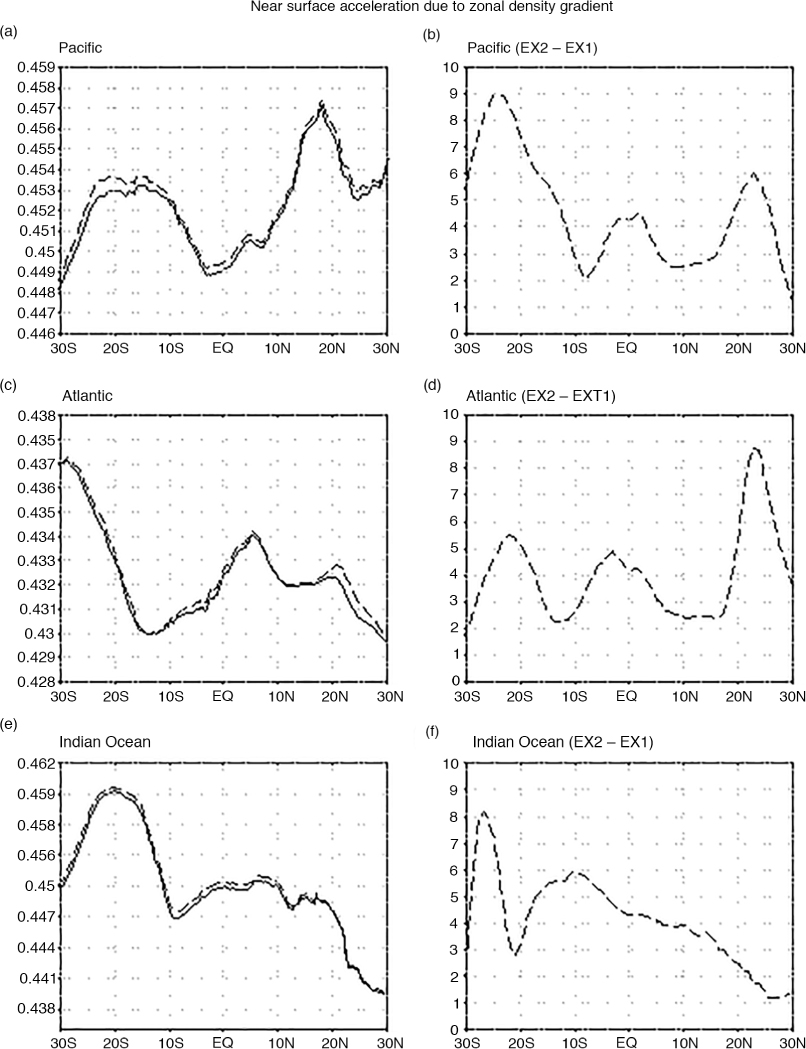
Fig. 11
Zonally averaged acceleration (10−3 m s−2) for EX1 and EX2 in the Pacific (a), Atlantic (c), Indian Ocean (e) and their differences (b, d, f, unit: 10−7 m s−2).
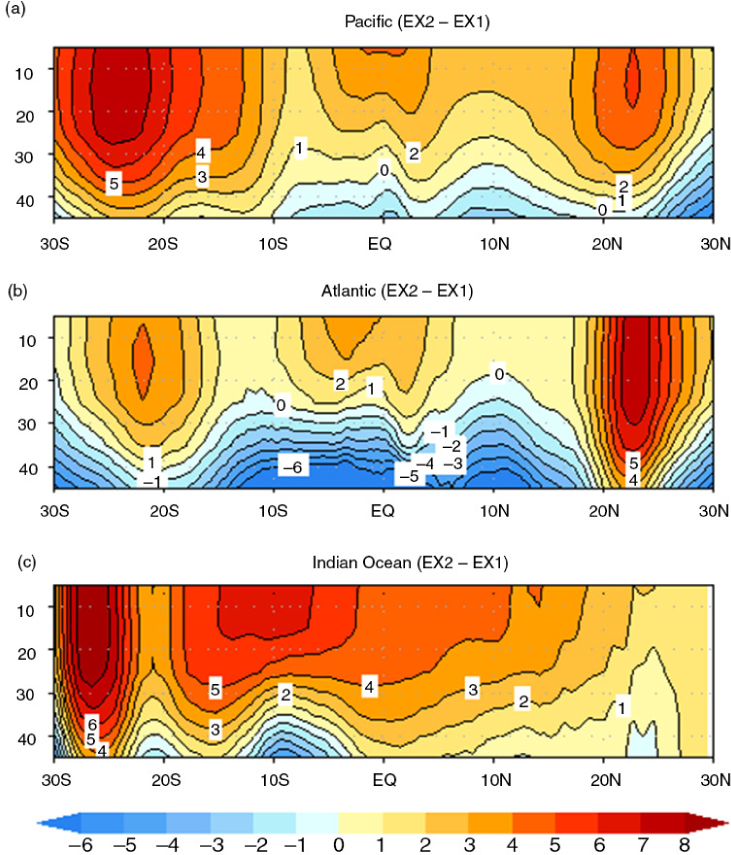
Fig. 12
The differences of zonally averaged acceleration (10−7 m s−2) between EX2 and EX1 in the Pacific (a), Atlantic (b), Indian Ocean (c).
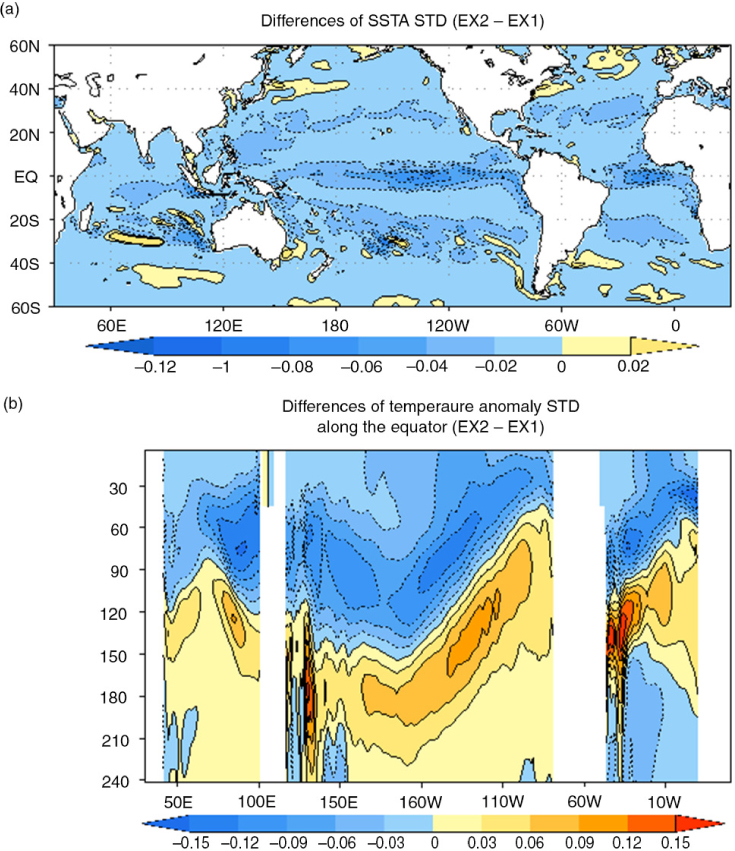
Fig. 13
Differences of SSTA standard deviation (a) and temperature anomaly standard deviation (b) along the equator between EX1 and EX2.
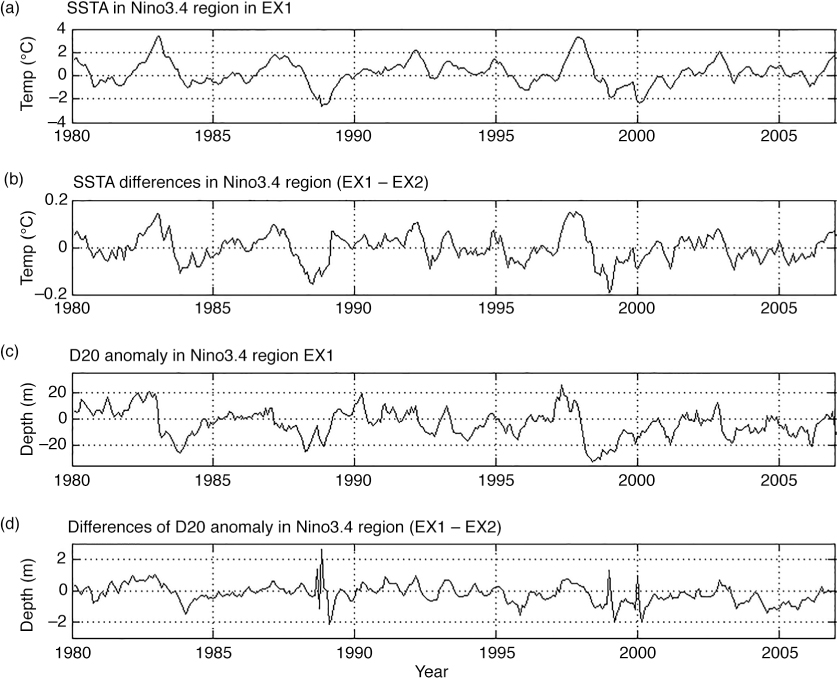
Fig. 14
The time evolutions of SSTA (a) and 20°C isotherm depth (c) in Ñino3.4 region and the differences between EX1 and EX2 (b, d) from 1980 to 2007 (unit: °C for temperature and m for D20).