
1. Introduction
Snowstorms are common in winter over ice-free, high-latitude seas and lakes. They are usually associated with cold-air outbreaks over a warmer water surface. An unstable boundary layer is formed over the lake or sea, and the turbulent fluxes of sensible and latent heat from the surface are large, which generates shallow convection that induces convective precipitation. Over an open sea, this convection typically produces two structures: cellular convection or horizontal convective rolls (e.g. Kuo, 1963; Miura, 1986; Shirer, 1986; Schultz et al., 2004), depending on the atmospheric stability, the vertical shear and the horizontal wind. In contrast to the open sea, constrained water bodies take on a greater variety of structures near land. Niziol et al. (1995) found five types of snow band structures formed over the Great Lakes. Type I are wind-parallel bands that develop when the prevailing wind is parallel to the long axis of the lake, which enhances the development of a strong convergence zone over the lake, resulting in a 50–200 km long snow band. Type II are also wind-parallel snow bands that form when winds cross a shorter fetch of the lake (perpendicular to the axis). Type III are a hybrid between I and II. Type IV are also called shore-parallel bands, and result from a land-breeze generated in a very cold environment with a mesoscale vortex. Type V are associated with a mesoscale vortex. Laird et al. (2003a, 2003b) identified three common snow band morphologies in numerical investigations, which were associated with vortices, widespread coverage and shoreline bands.
Snow-band events develop basically in response to cold-air outbreaks that cross a warmer water. The air–water temperature difference is the most important forcing mechanism for snow bands (Lavoie, 1972). Besides this sea-air thermal difference, the formation of snow bands may be supported by various factors, among them land-breeze cells formed as a consequence of the large thermal differences between the sea/lake and land (Passarelli and Braham, 1981; Simpson, 1994; Savijärvi, 2012). Heavy precipitation events related to snow bands are commonly called lake-effect snow storms, which have been studied extensively over the North American Great Lakes by many authors (e.g. Peace and Skyes, 1966; Passarelli and Braham, 1981; Hjelmfelt, 1990), and over the Great Salt Lake (e.g. Steenburgh et al., 2000; Onton and Steenburgh, 2001; Steenburgh and Onton, 2001). Outbreaks from inland to the open sea have been detected and studied along the New England coast (Bosart, 1975), off the north coast of Germany (Pike, 1990), over the Sea of Japan (Nagata, 1987), as well as over the English Channel and the Irish Sea (Norris et al., 2012). These last authors performed mesoscale numerical experiments, concluding that the studied snow bands are a response to surface heating of cold-air advection over relatively warm water, and that the role of orography and roughness length differences between sea and land affect only the timing and location of the snow bands, but not their occurrence.
Snow bands formed by cold-air advection are also associated with strong winds. In the Baltic Sea, Andersson and Nilsson (1990) determined that snow bands are formed when wind speed is higher than 10 m s−1. In some idealised experiments in Lake Michigan, Hjelmfelt (1990) found that if wind velocities were around 10 m s−1, several bands appeared within all ranges of temperatures. However, when wind speed is lower, bands only occurred within a certain range of temperatures. Moreover, Alestalo and Savijärvi (1987) simulated a single band when wind speed was higher than 10 m s−1. Norris et al. (2012) found winds greater than 10 m s−1 in the investigation of the snow bands over the English Channel and Irish Sea.
The ratio between the wind speed (V) and the fetch over the open water (L) was used to determine the lake-effect for idealised cases (Laird et al., 2003a). These authors found that when V/L is between 0.02 and 0.09 m s−1 km−1, bands are formed.
In our study region, the Baltic Sea (Figs. 1 and 2), cold-air outbreaks over the partly ice-covered sea have been studied by Andersson and Gustafsson (1994), Gustafsson et al. (1998), and Vihma and Brummer (2002). Savijärvi (2012) applied a 2D numerical model for an idealised study over the sea gulf, and concluded that a cold-air outbreak along an ice-free gulf leads to a strong heat transfer from the sea, maintaining a land-breeze circulation over both coastlines of the gulf, and contributing to a double low-level-jet (LLJ) structure. He proposed that the collision of two land-breeze cells from nearby, opposing shores is the main trigger of along-shore snow bands in calm weather. In addition, Savijärvi (2012) suggested that this mechanism caused the snow band recorded between the Estonian and Finnish coasts in January 2006 over the Gulf of Finland, as well as the Gävle snow band that hit the Swedish coast in December 1998 being caused by this mechanism. However, a full 3D numerical study of such snow bands over the Gulf of Finland has not been performed yet.
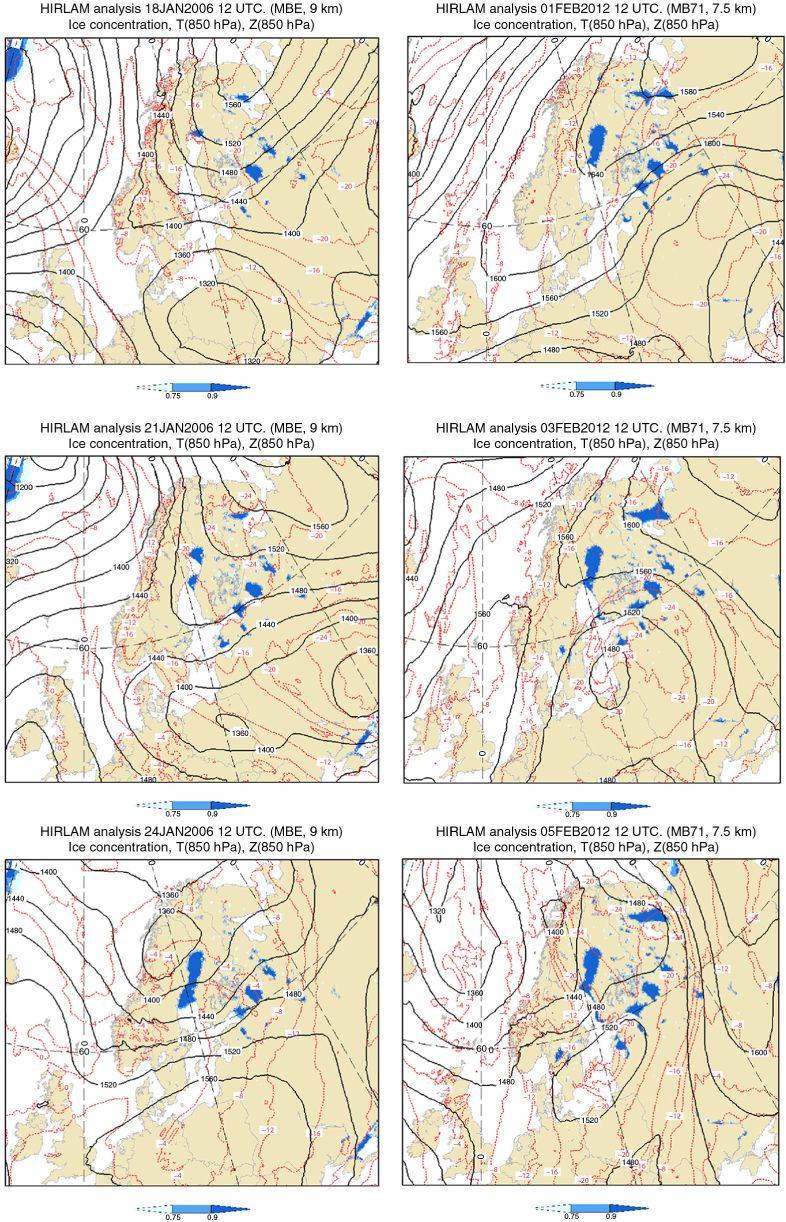
Fig. 1
HIRLAM analysis of sea/lake ice concentration (blue colour codes, in percentage), 850-hPa temperature (red lines, in °C) and the geopotential height at 850 hPa (black lines, in m) at the beginning (upper panel), middle (central panel) and at the end (lower panel) for the (left column) 2006 and (right column) 2012 events.
In summary, wind speed, the open water fetch, the shape of the coastline, and land breeze cells affect the formation of snow bands during cold-air outbreaks, and they are at least qualitatively recognised on the basis of previous observations and model experiments. What has remained poorly known is the interaction and relative importance of these processes in different conditions with respect to the synoptic-scale flow, air–sea temperature difference, and orography. Among others, previous studies have not addressed the evolution of snow bands when the large-scale wind changes from an along-gulf to an across-gulf direction. Due to the complexity of processes, cases of coastal snowstorms are still a challenge in operational weather forecasting. The need for better forecasts is high, as coastal snowstorms have caused major traffic accidents (Niemelä, 2012).
In this paper, we focus on two snow-band events over the Gulf of Finland with the objective of better understanding the physical processes involved. The first event occurred on 15–22 January 2006, and the second one on 1–4 February 2012. The two chosen cases are the clearest examples out of many. The 2012 case was particularly destructive with multiple car accidents, and the 2006 case lasted for several days, which is uncommon. In Section 2 we describe the synoptic situation of both episodes, and in Section 3 we describe the set-up of the Weather Research and Forecasting (WRF, Skamarock et al., 2008) model, which we apply in Sections 4 and 5 to simulate the two events. Conclusions are drawn in Section 6.
2. Synoptic situation
The operational HIRLAM analysis from the Finish Meteorological Institute (FMI) is used to determine the synoptic conditions for both events. Figure 1 shows the sea/lake ice concentration, the 850-hPa temperature and the geopotential height at 850 hPa in the beginning, middle and at the end of each event.
The initial conditions during both snow-band events were quite similar. A quasi-stationary high-pressure area was located over the Barents Sea, favouring easterly flow conditions over the Gulf of Finland. Consequently, a cold air mass from north-western Russia is advected towards the gulf. In the middle of the events the two cases began to differ. During the 2006 event, the difference between the sea surface temperature and 850 hPa temperature is about 20°, whereas it was larger for the 2012 event (around 25°C), indicating even more favourable conditions for convective activity. Furthermore, during the 2006 event the basic flow direction remained close to easterly, whereas during the 2012 event the wind turned southeasterly. At the end of both events, a low pressure system started to approach from the north–west, causing a westerly flow and an associated warm advection, which led to less favourable conditions for convection to occur. Moreover, it is evident that in both events snow bands occurred under high values of sea-level pressure (especially during the 2012 event, with 1040–1050 hPa; during the 2006 event with 1030–1040 hPa). In both events sea ice was present only in the eastern part of the Gulf of Finland.
3. WRF set-up
Version 3.3 of the WRF model was used to simulate the snow-band events over the Gulf of Finland on February 2012 and January 2006. Two nested domains were defined with 9 and 3 km of horizontal grid spacing in both events, having 130×130 and 151×151 points (see Fig. 2b and c). In order to identify the most suitable resolution, WRF simulations with 3 and 2 km of horizontal resolution have been compared (not shown). No significant differences were observed between these simulations and 3 km was selected for the horizontal resolution of the smallest domain.
The simulation in the 2006 event started on 15 January 2006 at 0000 UTC and runs for 192 hours; in the 2012 case the simulation started on 1 February 2012 at 0000 UTC and lasted for 90 hours. In both cases, the boundary conditions were updated every 6 hours by using ECMWF operational analysis data, which also provided the initial conditions. Figure 2 shows the location of the Gulf of Finland and the smallest model domain defined for both events. In all of the simulations, 44 vertical η-levels were used, from which 24 were below 1 km height. For the PBL parameterisation, we used the MRF scheme (Hong and Pan, 1996), the RRTM scheme for long wave radiation (Mlawer et al., 1997), the Dudhia (1989) scheme for shortwave radiation, and a 6-class microphysical scheme (Hong et al., 2004) for the microphysics parameterisation. For the land-surface scheme we used Noah model (Chen and Dudhia, 2001), and for surface layer scheme MYJ model (Janjic 1996a, 1996b). No cumulus parameterisation was used in the smallest domain.
4. Snow bands over the Gulf of Finland on 1–4 February 2012
Figure 3 shows the reflectivity images from the FMI weather-radar network at 0000 UTC on 2 February, at 2100 UTC on 3 February and at 1200 UTC on 4 February 2012. As shown, a quasi-stationary, roughly east–west oriented line of precipitation was observed over the Gulf of Finland from 1 February to the early morning of 3 February 2012. From 3 to 4 February 2012, radar recorded heavy drifting snow cells forming multiple perpendicular bands for about 100 km along the Finnish coastline. The associated intense and sudden snowfalls caused extremely slippery road conditions and low visibility in the Helsinki metropolitan area on 3 February with about 300 cars involved in multiple pile-ups and 43 persons injured (Niemelä, 2012).
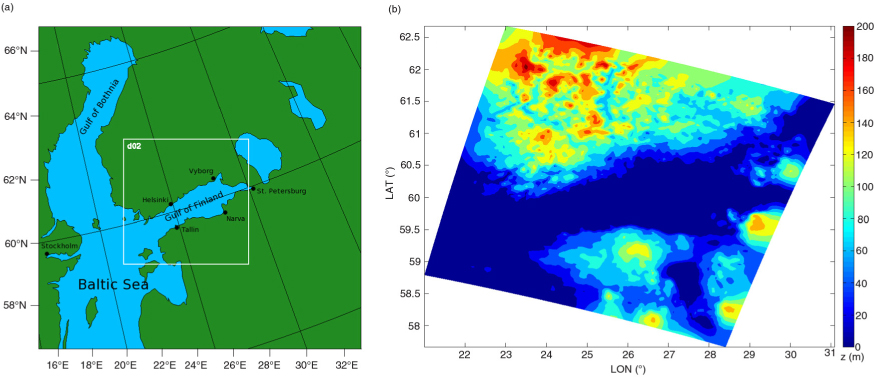
Fig. 2
Nested domains used in the simulation with some geographical references (a). The orography and land–sea border at domain 2 is shown in (b).
4.1. Simulation results
According to the WRF simulation, the episode can be divided into two different parts. The first one occurred from 1 February to the early morning of 3 February. During this period, an offshore quasi-stationary line of precipitation elongated from the west to the east was simulated over the Gulf of Finland. This first part is associated with an easterly basic flow (parallel to the coastline). In the second part of the event, from 3 to 4 February, the winds turn southerly, thus hitting the Finnish coastline perpendicularly. In this second part of the episode, a line of convective cells was simulated onshore over the Finnish coastline.
Figure 4 shows the simulated 1-hour accumulated precipitation and the surface wind field in the smallest domain on (1) 2 February at 0000 UTC, (2) 3 February at 2100 UTC and (3) 4 February 2012 at 1200 UTC. During the first part of the episode (Fig. 4a), the simulation shows surface wind coming from the east over the Gulf of Finland, approximately parallel to the coastlines. A large and quasi-stationary line of precipitation (greater than 300 km long) was simulated elongated from east to west over the gulf. According to the simulation, the location of this line oscillated offshore between the Finnish and Estonian coastlines. This oscillation of the snow band between the two coasts also appears in the radar images (not shown). At 0000 UTC on 2 February (Fig. 4a), the easterly winds had ~12 m s−1 and ~14 m s−1 on 3 February at 0000 UTC (not shown), when the fetch was 200–300 km. This wind speed range was higher than 10 m s−1, and similar to those found by other authors (Andersson and Nilsson, 1990; Norris et al., 2012). Finally, considering the Gulf of Finland as a lake, the morphology of the observed and simulated snow band at this time is quite similar to Type I, which is described by Niziol et al. (1995).
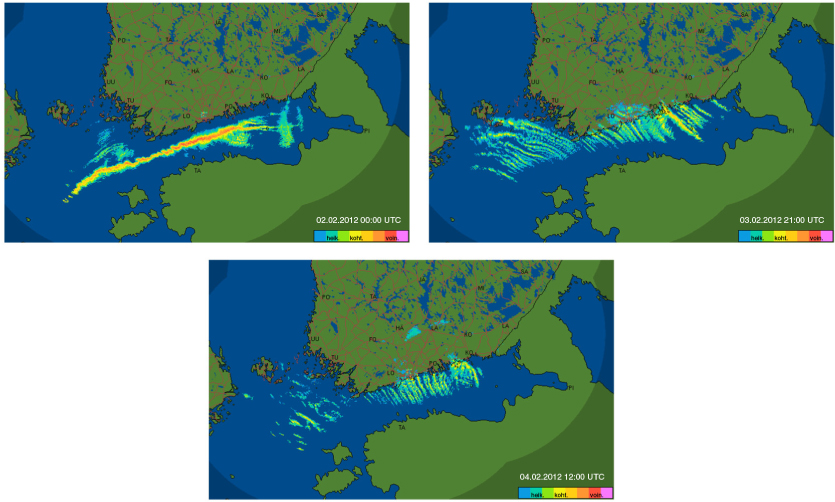
Fig. 3
Reflectivity images from the FMI weather–radar network on (upper panel) 2 at 0000 UTC, (middle panel) 3 February at 2100 UTC and (lower panel) 4 February 2006 at 1200 UTC. The colour scale indicate the reflectivity: blue and green colours are associated with low, yellow and orange with medium, and red and violet with high reflectivity.
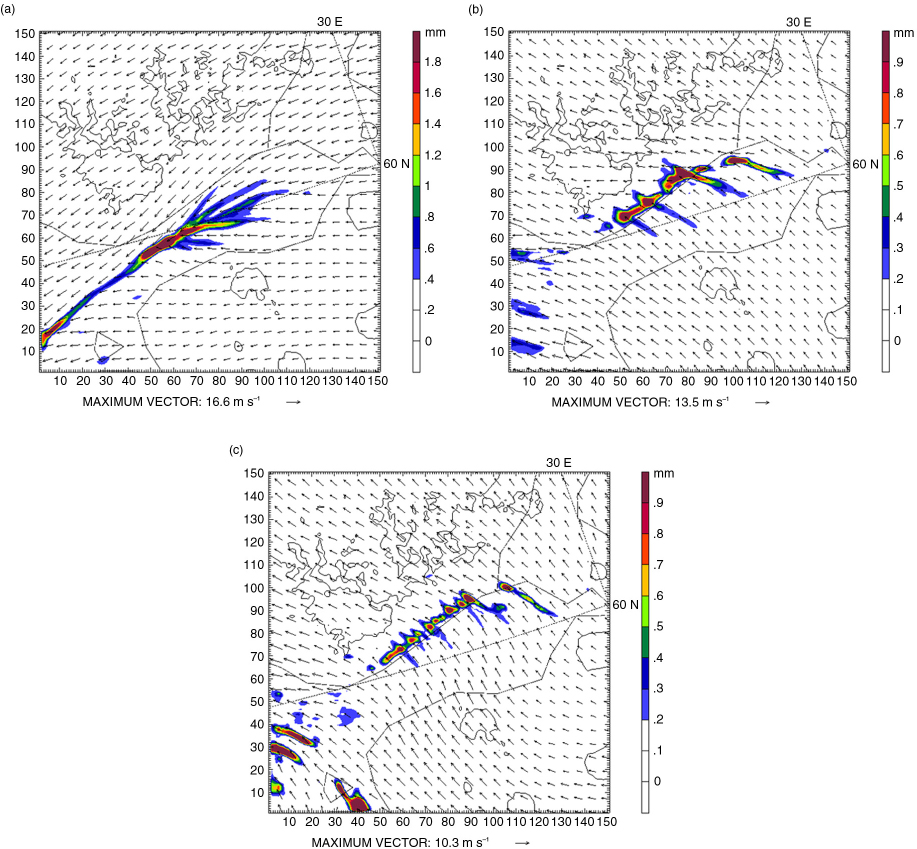
Fig. 4
Simulated 1-hour accumulated precipitation (colour contours) and surface wind field (arrows) in domain 2 on (a) 2 at 0000 UTC, (b) 3 at 2100 UTC, and (c) 4 February 2012 at 1200 UTC. Inland black lines are the 100 m orographic contour. The scale of the axes are in km.
At the east of the main simulated band along the Gul of Finland (between approximately 26 and 28°E), several smaller and weaker precipitation bands were simulated, expanding from SE to NE. These secondary lines of precipitation were also recorded by the reflectivity images shown in Fig. 3 (upper panel). The concave shape of the south–east coast of the Gulf of Finland apparently promoted a convergence region offshore, in the same approximate area where these secondary precipitation bands were located. These bands were caused by the convergence of the E–SE surface flow from Narva, the E flow from Saint Petersburg, and the E–NE flow from Vyborg (see Fig. 1a for locations). Furthermore, the shape and the narrowness of the western part of the gulf play an important role in the formation of a line of convergence in the gulf during ice-free conditions. In fact, the most remarkable simulated precipitation areas in the whole band were located in the western part of the gulf, between 24° and 25°E, and between the Finnish and Estonian coasts. During this first easterly phase, the long fetch over the sea gulf released into the atmosphere enough water vapour and energy from the warm sea to form snow showers. Over this area, the Finnish and Estonian coastlines are close and land breeze circulations may collide offshore. The large difference between the cold inland and the relatively warm sea air (around 18 K difference in potential temperature) induced strong land breezes from both Finnish and Estonian coastlines, which converge offshore in between both coasts, producing a vertical motion of around 86 cm s−1 in this simulation.
The second part of this episode started in the early morning on 3 February when the large-scale easterly wind changed to southerly and hit the Finnish coastline perpendicularly (see Figs. 2, 4b and c). The simulated snow bands are quite similar to the Type II described by Niziol et al. (1995). According to the simulation, the snow bands approached the Finnish coastline (not shown) and became a line of several aligned convective cells that formed onshore near the Finnish coastline and produced heavy snowfall. Associated with these convective cells, some narrow offshore bands of weak precipitation perpendicular to the coastline were simulated, mainly between 25° and 27°E, as recorded by the radar. The morphology and the quasi-stationarity of these observed and simulated snow bands strongly suggest that they developed from horizontal convective rolls (HCR) (Schultz et al., 2004). The mechanism is well-known (e.g. Atkinson and Zhang, 1996; Weckwert et al., 1997; Young et al., 2002). When sufficient moisture and convection exist, the updrafts associated with HCR in the boundary layer can saturate and cloud bands can appear. Thermal instability associated with very cold air over warmer water and can be one of the mechanisms that induce the formation of the HCR. One of the classical parameters for characterising the bands is the ratio A=L/h, where L is the spacing between the cloud bands and h is the depth of the circulation. Schultz et al. (2004) estimated a range values between 15 and 40 for the snow band that occurred on 23 January 2003 in central and southeast USA. Previous values of A for HCRs are 1–10 (Kelly, 1982; Miura, 1986; Atkinson and Zhang, 1996; Young et al., 2002), and 30–40 (Holroyd, 1971; Lemone and Meitin, 1984). In the case presented here, the range WRF-estimated range of L is around 30–40 km, and for h it is around 1400–1800 m, giving an estimated ratio of A ranging between 17 and 29 on 3 and 4 February 2012. These estimated values are quite similar than those estimated by Schultz et al. (2004), Holroyd (1971) and Lemone and Meitin (1984) at the Great Lakes in North America.
During this stage of the simulation, the cold air mass from the Estonian coastline moved offshore to the north driven by the southerly prevailing flow, preventing the continuation of the land breeze circulation from the Finnish coast. However, the cold air mass remained quasi-stationary inland. This cold air mass together with the sloping Finnish coast acted as an orographic barrier of around 200–400 m over the ground. Despite the actual short fetch, the air warmed and became wet when passing over the sea, then lifted over the stagnant wedge of inland cold air at the Finnish coast.
Figure 5 shows a vertical cross-section between Tallinn and Helsinki (along 25°E, see Fig. 1a) of the simulated potential temperature (colour contours), the snow mixing ratio (white contours), and the wind components v and w (arrows) on 4 February 2012 at 0600 UTC, when southerlies dominated. The cold stagnant inland air over the Finnish coastline (on the left in Fig. 5) enhanced the upward movement triggered by flow past the orographic coastal ridge (Nuuksio heights). The relatively warm and wet maritime air was forced to ascend over, leading to strong convergence and vertical motion, which apparently drove the cellular convection inland. By comparing with the results of the flat-coast experiments of Savijärvi (2012) it can be concluded that the role of the coastal ridge was important whereas.
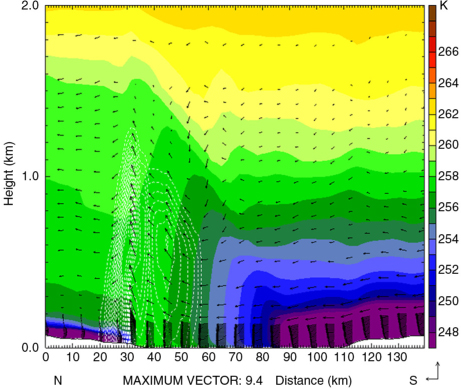
Fig. 5
Vertical cross-section along 25°E of the simulated potential temperature (colour contours), snow mixing ratio (white contours, maximum value 0.14 g kg−1) and the wind field (arrows) on 4 February 2012 at 0600 UTC. Estonian coast is on the right side, and Finnish coast is on the left.
To illustrate the physics associated with the prevailing easterlies, Fig. 6 shows the vertical cross sections along 25°E between Tallinn and Helsinki of (1) the potential temperature, (2) the u and (3) v horizontal wind components, as well as (4) the horizontal wind speed at 0000 UTC on 2 February 2012. Two cold air masses (see Fig. 6a) are identified delimited by the 257-K isentrope. The depth of these two cold air masses is around 900 and 500 m for the Estonian (S) and Finnish (N) cells, respectively, whereas a highly convective boundary layer was simulated over the sea.
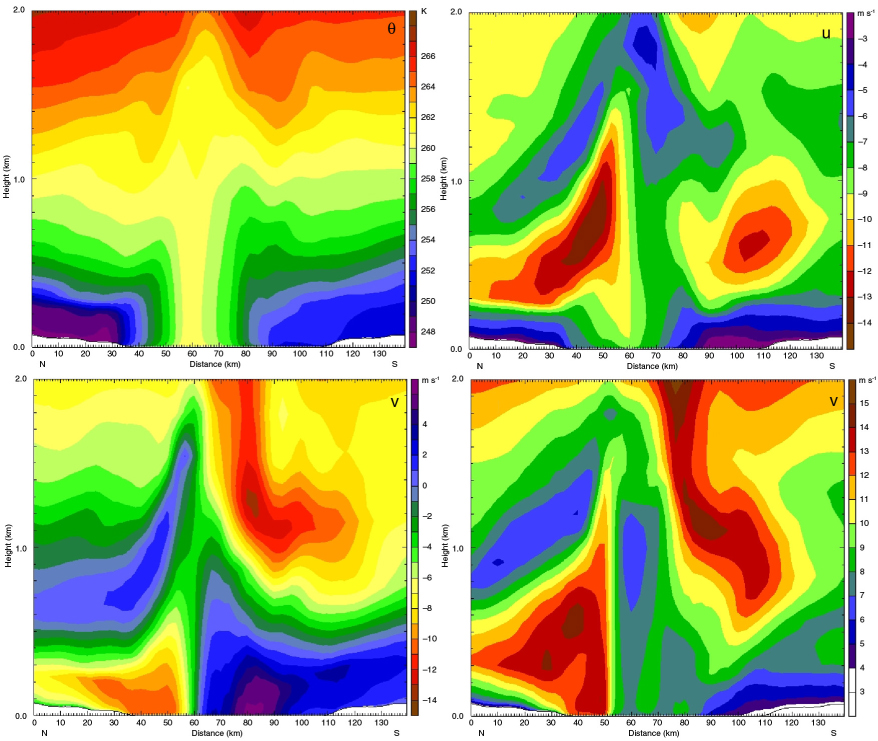
Fig. 6
Vertical cross-section along 25°E on 2 February 2012 at 0000 UTC of the potential temperature (θ), u wind component (u), v wind component (v), and the module of the horizontal wind speed (V). Estonian coast is on the right side, and Finnish coast is on the left.
Two easterly LLJs were simulated: one over the Estonian coast at around 800 m altitude, with a core wind speed of around 13 m s−1, and another over the Finnish coast at around 500 m altitude, with a core speed of 14 m s−1 (Fig. 6d). Related to the horizontal temperature gradients (Fig. 6a), the wind speed decreased upwards from the core of both LLJs, which suggests that baroclinicity has contributed to the formation of these LLJs.
Two easterly LLJ are also simulated along the gulf, as is shown in Fig. 6b (u-component). The core wind speed over Estonia is around 600–700 m with v~−13 m s−1, and over Finland around 700–800 m with v~−14 m s−1.
Figure 6c (v–component) shows two land breeze cells. At sea level, near the convergence area v~−10 m s−1 was simulated at the Finnish cell, and v~ + 5 m s−1 for the Estonian one. A return flow was simulated above 700 m in the Finnish and Estonian cells. At sea-level, a strong convergence Δv~16 m s−1 in around 7 km distance occurred as a result of the colliding land breezes. This led to large values of simulated vertical motion of around 0.9 m s−1 between 500 and 900 m (not shown), which obviously forced the band of precipitation along the gulf.
The quasi-stationary land breezes and their return flows are actually turned somewhat to the right due to the strong Coriolis force of the high latitude (Grønäs and Sandvik, 2002). This contributed to the two LLJ's and to a wind minimum at about 1000 m over the Finnish coast (Fig. 6b and d) and in Savijärvi (2012).
Figure 7 shows the simulated 24-hours accumulated precipitation (1) on 3 February 2012 at 0000 UTC and (2) on 4 February 2012 at 0000 UTC, in which different patterns can be identified. The accumulated precipitation pattern from 0000 UTC on 2 February 2012 to 0000 UTC on 3 February 2012 (Fig. 7a) shows greater homogeneity and extension over the sea (following the offshore line of snowfall) than the precipitation in the next 24 hours (Fig. 7b), when the precipitation is focused inland, follows the Finnish coastline and is concentrated in many small convective cells. Furthermore, between 24° and 25°E, the largest amount of precipitation fell between 2 and 3 February 2012, when easterlies dominated (with a long fetch) and land breezes flowed from the Estonian and Finnish coasts.
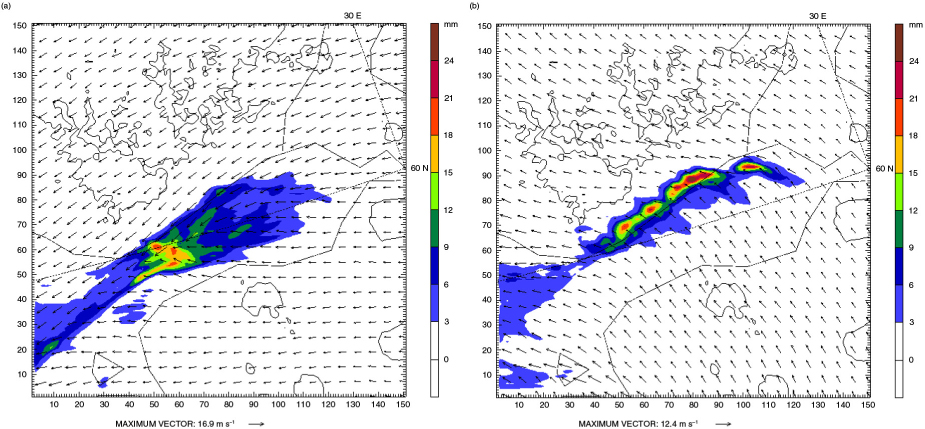
Fig. 7
Simulated 24-hour of accumulated precipitation (colour contours) and surface wind field (arrows) on (a) 3 February at 0000 UTC, and (b) 4 February 2012 at 0000 UTC. Inland black lines are the 100 m orographic contour. The scale of the axes is in km.
5. The snow band over the Gulf of Finland on 17–22 January 2006
Figure 8 shows the reflectivity images from the FMI radar network. Several areas of precipitation were recorded along the Finnish coastline on 18 January 2006 at 0000 UTC (upper panel). On 19 January 2006 at 1200 UTC (middle panel) a line of precipitation was recorded offshore, between the Finnish and Estonian coasts. On 20 January 2006 at 1000 UTC (lower panel), several narrow and short lines of precipitation were recorded over and perpendicular to the Finnish coast.
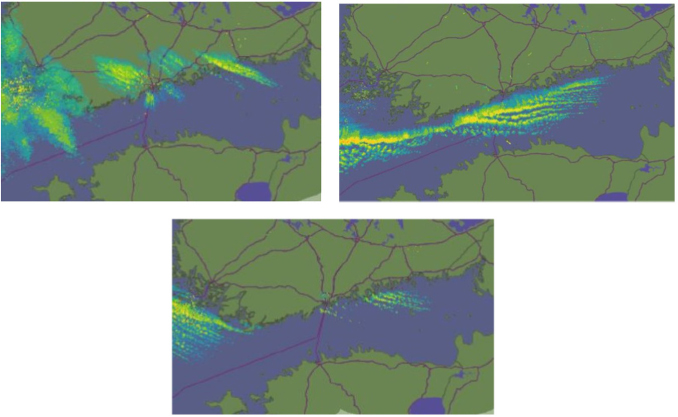
Fig. 8
Reflectivity images from the FMI weather–radar network on (upper panel) 18 at 0000 UTC, (middle panel) 19 at 1200 UTC and (lower panel) 20 January 2006 at 0000 UTC. The reflectivity scale is as in Fig. 3.
5.1. Simulation results
The WRF model simulated a westerly flow over the Gulf of Finland from 15 January 2006 to around noon on 16 January 2006, when the wind turned to east–southeast. On the morning of 17 January 2006 the wind turned to southeast. Then several weak precipitation cells were simulated along the Finnish coastline (not shown). When the southeasterlies then turned into easterlies, a line of precipitation along the gulf was simulated. This snow band approaches to the Finnish coastline as the easterlies turn to southeasterly, which veers to southerlies from 20 January. Then a shoreline-perpendicular precipitation band form over the Finnish coastline.
Figure 9 shows the simulated 1-hour precipitation (colour contours) and the surface wind field (arrows) on (1) 18 January at 1200 UTC, (2) on 19 January at 1200 UTC, (3) 20 January 2006 at 0000 UTC and (4) 20 January 2006 at 1200 UTC. A large line of precipitation was simulated, parallel to the coastline, elongated from west to east. The highest precipitation rate was simulated again between 24° and 25°E offshore, between the Finnish and Estonian coastlines, as in the 2012 event. In the 2006 event the easterlies provided heat and water vapour over this part of the Gulf of Finland. Moreover, the narrowness of the gulf (mainly in the western part) enhanced the convergence offshore when land breeze circulations from the Estonian and Finnish coasts collided. This simulated line of precipitation, which may be classified as Type I according to the classification of Niziol et al. (1995), remained quasi-stationary for several days, from 18 January at 0000 to around 20 January at 1200 UTC, when the easterlies turned into southerlies. From 18 to 20 January, a fetch of around 250–300 km was associated with an easterly surface flow moving at speeds of around 11–14 m s−1. From 19 January the line of precipitation developed and moved to the Finnish coast, where several convective cells formed onshore (see Fig. 9c). On 20 January at 0600 UTC (Fig. 9d), the precipitation reduces and it is focussed in a cell shoreline-perpendicular band to the Finnish coastline, approximately at the same position that reflectivity radar images recorded some few street-bands of precipitation perpendicularly to the Finnish coastline, shown in the lower panel in Fig. 8. This second phase corresponds with the snowbands type II described by Niziol et al. (1995).
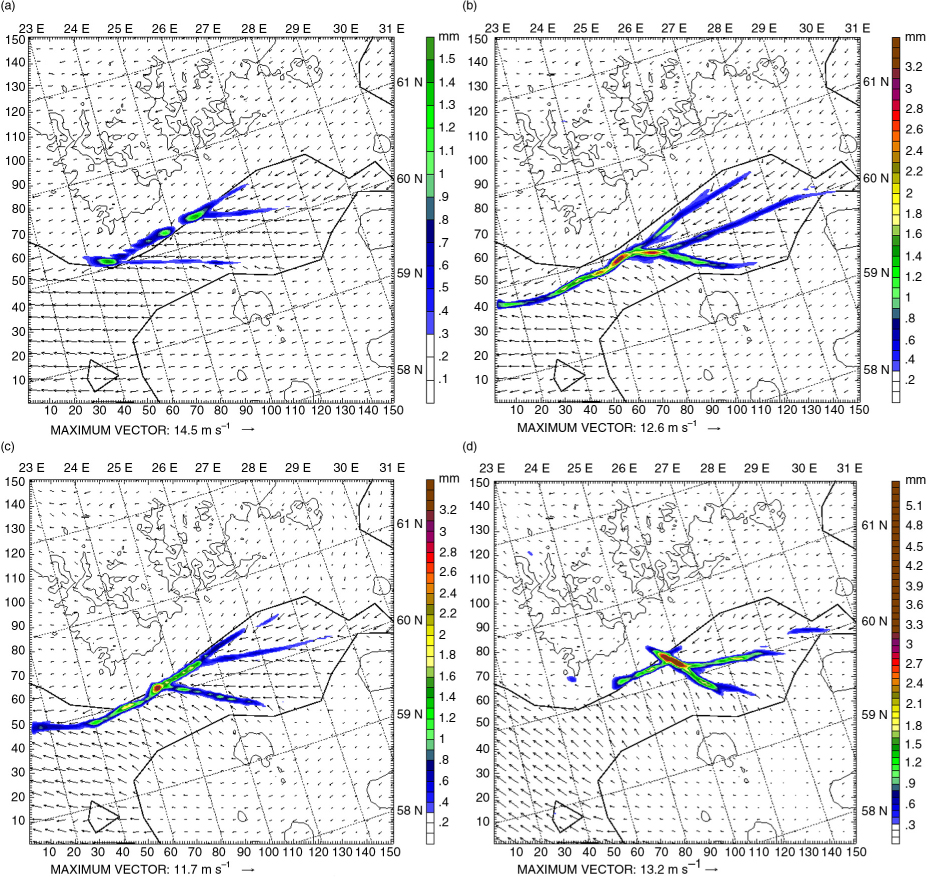
Fig. 9
Same as Fig. 4 on (a) 18 at 0000 UTC, (b) 19 at 0000 UTC, (c) 20 January 2006 at 0000 UTC and (d) 20 January 2006 at 0600 UTC. Inland black lines are the 100 m orographic contour. The scale of the axes is in km.
Similar to the results obtained in the simulation of the 2012 event, at the eastern part of the main band, three secondary weaker precipitation bands expanded out from the main band on 19–20 January (Fig. 9b and c). The concave shape in the eastern part of the Gulf of Finland promoted the convergence seen offshore in the E–NE flow (northern band), the ENE–ESE (central band) and the E–SE flow (southern band).
Figure 10 shows the vertical cross-section along 25°E of the potential temperature (colour contours), the snow mixing ratio (white contours) and the components v and w (arrows) on (1) 18 at 2200 UTC and (2) 20 January 2006 at 0400 UTC. Figure 10a shows how the cold air from the Estonian and Finnish coasts moved offshore driven by the land breezes; a convergence area with a snow band over the sea was simulated within the easterly regime. The estimated depths of the Estonian and Finnish cold-air outbreaks were around 1000 m.
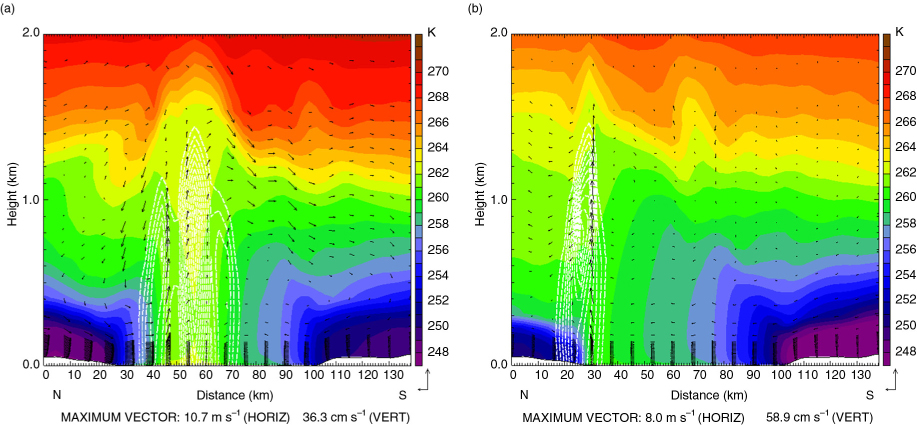
Fig. 10
Same as Fig. 5 on (a) 18 at 2200 UTC (Easterly regime) and (b) 20 January 2006 at 0400 UTC (Southerly regime). Maximum simulated snow mixing ratio is 0.17 g kg−1 in (a) and 0.15 g kg−1 in (b).
As the easterly turned into southerly, the cold-air outbreak from the Estonian coast was enhanced, causing the decay of the land breeze over the Finnish coast. However, the cold air remained stagnant inland Finland, with a depth of around 200–300 m. This air acted as an extra orographic barrier that contributed to the vertical movements. Consequently, the warm and wet southerly maritime air was lifted over this cold air (see Fig. 10b), leading to cellular convection inland.
Focussing at the time when the easterlies were dominant, Fig. 11 shows the vertical cross-section along 25°E on 18 January 2006 at 2200 UTC of (1) the simulated potential temperature, the wind components (2) u and (3) v, and (4) the module of the horizontal wind speed. Two cold air masses are identified, delimited by the 258-K isentrope (Fig. 11a). The depth of these two cold-air outbreaks is around 1000 m for both the Estonian (S) and Finnish (N) cells. Moreover, a highly convective boundary layer was simulated over the sea.
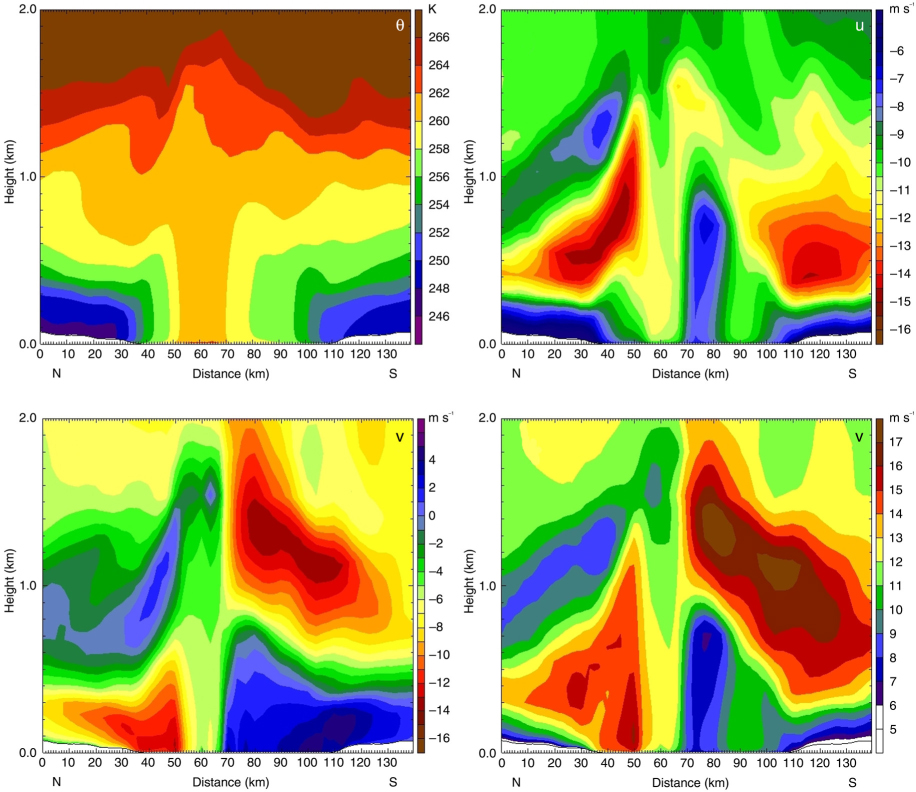
Fig. 11
Same as Fig. 6 on 18 January 2006 at 2200 UTC.
Figure 11b shows two simulated easterly LLJs: one with a core wind speed of around 17 m s−1 over the Estonian coast, and a lower one with a core speed of 16 m s−1 over the Finnish coast (Fig. 11d). As in the 2012 event, baroclinicity contributed to the formation of these LLJs. The higher contribution to this maximum wind–speed is associated with a northerly land-breeze return flow over the Estonian coast, as is suggested in comparing u and v components in Fig. 11b and c, respectively. Regarding panel c (v–component), two land breezes are observed. At sea level in the Finnish cell, v~−12 m s−1 and in the Estonian cell v~ + 4 m s−1. A return flow was simulated at around 1000 over both coasts. Over the Estonian coast, at approximately the same height where the LLJ are simulated in panel d, the maximum wind component is around 15 m s−1.
As a consequence of the convergence caused by the opposing land breezes, a vertical motion of around 60 cm s−1 was simulated (not shown). In this case the vertical motion is lower than in the 2012 event, because during the 2006 event the lapse rate in the boundary layer is lower.
6. Conclusions
Two snow band episodes occurring over the Gulf of Finland in January 2006 and February 2012 were simulated using the WRF numerical model. The WRF precipitation patterns and observed radar reflectivity images had a fairly good correspondence in both cases.
Similar meteorological set-up is found in both events. However, the 2012 event was particularly destructive while the 2006 event lasted a long time. The explanation for the long 2006 event and not so long but destructive event in 2012 can be explained by large-scale conditions. In 2006 the basic flow was easterly or south-easterly throughout the event. Also, the Gulf of Finland was ice-free during that time. These large-scale and surface conditions favour the steady snow band forming along the gulf. The event will stop if the gulf is frozen, the air mass gets warmer, or the basic flow weakens. In the 2012 event, the large-scale conditions to maintain along the gulf snow band prevails only on 1 and 2 February. On 3 February the basic flow is from the south and on 5 February the flow is already weak. Thus, the 2012 event does not last as long as the 2006 event. The 2012 event was so destructive because the basic flow, which turned southerly on 3 February, lead to constant and several perpendicular shoreline snow bands. Many of those bands were snowing a lot near the coast line.
The simulations suggest that the narrowness of the Gulf of Finland in its westernmost part promotes strong line convection offshore during easterly cold-air outbreaks over the ice-free water, as a consequence of colliding land breezes from the Finnish and Estonian coasts. A long fetch provides large fluxes of water vapour and heat from the sea to the air. Moreover, the sea gulf and the concave shape of the coastline in the eastern part of the gulf leads to the formation of several secondary lines of precipitation there.
Common patterns were found in the synoptic situation of both analysed events. First, a quasi-stationary high-pressure area over the Barents Sea drove mainly easterly cold-air outbreaks into the Gulf of Finland. Second, two large-scale wind regimes existed over the Gulf of Finland: easterly at the beginning of the cold-air outbreaks and southerly at the end of the episodes. Finally, the open Gulf of Finland acts as a large heat source that drives land breezes that are embedded in the large-scale easterly cold-air outbreak phases.
During the easterly wind regime (winds parallel to the coastline along the major axis of the gulf), an offshore precipitation line was observed and simulated along the Gulf of Finland. The highest simulated values occurred at 24–25°E between the Estonian and Finnish coasts. Over this area the fetch of the prevailing easterly was longer than over the other parts of the gulf. During this regime, quasi-stationary land breezes from the Estonian and Finnish coastlines were simulated. They collided offshore, forcing the relatively warm and moist sea-air upward. In both events the depths of the cold-air outbreaks were around 800–1000 m for the Finnish and the Estonian cells. In addition, two LLJs were simulated over the Finnish and the Estonian coasts, generated by the combined effects of baroclinicity and the land-breeze cells turned by the Coriolis force. Table 1 summarises these quite similar features found in both episodes.
Table 1. Simulated values of the depth of the Estonian (H E) and Finnish (H F) cold-air outbreaks, maximum vertical wind velocity (w), the horizontal wind velocity (V LLJ) and the height (H LLJ) of the simulated low-level-jet in the Finnish (F) and Estonian (E) cells; and the inland-sea potential temperature difference (Δθ)
2006100010006016500–60019800–10001620124009009014400–50012700–80014
In both studied cases, the formation of snow bands agrees well with the results of Laird et al. (2003a), who found that bands form when the ratio between the wind speed and fetch (V/L) is in the range of 0.02–0.09 m s−1 km−1. In both 2006 and 2012 the WRF–based ratio was 0.04–0.06 m s−1 km−1. Additionally, the simulated wind veocity was higher than 10 m s−1 and parallel to the long axis of the Gulf of Finland when the snow bands remained offshore and were elongated across the long axis of the gulf, as other authors found in other snow-band events (Laird et al., 2003a; Norris et al., 2012; Savijärvi, 2012).
During the second part of these events, a southerly wind regime (wind across coasts) prevailed, and the observed and simulated coastal line of precipitation moved inland to the downwind (Finnish) coast. Several perpendicular precipitation bands to the coastline characterised this phase. During this regime, the Estonian land breeze advected the air over the Gulf of Finland and transformed it into a heat island circulation pattern with downwind cloud streets, which occurred especially during the snow band of February 2012. The cold stagnant air over the Finnish coast and the downwind coastal slopes forced the moist maritime air upwards inducing convection and heavy snow showers that caused severe traffic accidents during the 2012 event. Concerning the 2012 snow band event, reflectivity radar images and numerical simulations suggest that HCR formed over the Finnish coastline during the second part of the event. The estimated parameter A=L/h, where L is the spacing between the cloud bands and h is the depth of the circulation, ranged between 17 and 32, which agrees with other snow bands investigated by other authors (Holroyd, 1971; Lemone and Meitin, 1984; Schultz et al., 2004).
Considering the Gulf of Finland as a lake, the classification of the snow bands proposed by Niziol et al. (1995) over the Great Lakes in the USA has been applied to the snow bands investigated in this paper. The first part of the simulated snow band occurring on both events 2006 and 2012 have been classified as Type I, which transformed into Type II during the second part of the events.
The WRF simulation results also agree well with those based on idealised experiments using the 2-D model of Savijärvi (2012); both produced the same structure of quasi-stationary land breeze circulations as well as the associated LLJs and other wind patterns during the cold-air outbreaks along and across the gulf.
As a final reflection, the changes in climate may favour the occurrence of easterly cold-air outbreaks producing snow bands over the Gulf of Finland. This is related to two factors: (1) due to the decreasing length of the ice season in the Baltic Sea (Vihma and Haapala, 2009), there is more time for the occurrence of cold-air outbreaks over the sea gulf; and (2) easterly winds over Europe in winter are potentially favoured by the strong decline of sea ice in the Arctic (Yang and Slingo, 2001; Overland and Wang, 2010; Petoukhov and Semenov, 2010) and by the recent increase in Siberian autumnal snow cover (Cohen et al., 2012). Further knowledge is needed in order to improve the dynamics and forecasting of these snow-band events in the scenarios of longer periods of drifting sea-ice and prevailing easterly flows.
7. Acknowledgements
This project has been carried out by using the resources of the Supercomputing Center of Catalonia (CESCA). It has been performed under the Spanish MICINN projects CGL2009-08609, CGL2012-37416-C04-03 and under the contract 259537 with the Academy of Finland.