
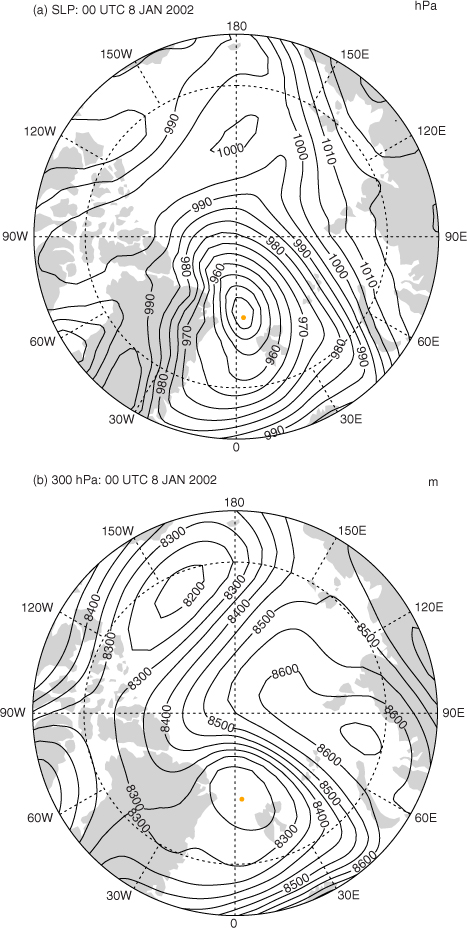
Fig. 1
(a) SLP pattern at 00 UTC 8 January 2002 when the lowest January central pressure was diagnosed (contour interval is 5 hPa). In the M10 scheme the centre of the cyclone was located at 5.1°E, 81.4°N (indicated in Figure) and had a central pressure was 938 hPa. (b) 300 hPa geopotential height at the same synoptic time (contour interval is 50 m).
Table 1. Statistics the SLP cyclone with the lowest pressure (R1) in the 12 calendar months, for the period 1979–2009, with the time (UTC), date and year in which they occur, as determined by method M10
Time Date Month YearMin. press. (hPa) Anom.Long. (°E)Lat. (°N)Min. Z300 (m) Anom.Long. (°E)Lat. (°N)Separation (km)
0008Jan2002938.0−68.95.181.48222.5−199.74.581.319.71207Feb1995946.8−59.839.870.38101.0−464.233.870.9232.61207Mar1997947.3−58.0352.271.08301.2−304.7348.271.4148.31812Apr1990953.5−62.016.781.18254.1−350.217.281.214.80621May1998964.9−48.875.275.68508.5−259.175.675.718.51205Jun1994970.2−41.2172.283.18494.6−422.5134.084.7476.50604Jul2002974.5−36.9218.281.58587.2−460.0219.080.968.40607Aug1995966.7−44.587.082.28650.0−370.059.179.9536.10623Sep1982957.7−50.031.573.78635.5−302.931.274.146.81227Oct2003950.9−56.63.674.68408.0−349.10.675.4117.50617Nov1996942.5−72.7115.980.48123.8−372.4111.980.780.10023Dec1990940.6−65.7349.474.48241.5−336.4351.673.4127.8
[i] The fifth to eighth columns show the lowest central pressure, the deviation from the relevant monthly climatology at the location of the storm, and the longitude and latitude of the storm. The next four columns present analogous statistics for a vortex which was identified at the same time at the 300 hPa level in the vicinity of the surface storm. The last column displays the horizontal separation between the centres of the SLP and 300 hPa systems.
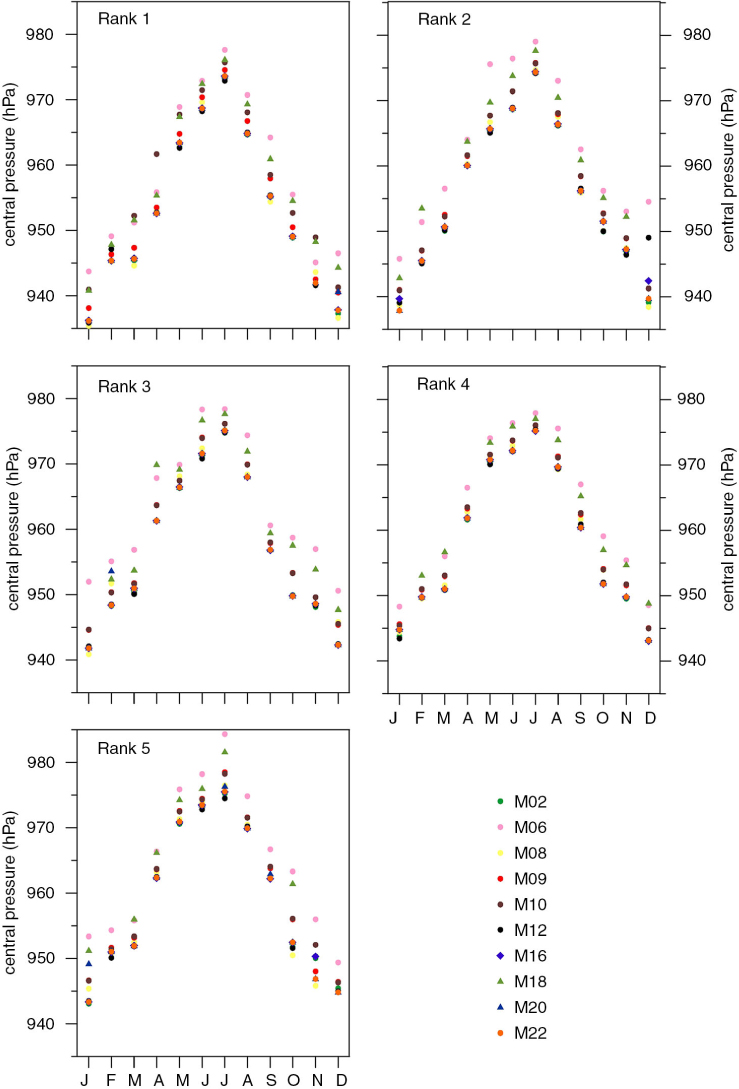
Fig. 2
Central pressure (hPa) of the R1, R2, R3, R4 and R5 cyclones in the 12 calendar months determined by each of the cyclone identification algorithms.
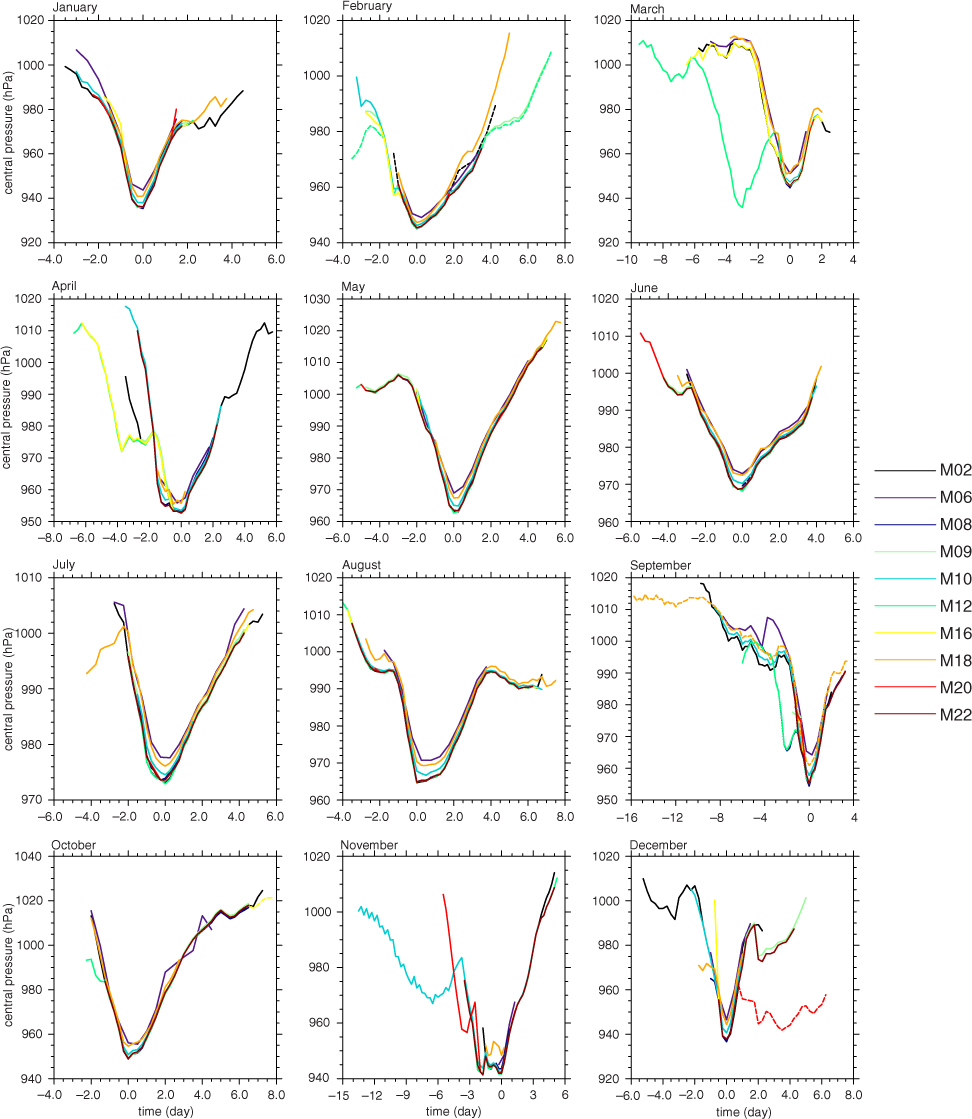
Fig. 3
Time series of the central pressure of cyclone identified in the methods in the time leading up to and after the minimum. The abscissa presents the time in days, and the zero represents the time of the minimum surface pressure.
Table 2. Lifetime (in days) of the 12 R1 storms identified by the 10 identification methods
Jan8.254.753.503.755.004.254.005.504.003.508.25M024.65Feb5.754.252.2510.007.00 11.00 6.506.253.004.7511.00M126.07Mar8.506.252.002.502.259.008.756.002.502.259.00M125.00Apr9.503.254.755.006.259.258.752.003.255.259.50M025.72May6.256.256.259.757.2510.257.257.009.759.7510.25M127.97Jun7.256.754.008.256.508.255.258.009.508.259.50M207.20Jul8.257.256.506.503.256.756.759.256.506.509.25M186.75Aug10.505.756.2510.2510.2510.7510.5010.505.0010.0010.75M128.98Sep12.009.758.753.2510.257.753.00 19.50 4.755.0019.50M188.40Oct9.506.757.758.003.256.259.255.008.008.009.50M027.18Nov7.001.751.507.50 17.25 9.00−12.0010.758.7517.25M107.28Dec7.752.752.006.003.50−12.003.006.255.007.75M024.25Max12.009.758.7510.2517.2511.0010.5019.5010.7510.00SepSepSepAugNovFebAugSepNovAugAve8.385.464.636.736.838.416.557.006.106.42
[i] An unbiased estimate of lifetime is obtained by calculating N/4, where N is the number of consecutive (6-hourly) analyses in which the 12 storms are identified in the methods. Bold numbers denote the maximum for a given scheme, and Italics denotes the maximum for a given month, while Bold and italics indicate the maximum for a given month and scheme. Red font means that the cyclone was ranked the second or the third in that scheme, while ‘ −1’ indicates that the cyclone was not found in that scheme.
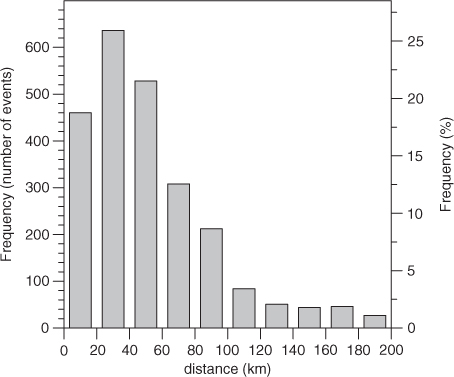
Fig. 4
Histogram of the frequency bins for the separation between the locations of minimum central pressure in the various cyclone methods. The distribution is drawn from all available comparisons for the top five ranked cyclones and for all 12 such months.
Table A1. Code numbers for the tracking methods used in this study, and the main references for method descriptions
M02Murray and Simmonds (1991), Pinto et al. (2005)M061997), Hewson and Titley (2010)M082006)M09Serreze (1995), Wang et al. (2006)M10Murray and Simmonds (1991), Simmonds et al. (2003)M122002), Rudeva and Gulev (2007)M162002)M181994, 1997)M202006)M222005), Akperov et al. (2007)
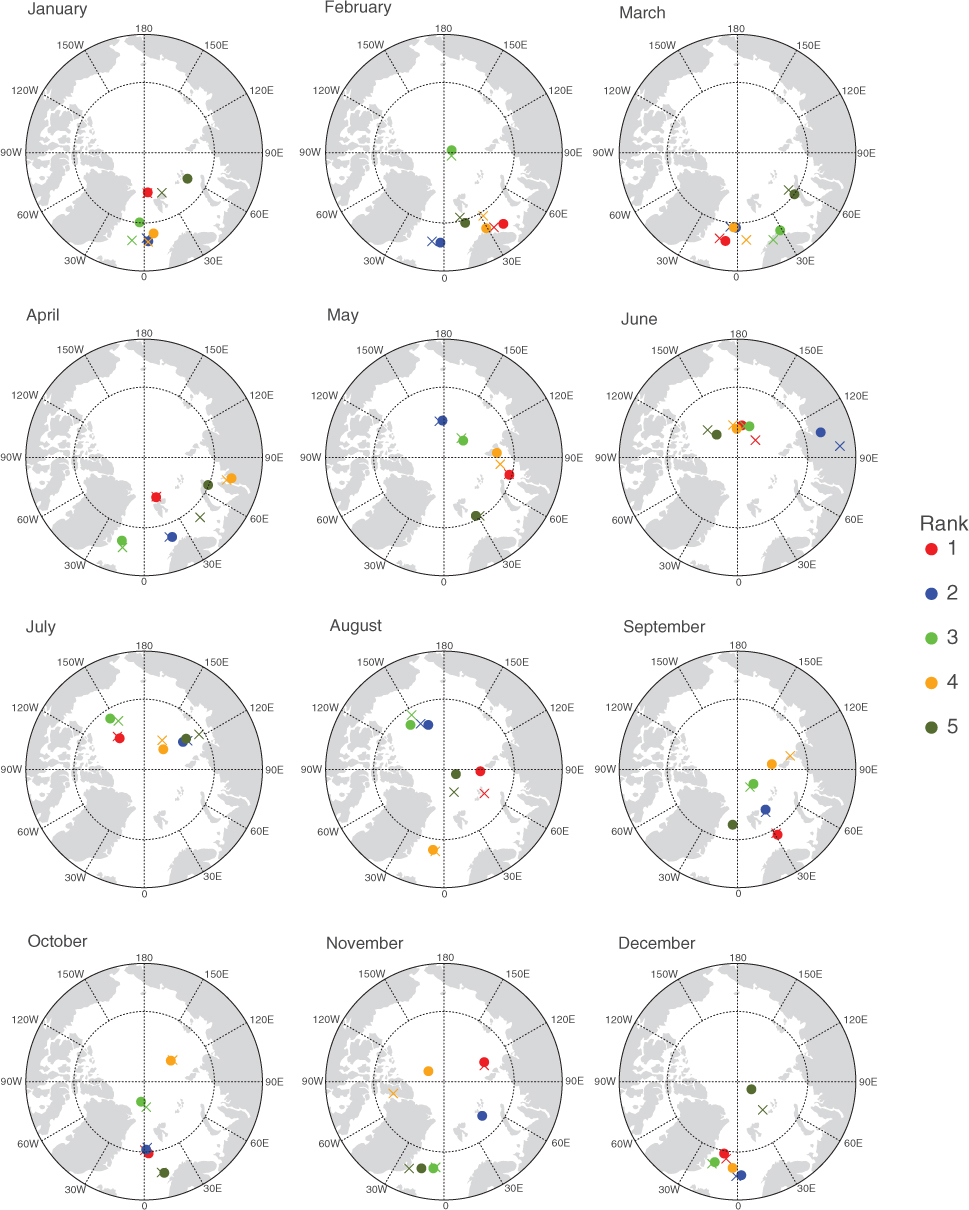
Fig. 5
Locations of the five most intense surface cyclones for each of the calendar months (filled circles). The five colours denote the five rankings (see legend). The crosses denote the location of a significant Z300 system within 1000 km of the surface cyclone.
Table A2. Times and dates of the first, second, third, fourth and fifth highest ranked cyclone (R1, R2, R3, R4 and R5) for the 12 calendar months of the year
Jan00 08 200212 08 199312 11 198418 21 199400 13 2009Feb06 07 199518 06 198118 22 199618 28 199012 01 1993Mar12 07 199700 13 199500 01 199012 03 197912 22 2003Apr18 12 199018 04 200700 01 199500 04 199012 26 1997May00 21 199806 22 199218 02 199006 30 199406 04 2001Jun12 05 199412 19 199718 22 200812 08 199218 16 1986Jul06 04 200206 02 198618 29 200318 26 199218 05 1993Aug18 06 199518 28 198018 06 199100 22 199118 07 1994Sep06 23 198200 25 200306 28 198906 29 198612 02 1999Oct12 27 200318 12 198600 10 198818 28 199712 12 1996Nov06 17 199606 08 200412 10 200100 29 199306 28 1984Dec00 23 199000 20 199300 28 198012 23 200400 22 1979