
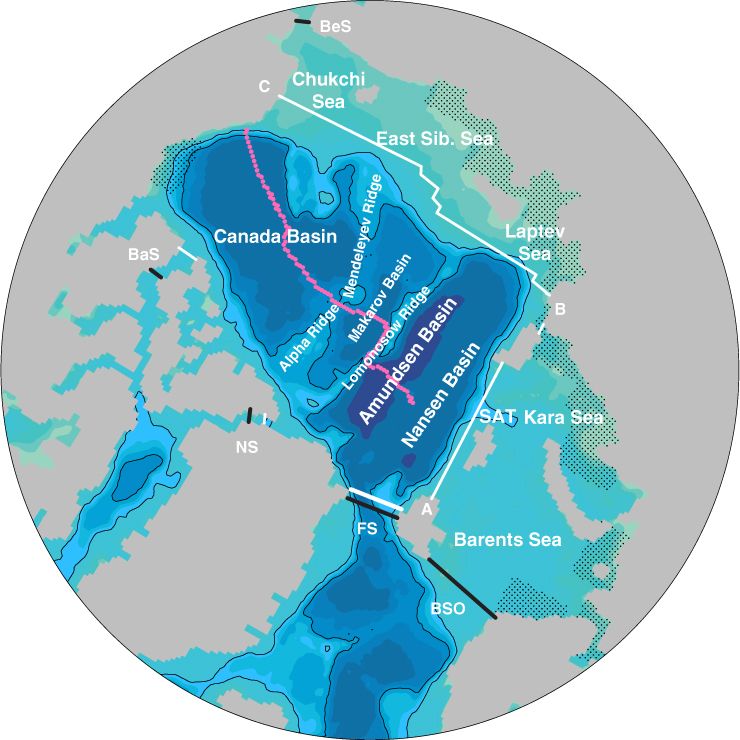
Fig. 1
Map showing the model bathymetry over the Arctic region and geographical locations mentioned in this study: BaS=Barrow Strait, BeS=Bering Strait, BSO=Barents Sea Opening, FS=Fram Strait, NS=Nares Strait, and SAT=St Anna Trough. The bold black lines show the location of the inflow tracers at FS, BSO and BeS. The region within the bold black lines and the Arctic coastline is where the surface tracers for sea-ice melt, sea-ice formation, evaporation and precipitation are injected. The hatched regions show the patches where runoff tracers are injected. The bold white lines are the five boundary segments where transports are calculated in Sections 3.5–3.7: Svalbard–Siberia (A–B), Alaska–Siberia (C–B), BaS, NS and FS. The dotted pink line shows the approximate position of the Beringia transect.
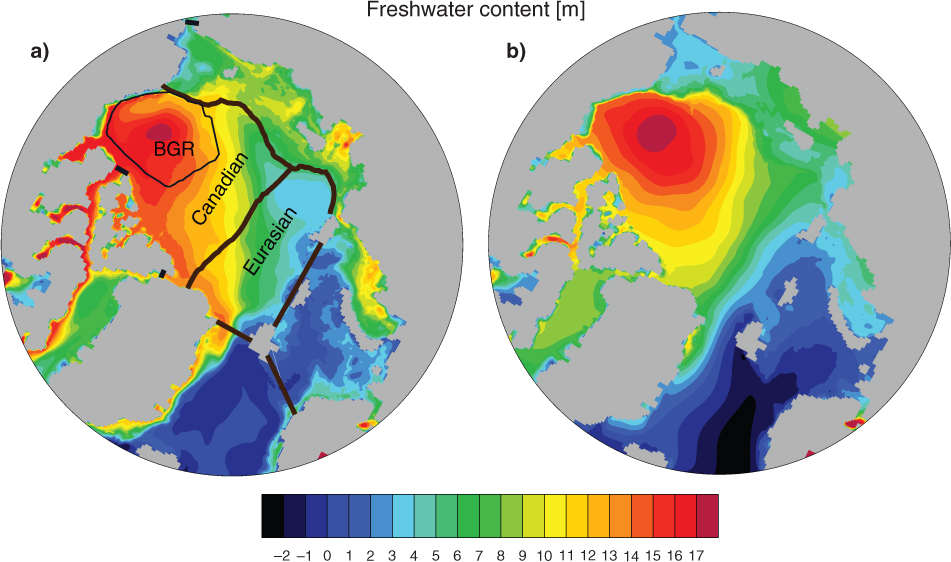
Fig. 2
Mean freshwater (FW) height in m integrated over the top 256m for the period 1968–2011 for (a) RCO model and (b) PHC (Polar Science Center Hydrographic Climatology 3.0). The regions marked with black lines in (a) are used to calculate FW/tracer volumes in Fig. 3.
Table 1. Comparison of net mean freshwater fluxes from RCO over the period 1968–2011 and observations from compilation by Serreze et al. (2006)
Bering strait liquid33322500Bering strait solid112100CAA liquid−3133−3200CAA solid−404−160Fram strait liquid−3598−2660Fram strait solid−1737−2300Barents Sea opening liquid723−90Barents Sea opening solid−151−River runoff33283200P-E21412000Net613−610
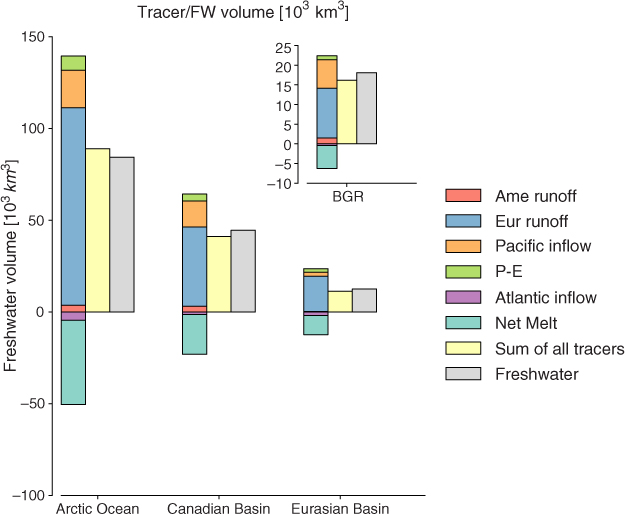
Fig. 3
Mean freshwater/tracer volumes integrated over the top 256m and for different regions (defined in Fig. 2a). The Arctic Ocean region covers both shelves and deeper basins. The Canadian and Eurasian basins are the deeper central parts (depth greeter than 500 m) delineated by the Lomonosov Ridge. Note that the Beaufort Gyre region (BGR) is included in the Canadian Basin.
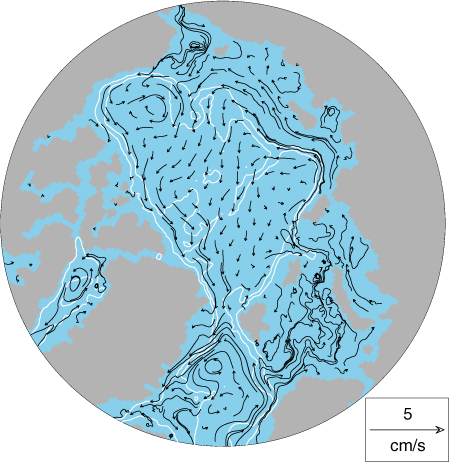
Fig. 4
Mean currents (cm/s) averaged over the upper 0–256m overlaid on the 500 and 2000m isobaths (white lines).
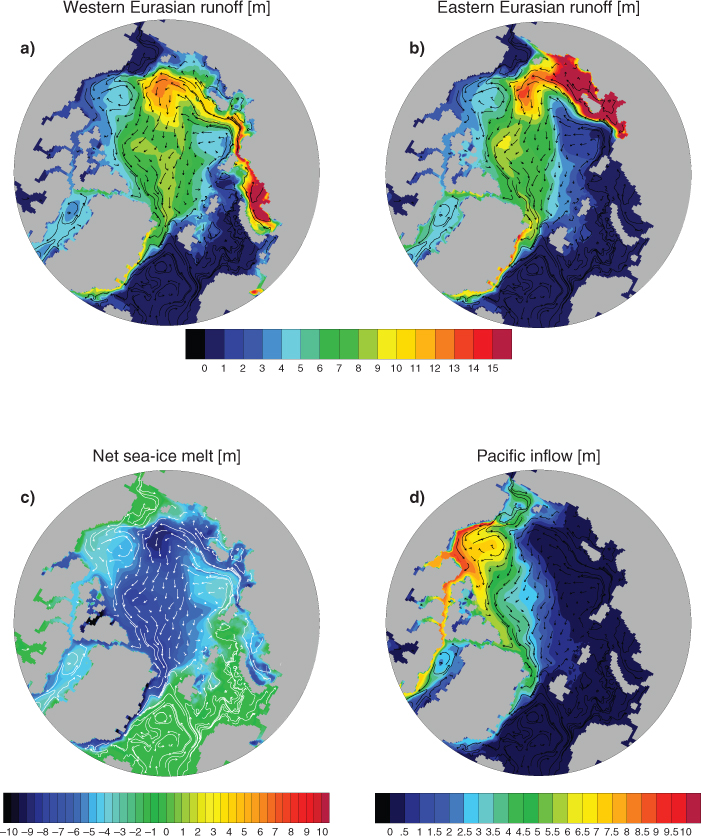
Fig. 5
Mean (1968–2011) passive tracer heights in m integrated over the top 256m and currents averaged over 0–256 m. For (a) the Western Eurasian runoff (the Barents and Kara seas), (b) Eastern Eurasian runoff (the Laptev and East Siberian seas), (c) net sea-ice melt (NSIM) and (d) Pacific water.
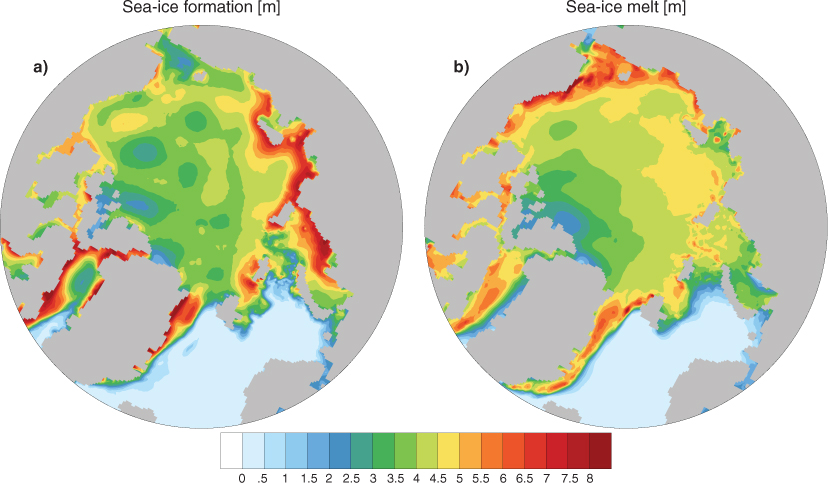
Fig. 6
In (a) seasonal (October–March) sea-ice formation in m/season averaged over the period 1968–2011 (the sea-ice formation includes frazil and basal ice production) and (b) the seasonal (April–September) sea-ice melt m/season.
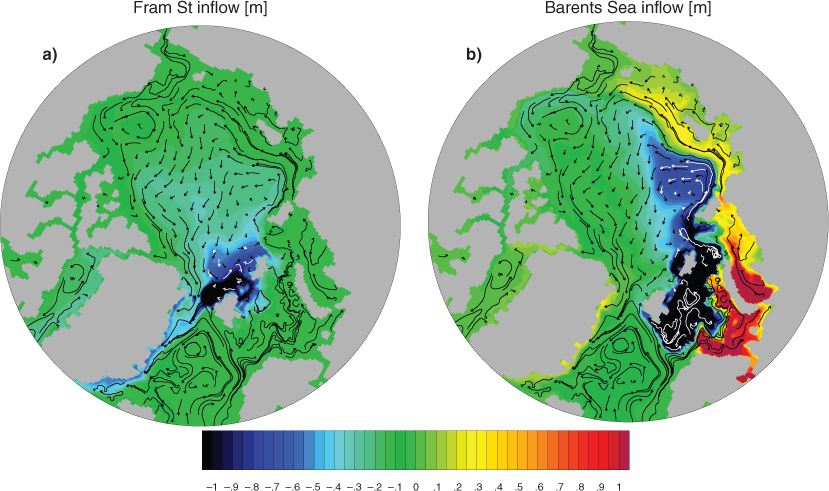
Fig. 7
Same as in Fig. 5 but for the Atlantic water (AW) inflow tracers: (a) from the Fram Strait (b) from the Barents Sea Opening.
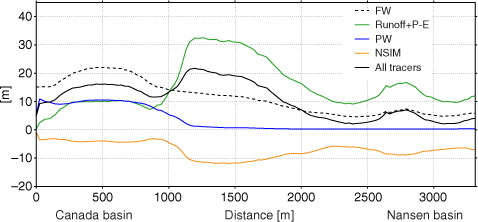
Fig. 8
Inventories of freshwater (FW), meteoric (runoff and P–E) tracer, Pacific water (PW) tracer, net sea-ice melt (NSIM) tracer and sum of all tracers calculated for the upper 256m from 2005 along the Beringia transect. The location of the transect is shown in Fig. 1.
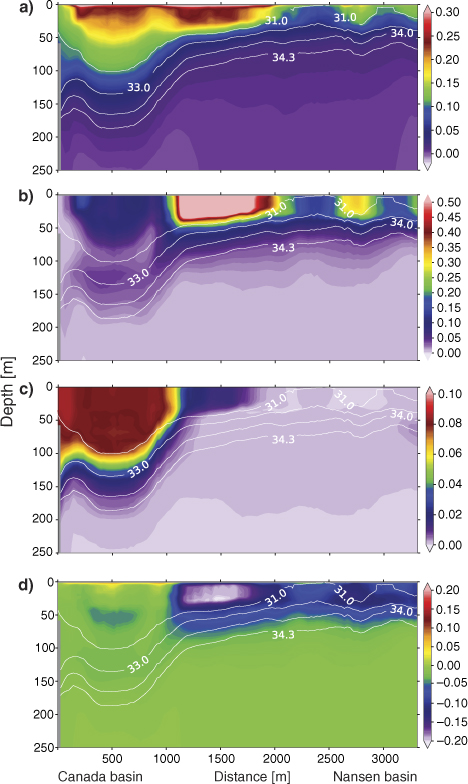
Fig. 9
(a) Mean 2005 freshwater (FW) concentration, (b) meteoric (river runoff and P–E), (c) Pacific water and (d) net sea-ice melt (NSIM) tracer concentrations along the Beringia transect (see Fig. 1 for location). Note that the colour scales are different and that the white contours show the 31, 33, 34, 34.3 isohalines.
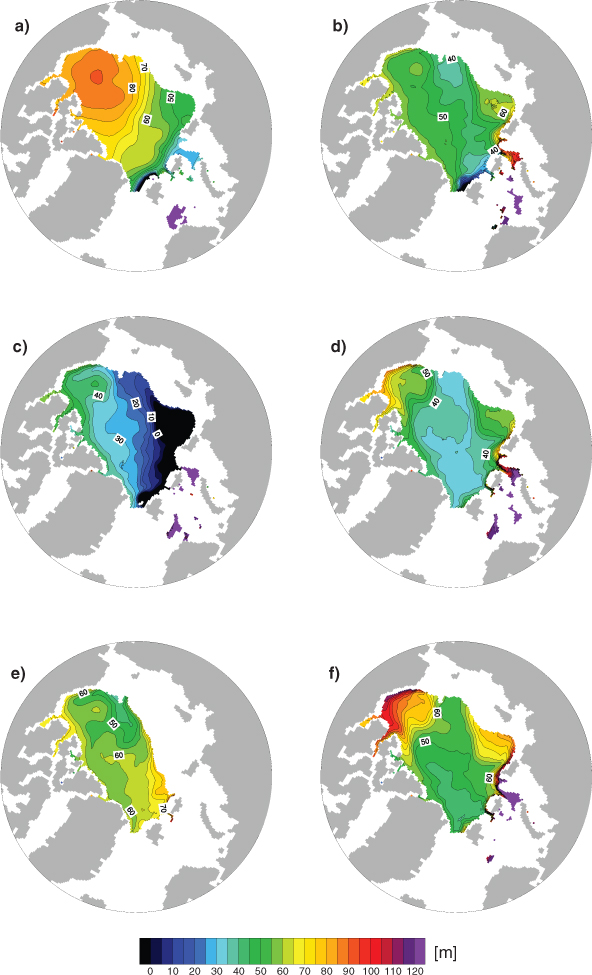
Fig. 10
Mass-centred depth distributions Z in m for: (a) PHC (Polar Science Center Hydrographic Climatology 3.0) freshwater (FW), (b) model FW, (c) sum of all passive tracers, (d) Eurasian runoff tracer, (e) Pacific water tracer and (f) net sea-ice melt (NSIM) tracer. Note that regions with depths shallower than the integration depth 256 m, as well as, regions with FW/tracer inventories lower than 0.5 m, have been masked out.
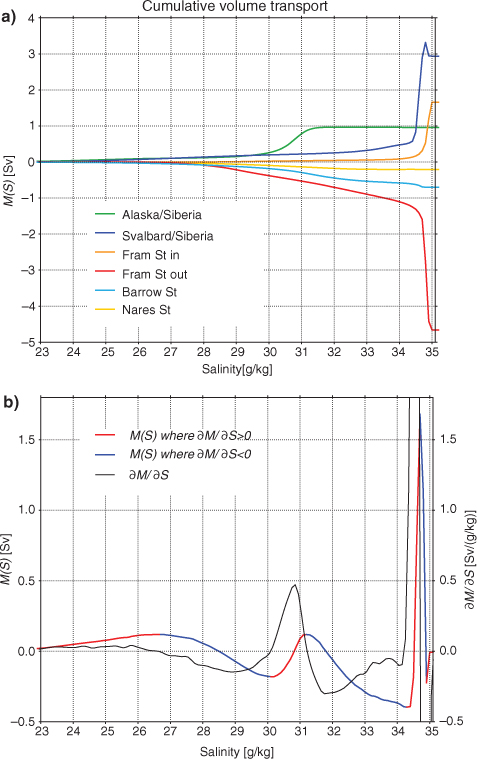
Fig. 11
(a) The cumulative transport functions M(S) across the lateral boundaries around the central Arctic Ocean (see Fig. 1) for the period 1968–2011. (b) The red/blue curve is the net cumulative transport across all the boundaries in (a) and the black curve its smoothed gradient. Note that the red/blue regions in (b) correspond to a positive/negative gradient yielding a net inflow/outflow to the Arctic Ocean.
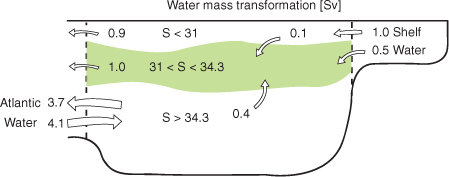
Fig. 12
Sketch showing the exchange between the exterior (the North Atlantic and Eurasian shelf regions) and the interior Arctic Ocean. It also shows exchanges between different layers within the central Arctic Ocean, where the layers are based on salinity ranges: Polar mixed layer (PML) 0 < S<31, halocline layer (HL) 31 < S<34.3 and Atlantic water (AW) layer S>34.3. Note that shelf water consists of both the Pacific water and low-salinity water modified by rivers on the Siberian shelf.
Table 2. Decomposition of water mass into 3 different salinity classes: polar mixed layer (PML) 0–31, halocline layer (HL) 31–34.3 and Atlantic water (AW) layer 34.3–35.5
0–310.80.20.0−0.5−0.3−0.10.131–34.30.20.30.0−0.6−0.3−0.1−0.534.3–35.50.02.51.6−3.6−0.10.00.40–35.51.02.91.7−4.7−0.7−0.20.0
Table 3. Tracer fluxes across the Alaska–Siberia and Svalbard–Siberia sections (see Fig. 1) decomposed into 2 different salinity classes: polar mixed layer (PML) 0–31 and halocline layer (HL) 31–34.3
Salinity range 0–31.0
Eurasian runoff11875PW590NSIM−25−24Sum of all15755Salinity range 31.0–34.3
Eurasian runoff014PW140NSIM−1−2Sum of all1312