
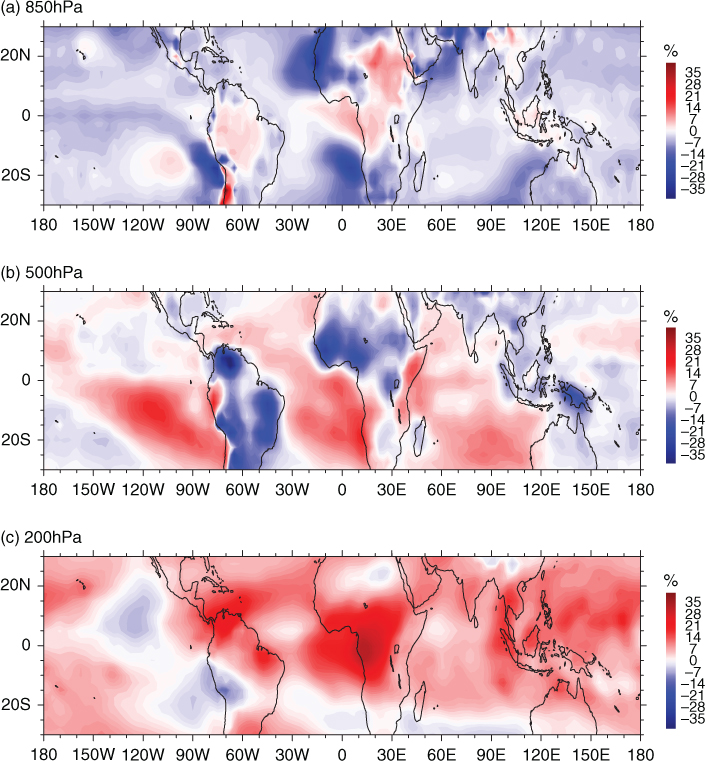
Fig. 1
Mean relative differences (i.e. ERA-interim minus ERA-40 relative to ERA-interim) for specific humidity Q in the tropics (±30°) at (a) 850 hPa, (b) 500 hPa, and (c) 200 hPa for the period January 1979 to August 2002.
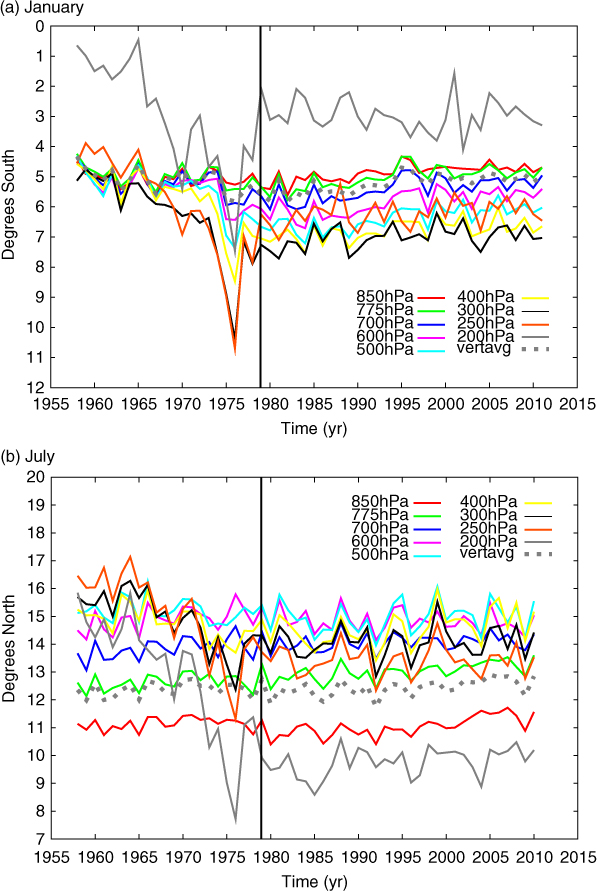
Fig. 2
Zonal mean meridional maximum location of specific humidity for single pressure levels in (a) January and (b) July. The dashed line indicates the estimated locations using the vertically averaged humidity fields including all shown levels. The transition from ERA-40 to ERA-interim reanalysis data is marked by the solid vertical line in 1979.
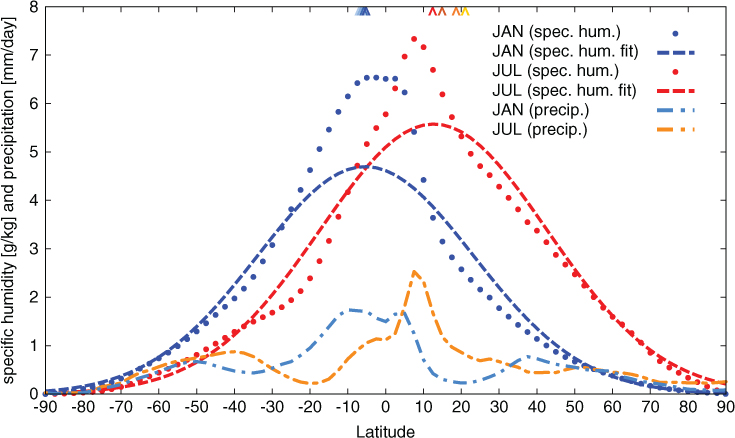
Fig. 3
Zonal mean distribution of observed specific humidity (weighted using k=0.95), the estimated Gaussian fit and the zonal mean precipitation represented by ERA-interim reanalysis data over the time period from 1979 to 2010 for January and July. The circumflexes denote the estimated Gaussian maxima for the weighting factor k=0.95, 0.80, 0.50, 0.00 for January (blueish) and July (reddish); colours are chosen from dark (k=0.95) to light (k=0.00), where the latter equals no weighting.
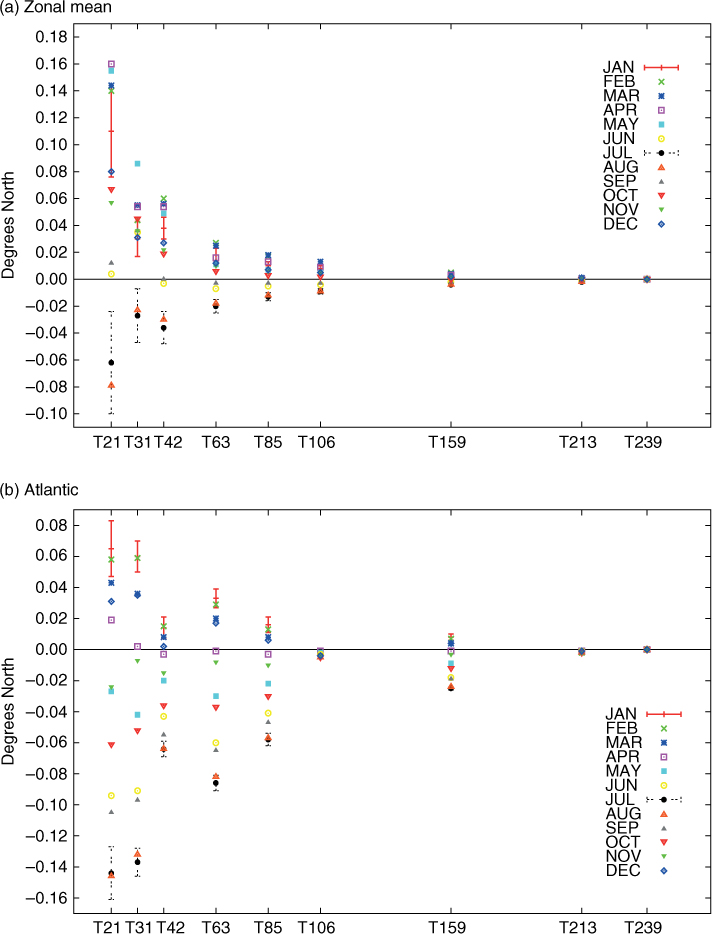
Fig. 4
Mean deviations of (a) zonal mean and (b) Atlantic (10°W to 60°W) specific humidity maximum location relative to T239 resolution for ERA-interim data from January 1979 to December 2010. To scale the x-axis, the number of meridional grid points is used. For January and July, one standard deviation of the error relative to T239 is indicated by the error bars.
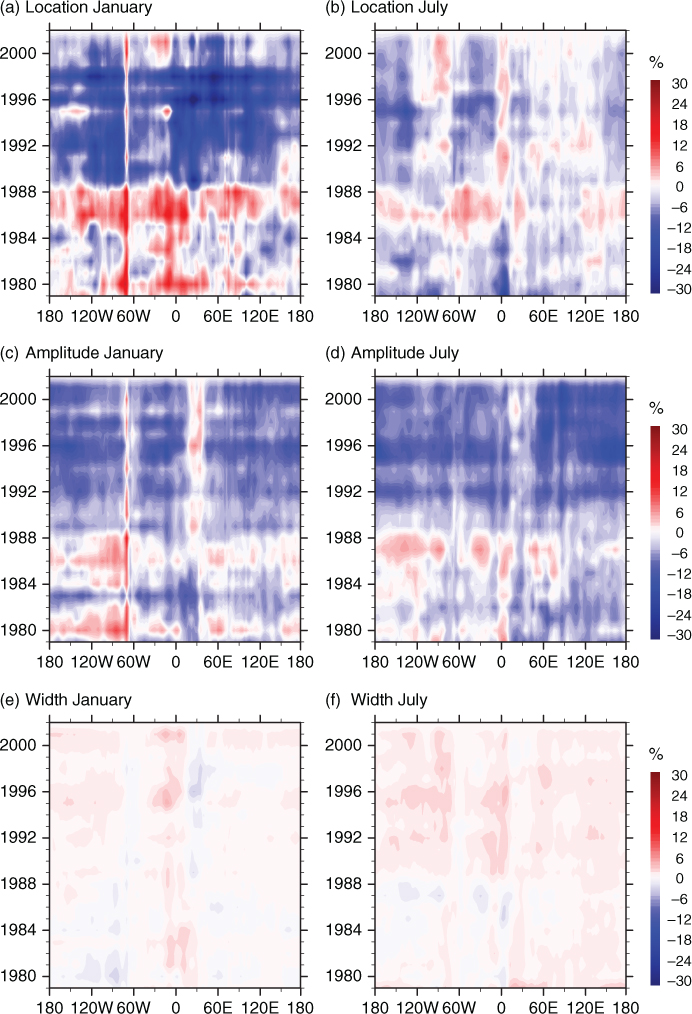
Fig. 5
Hovmoeller diagrams of the relative differences (i.e. ERA-interim minus ERA-40 relative to ERA-interim) of the location, amplitude, and width estimates according to the introduced method using specific humidity in (a), (c), and (e) for January, (b), (d), and (f) for July.
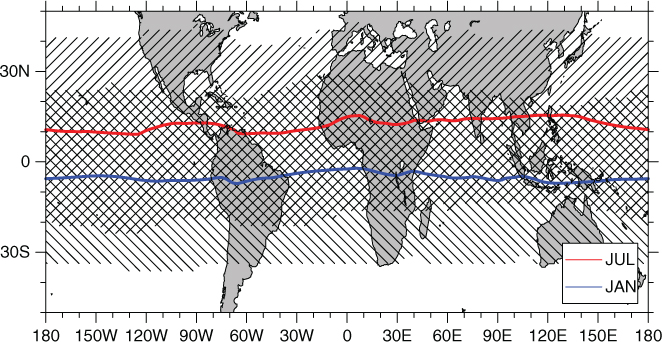
Fig. 6
Estimated mean location during January (blue) and July (red) estimated using ERA-interim reanalysis data from 1979 to 2010. The shaded areas indicate the width of the according Gaussian fit.
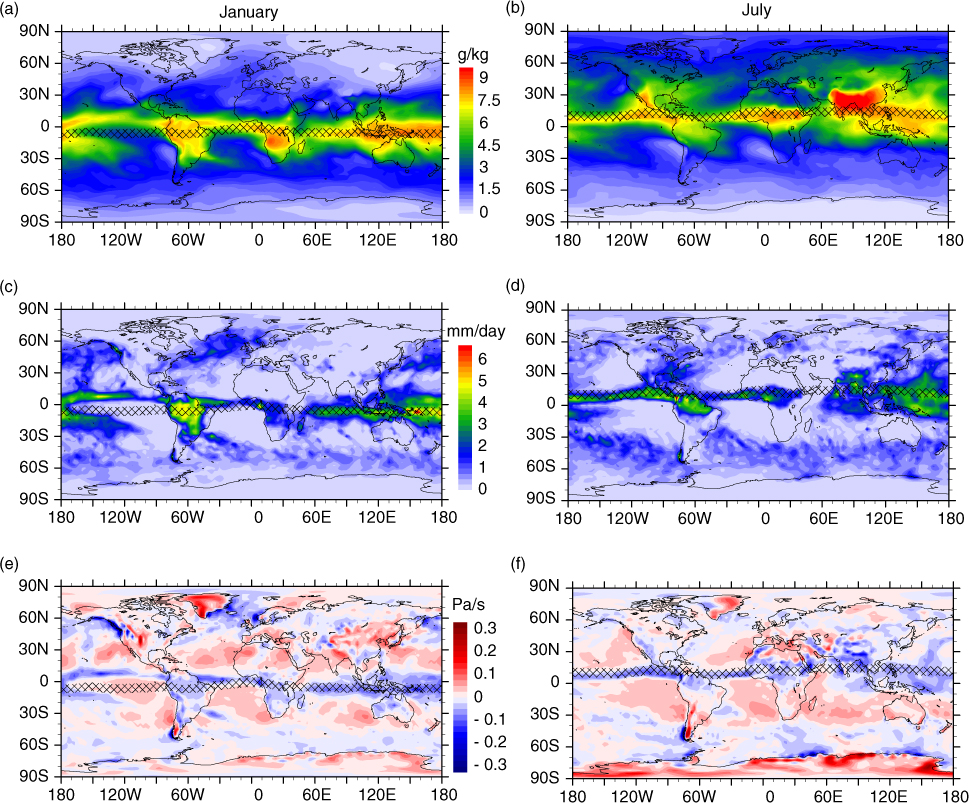
Fig. 7
Monthly means of specific humidity (a, b), daily precipitation (c, d) and vertical wind component (e, f) for January and July 1990, respectively. The stippled area indicates the 99% threshold of the estimated Gaussian distribution maximum.
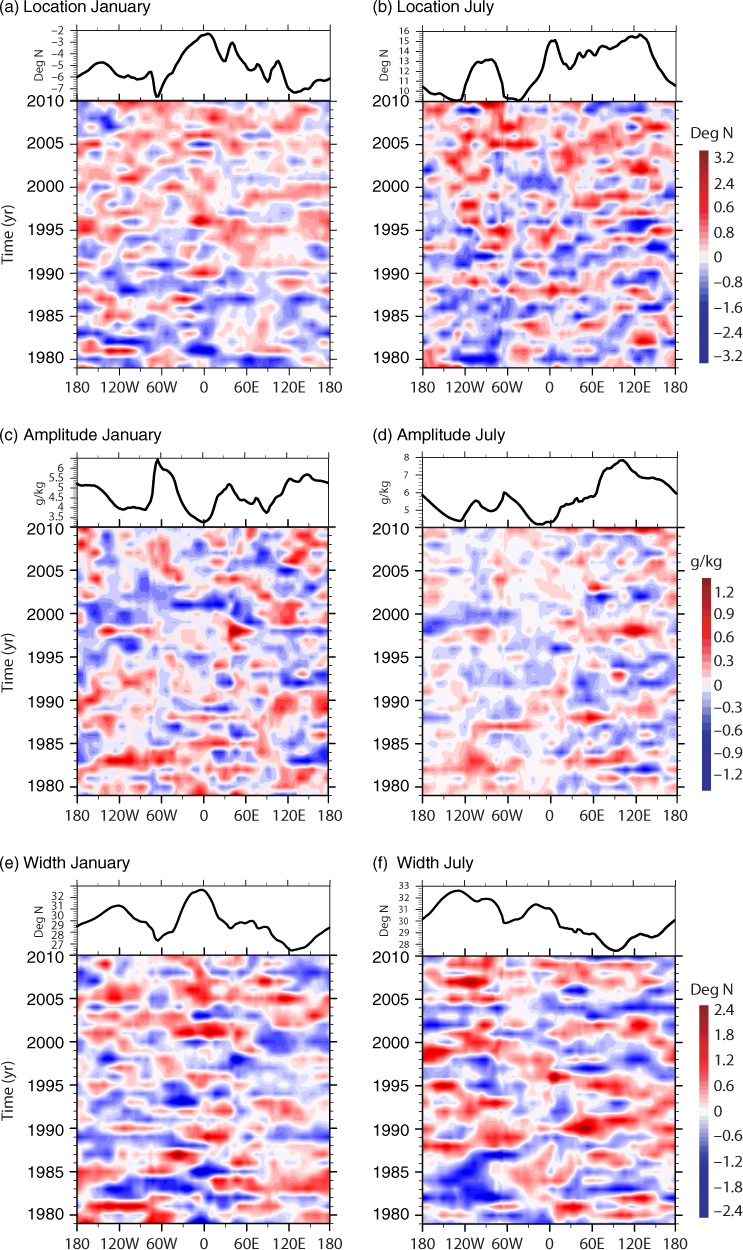
Fig. 8
Long-term mean (top of panel) and Hovmoeller diagrams of deviations (bottom of panel) for January (left) and July (right): (a, b) meridional location, (c, d) amplitude, and (e, f) width estimates using ERA-interim specific humidity Q from 1979 to 2010.
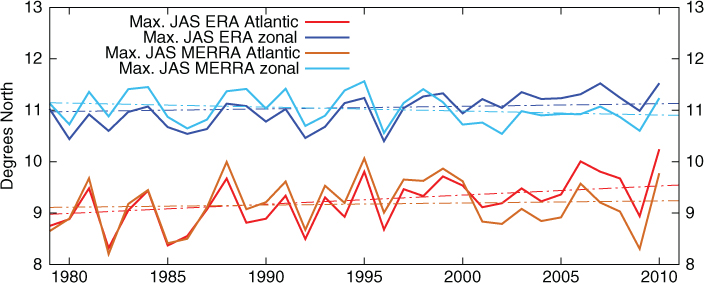
Fig. 9
Estimated zonal and Atlantic (10°W to 60°W) maximum location (solid) and trends (dash-dotted) for vertically averaged (850, 775, 700, 600, and 500 hPa) ERA-interim (blue; red) and MERRA (cyan; orange) specific humidity field in JAS.