Fig. 1.
Location of tide gauges over the Baltic Sea.
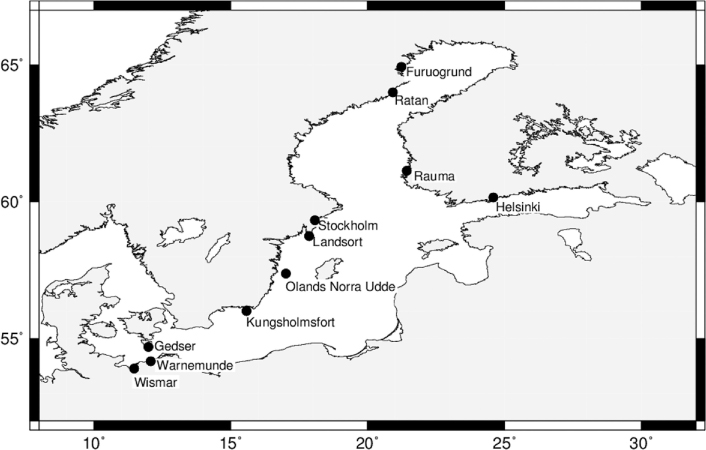
Table 1. Analysed tide gauge records
Fig. 2.
Time-series of MSL for each location after removing the GIA trend and the mean from the original records.
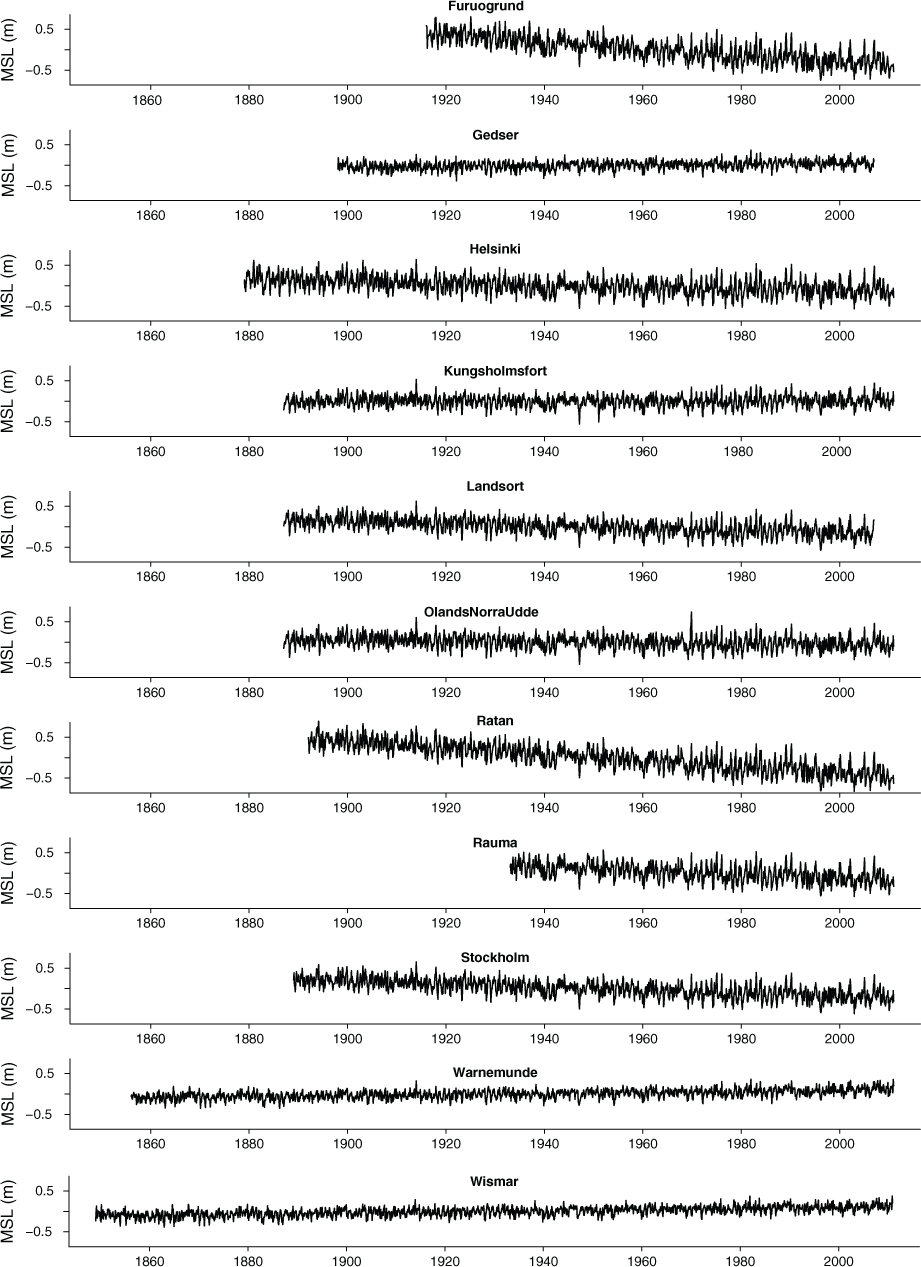
Fig. 3.
MRA decomposition of MSL in Furuogrund. From top to bottom: D1-D6 wavelet coefficients associated with time-scales of 2 j to 2 j+1 months (j=1, 2,…, 6); S6 scaling coefficients (smooth), corresponding to time-scales above 27 (128) months. Vertical dashed lines mark the regions at the beginning and end of the series that are affected at least to some degree by boundary conditions.
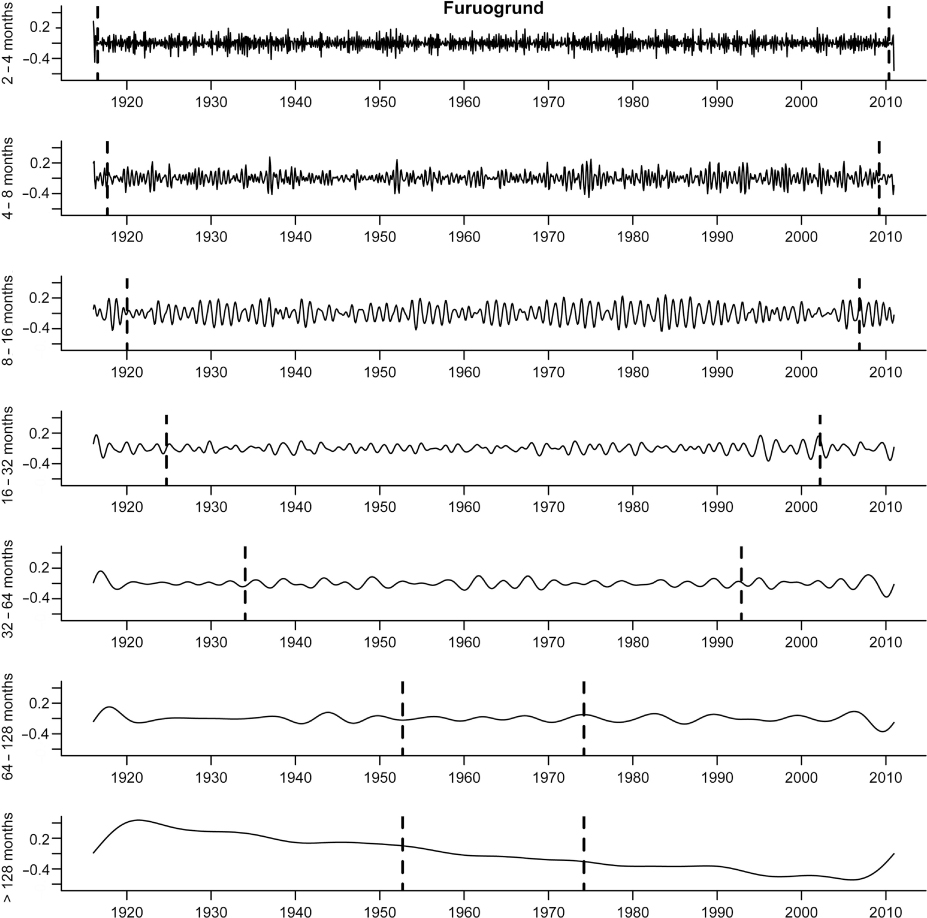
Fig. 4.
Normalised empirical variance (%) of MSL in Furuogrund. The dashed lines indicate the 95% confidence interval.
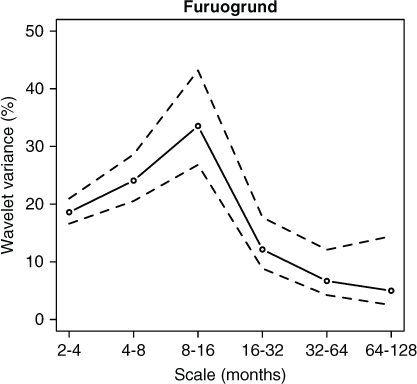
Fig. 5.
MSL annual amplitude during the period 1916–2010 for Furuogrund.
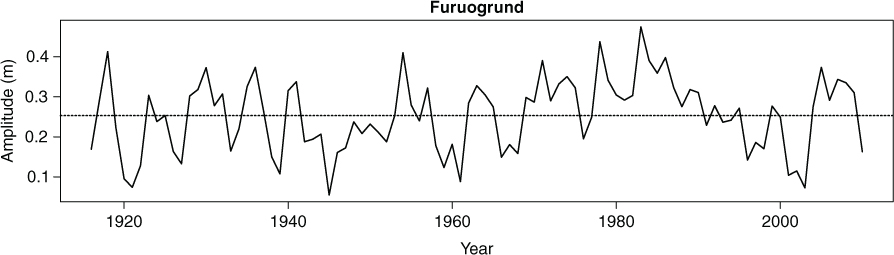
Fig. 6.
As in Fig. 3, but for NAO time-series. Vertical dashed lines mark the regions at the beginning and end of the series that are affected at least to some degree by boundary conditions.
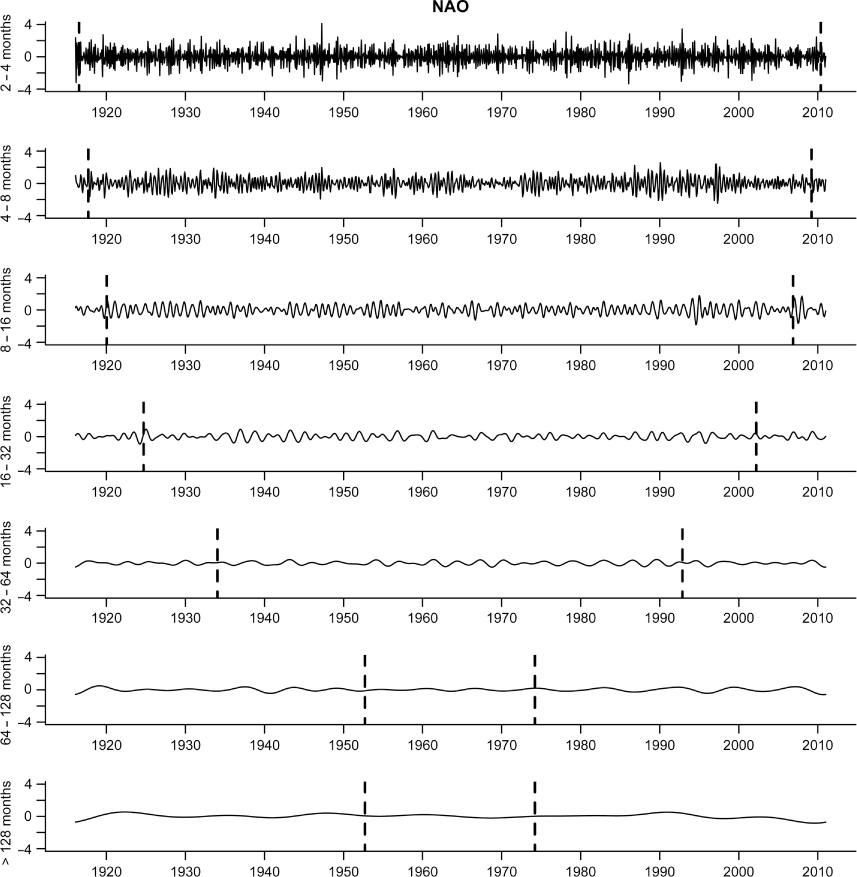
Fig. 7.
As in Fig. 4, but for the NAO time-series. The dashed lines indicate the 95% confidence interval.
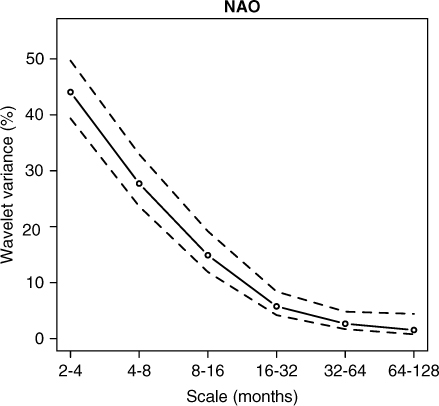
Fig. 8.
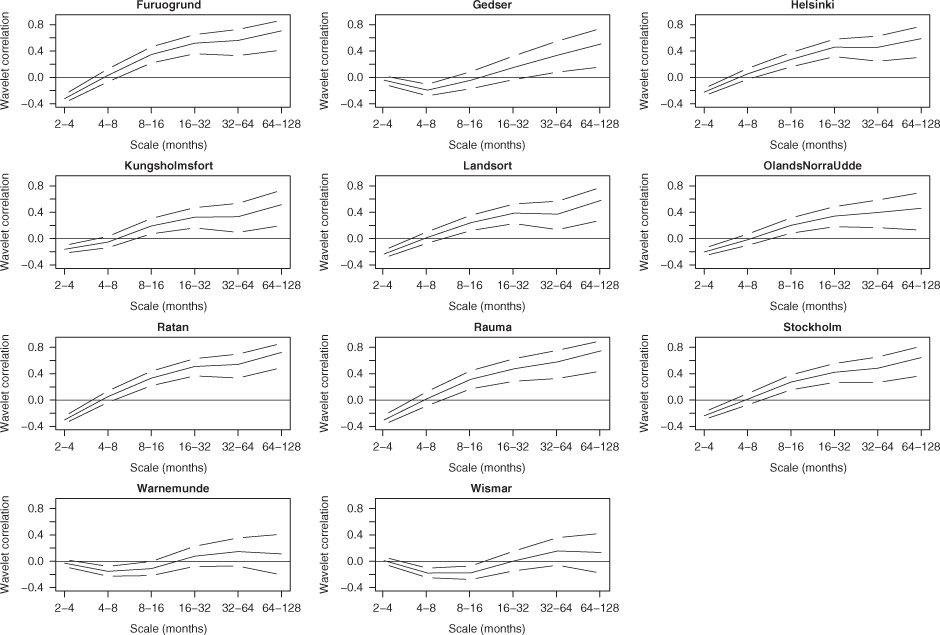
Wavelet correlation between MSL in Furuogrund and NAO for scales of 2 j to 2 j+1 months (j=1, 2,…, 6). The dashed lines indicate the 95% confidence interval.
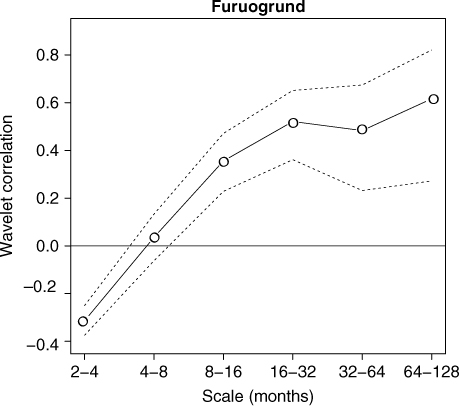
Fig. 9.
As in Fig. 5 but for all MSL records.
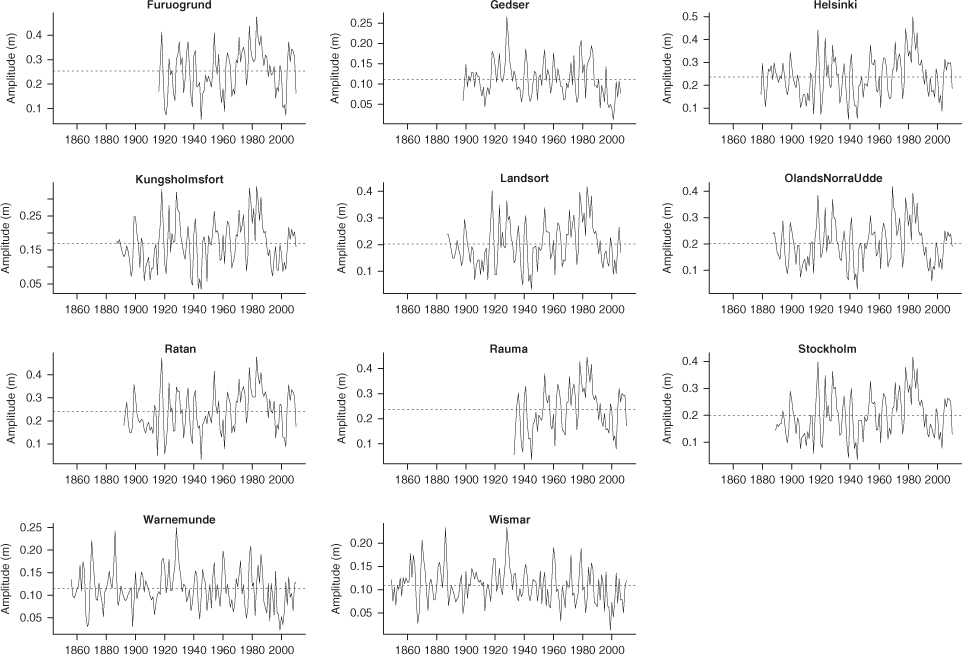
Fig. 10.
As in Fig. 8 but for all MSL records. The dashed lines indicate the 95% confidence interval.