
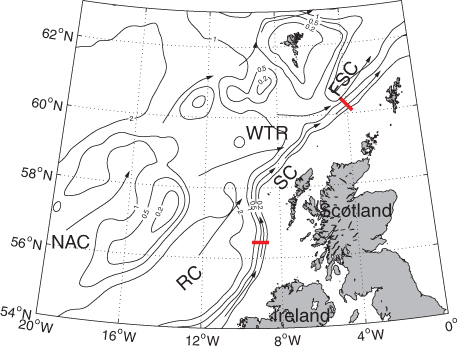
Fig. 1
Bottom topography (km) and schematic surface flow (black arrows) in the North-East Atlantic. The major topographic characteristics and flows are marked with their initials. RC—Rockall Channel, WTR—Wyville-Thomson Ridge, FSC—Faroe–Shetland Channel, NAC—North Atlantic Current, SC—Slope Current. The red bars represent two cross-slope hydrographic sections examined in this study: the RC-section (lower) and the FSC-section (upper).
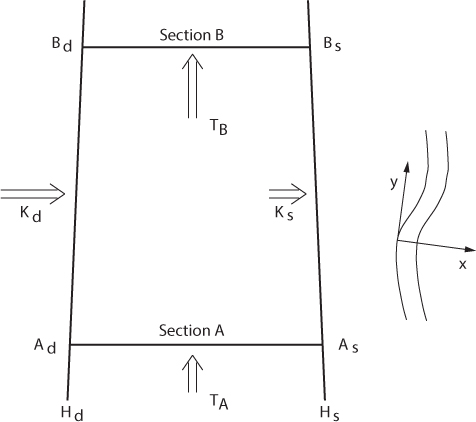
Fig. 2
Illustration of a box area over a slope. x and y are the cross-slope and along-slope coordinates respectively.
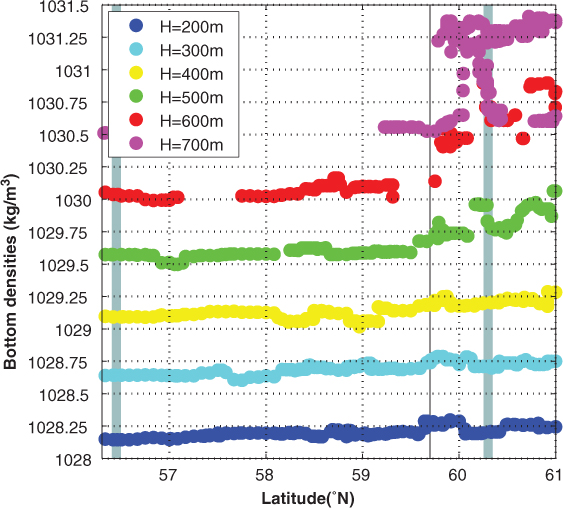
Fig. 3
Bottom densities against latitudes along each isobath. Black lines indicate where the WTR meets the slope, and thick grey lines indicate the RC-section (left) and the FSC-section (right).
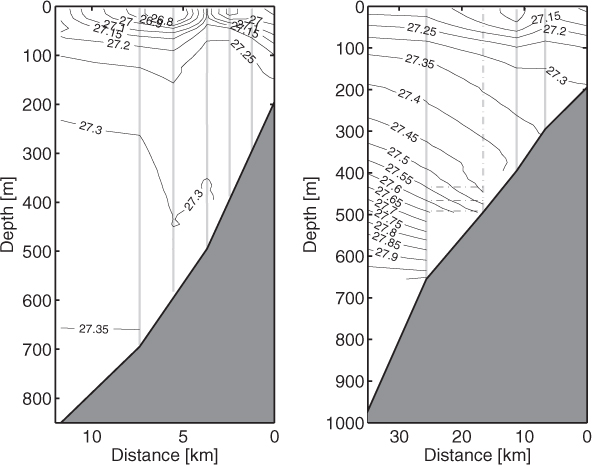
Fig. 4
Mean potential densities (kg/m3) from the CTD casts along the RC-section (left) and the FSC-section (right). In the left panel, grey vertical solid lines indicate the positions of the 700, 600, 500, 400 and 300m isobaths. In the right panel, grey vertical solid lines indicate the positions of the 660, 400 and 300m isobaths, while the dashed grey line indicates the 500m isobath above which there are no direct observations. Horizontal black dashed lines indicate constant densities extending from the 660m isobath to the 500m isobath below 400m.
Table 1. Estimated cross-slope transport change (ΔK) and along-slope transport change (ΔTρb , ΔT r) from the RC-section to the FSC-section within two neighbouring isobaths. Values in parenthesis are uncertainties
Transport changeE1E2400–300m300–200mΔK (Sv)−1.0 (±0.1)−0.61 (±0.04)−0.20 (±0.06)−0.07 (±0.03)ΔTρb (Sv)0.7 (±0.03)0.51 (±0.04)0.18 (±0.06)0.07 (±0.03)ΔTr (Sv)0.25 (±0.01)0.12 (±0.01)0.01 (±0.01)0.0005 (±0.005)