
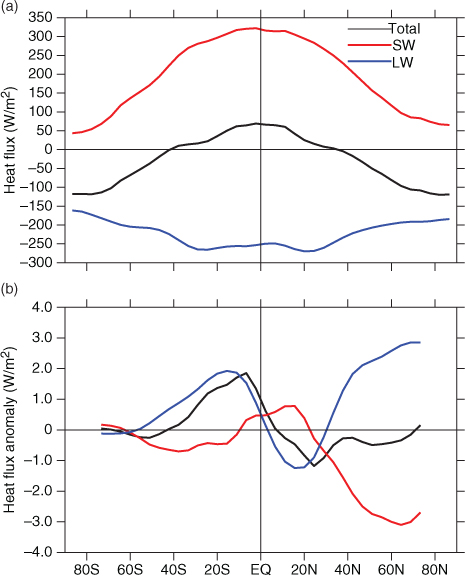
Fig. 1
(a) The net radiation flux (black), the net downward short wave (SW) (red) and net outgoing long wave (blue) at the top of atmosphere (TOA). (b) The changes of the TOA radiation flux in the WH experiment. Black, red and blue are for net total, SW and LW, respectively. The mean values from the control run have been subtracted. All data used in this paper is averaged over the last 200 years of the 2000-yr run.
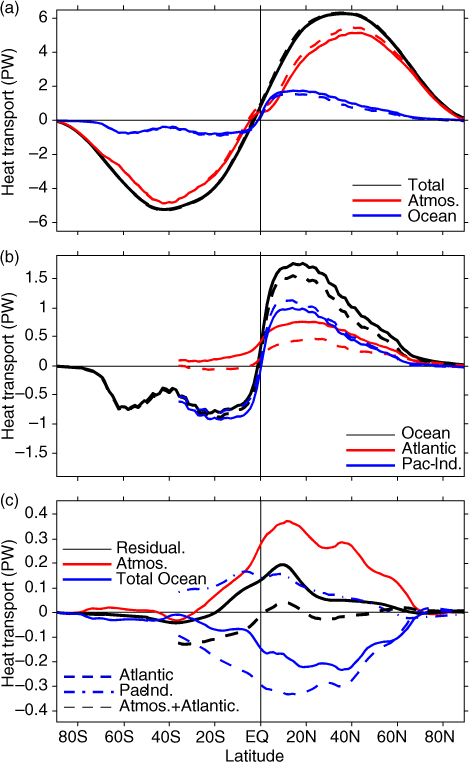
Fig. 2
(a) Meridional heat transport of total (black), atmosphere (red), ocean (blue) in the control run (solid lines) and water hosing (WH) run (dashed lines); (b) Meridional ocean heat transport in control run (solid) and WH run (dashed). Black lines are for global oceans, red for the Atlantic and blue for the Indo-Pacific; (c) The changes of the meridional heat transport in the WH run. Solid red (blue) is for the atmosphere (global oceans) and solid black represents the sum of atmosphere and ocean. Dashed (dash-dotted) blue is for the Atlantic (Indo-Pacific) and the dashed black represents the sum of atmosphere and Atlantic ocean. Unit: PW, 1 PW = 1015 W.
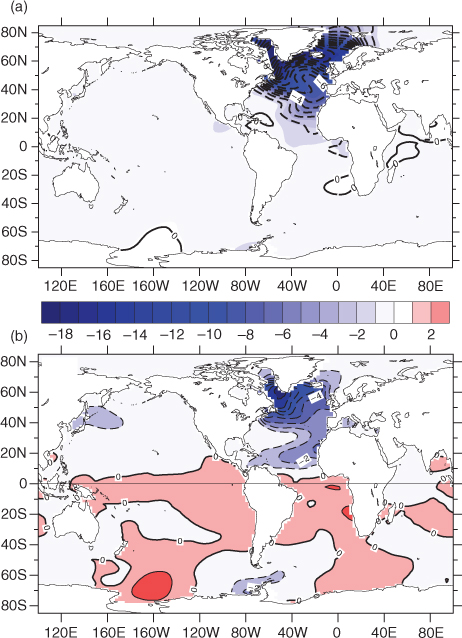
Fig. 3
(a) SSS (shaded) and surface density (contours) changes and (b) SST change in the WH run. The contour intervals (CI) are 1 psu, 1 kg/m3 and 1°C for SSS, density and SST, respectively. Mean values from the control run are removed.
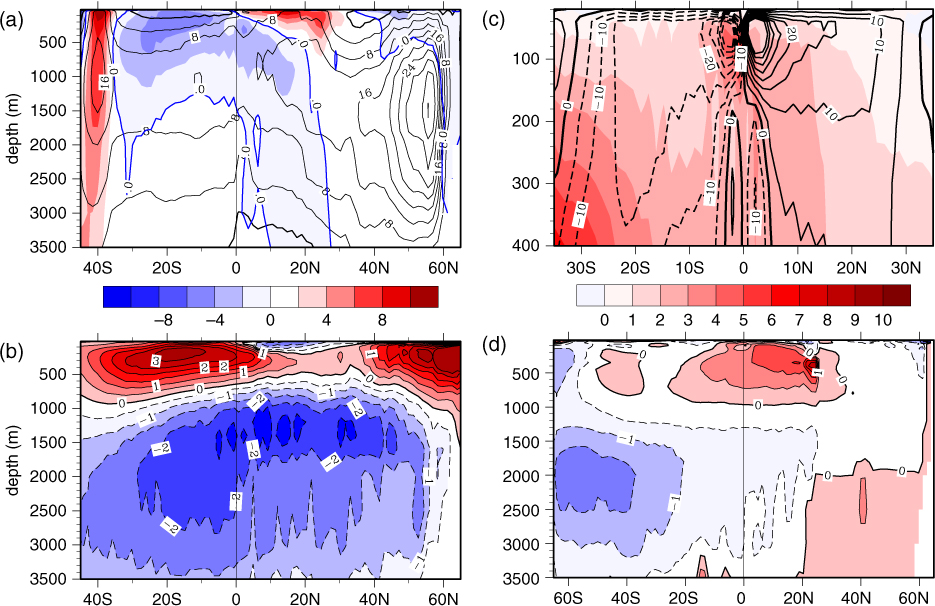
Fig. 4
(a) The mean Atlantic meridional overturning circulation (AMOC) in the control run (contours, CI=4 Sv) and in the WH run (shaded, CI= 2 Sv). (b) The latitude-depth section of zonal averaged Atlantic temperature change in the WH run (CI = 0.5°C). (c) The mean subtropical cell (STC) in the Indo-Pacific in the control run (contours, CI = 5 Sv) and the STC change in the WH run (shaded, CI = 1 Sv). (d) Same as (b) but for the Indo-Pacific.
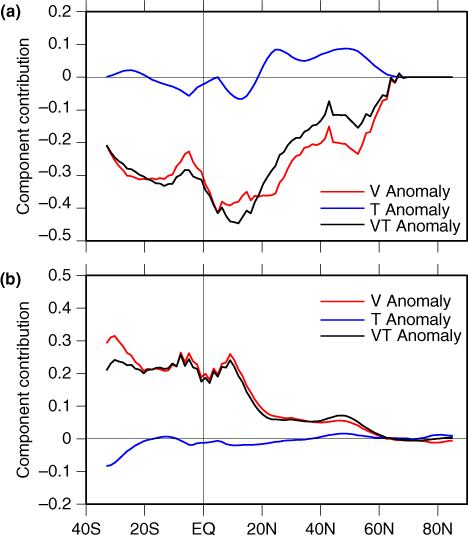
Fig. 5
The meridional OHT change in the (a) Atlantic and (b) Indo-Pacific in the WH run. The black line shows the total OHT change; the red (blue) line represents the OHT change due to the circulation change (the vertical temperature stratification change). Unit in PW.
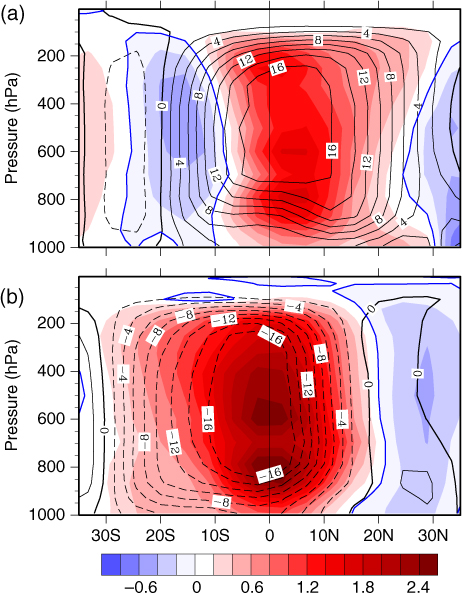
Fig. 6
The mean Hadley cell (HC) in the control run (contours, CI = 2×10¹⁰ kg/s) and the HC change in the WH run (shaded, CI = 0.2×10¹⁰ kg/s) in boreal (a) winter (DJF) and (b) summer (JJA). The blue lines show the zero contours of the mean HC.

Fig. 7
The Ekman transport change in the Atlantic (red line) and Indo-Pacific (blue line) in the WH run. The Ekman transport is calculated as the zonal and vertical integration of poleward meridional velocity. The depth of integration is determined by the location where the meridional velocity direction is opposite to that in the surface layer.