Fig. 1.
(a) Best track positions of Hurricane Katrina (Adapted from Knabb et al., 2005, Tropical Cyclone Report, Hurricane Katrina 20–30 August 2005). (b) Observed Intensity (NHC) for Hurricane Katrina in ms−1.
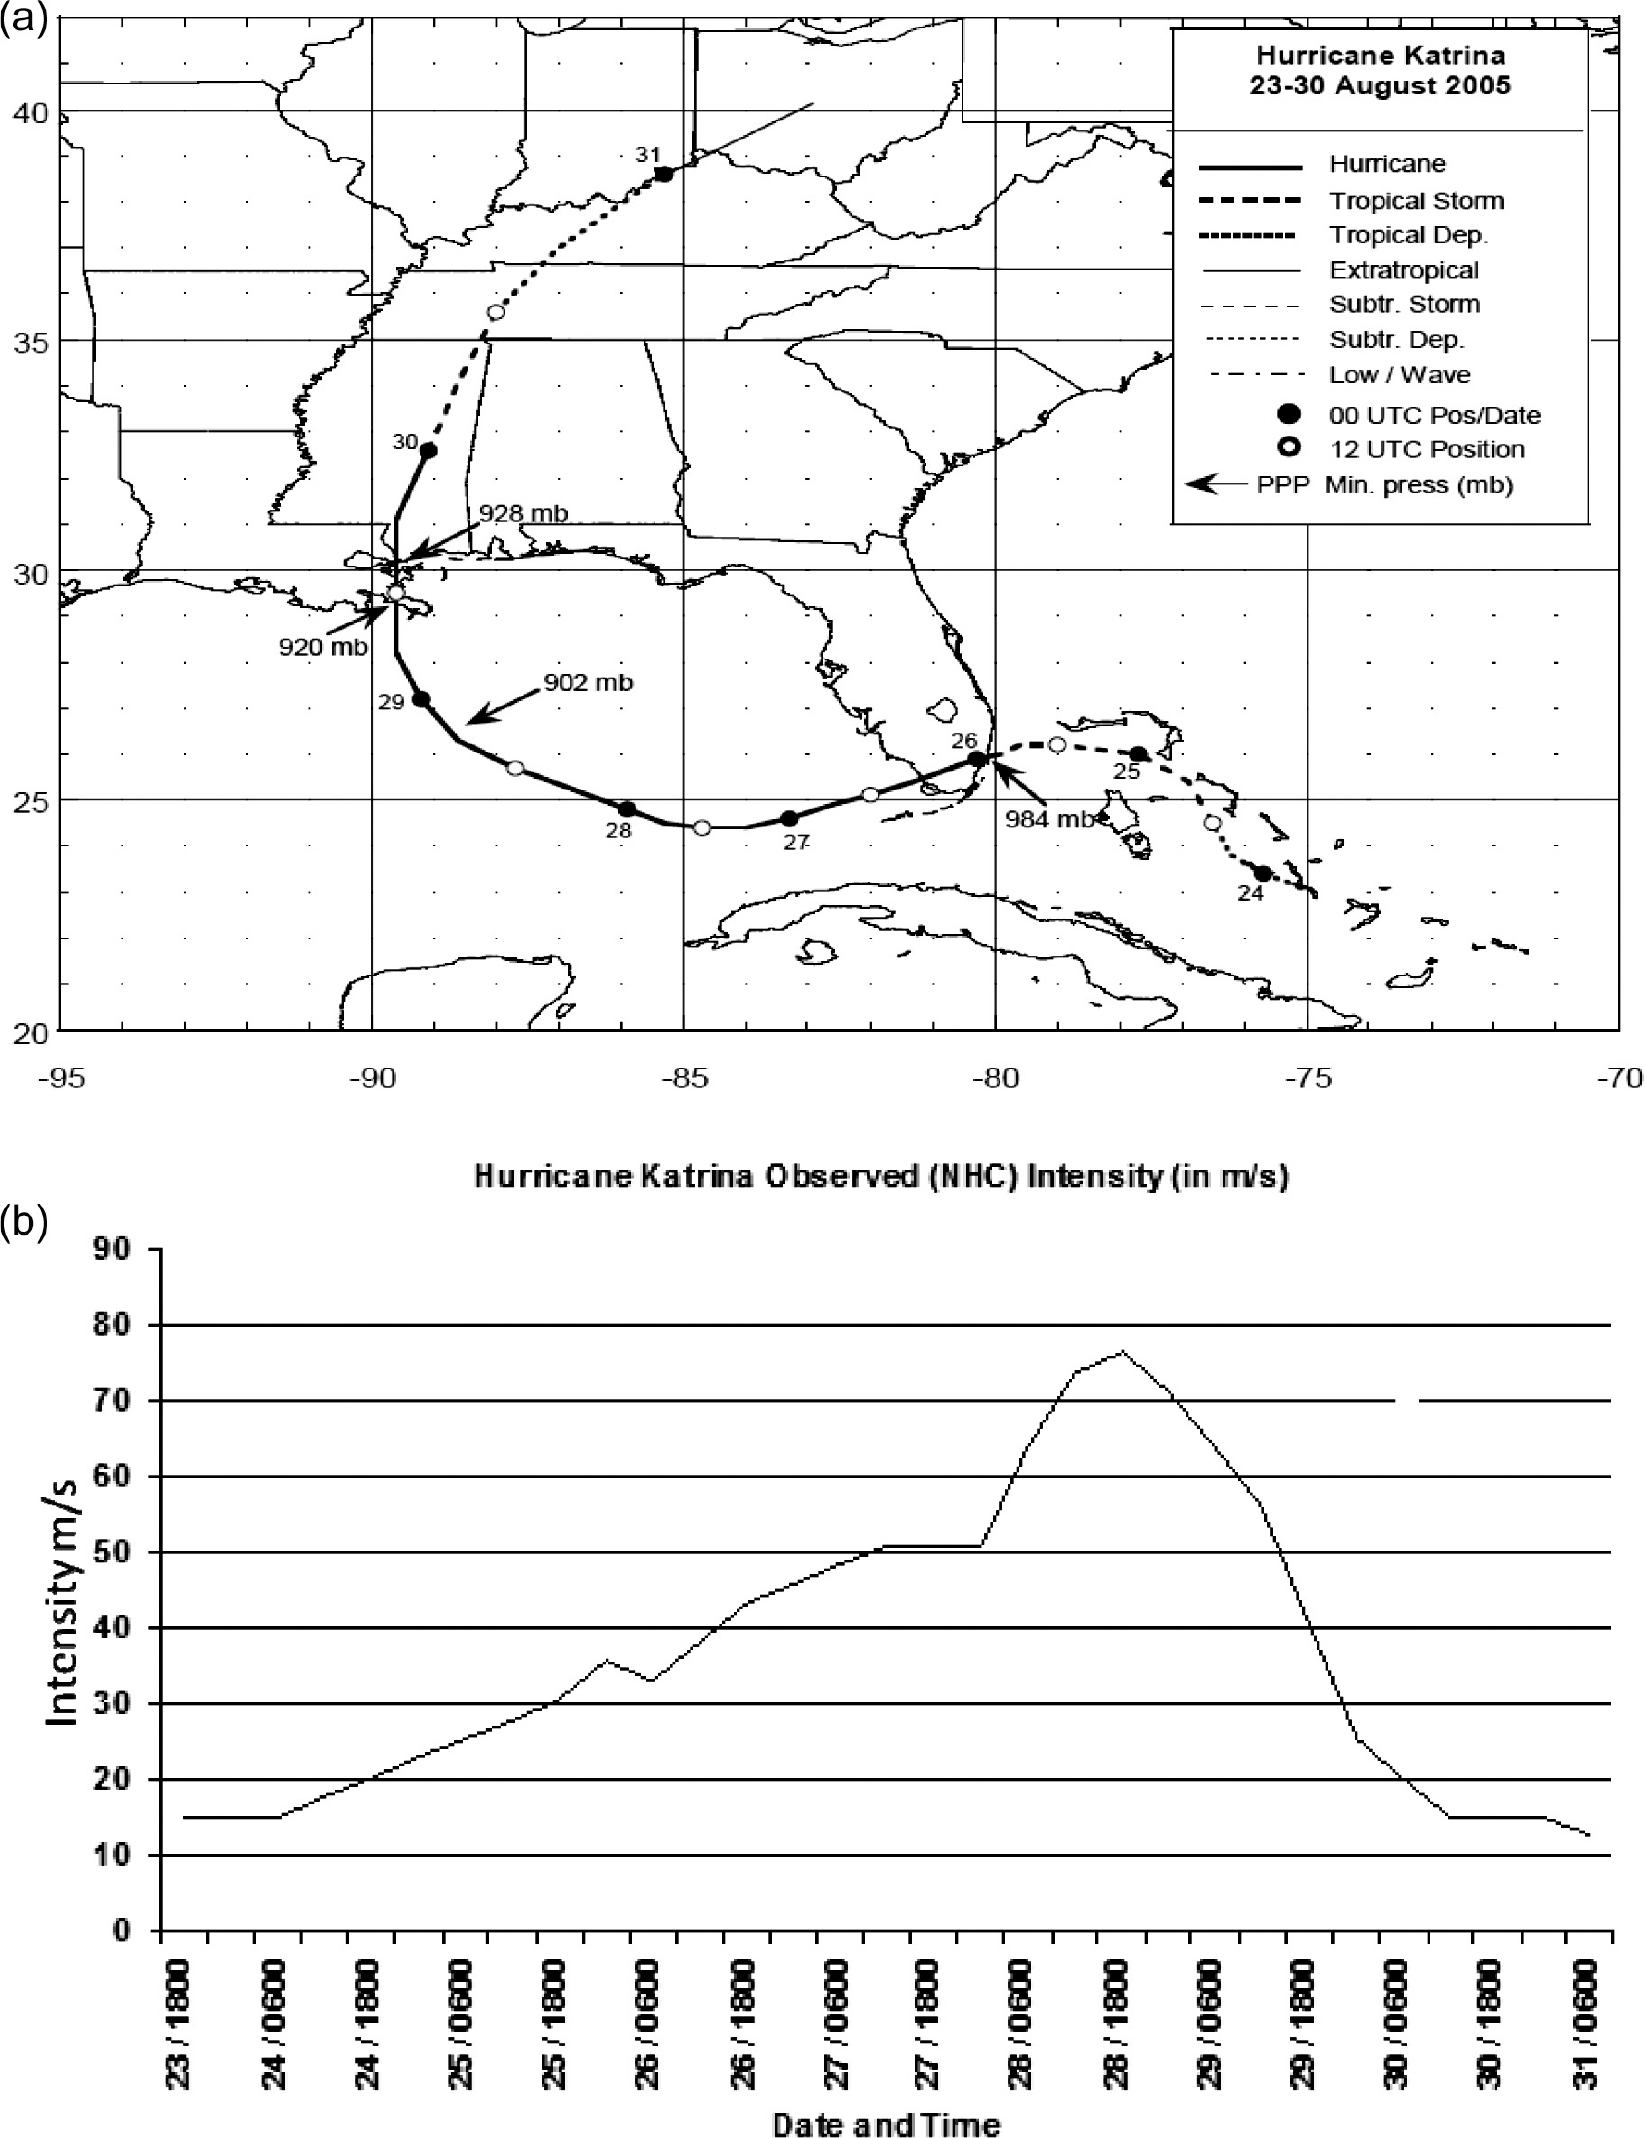
Fig. 2.
(a) Maximum 10-m wind and (b) minimum sea level pressure for forecasts of Katrina beginning 0000 UTC 27 August. Legend labels 1.33, 4 and 12 km refer to grid spacing of WRF ARW, version 2.1.2, using the Charnock drag relation. The forecast on a 12-km grid used the Kain–Fritsch parameterisation. The 4-km real time (grey dashed) refers to the forecast made in real time with an innermost nest of 4-km grid spacing. All retrospective forecasts were initialised with the GFDL initial condition. (c) The 10-m wind from WRF/AHW real-time forecasts (shaded) with contours of HWind analyses overlaid for hurricane Katrina. Predicted storm centre location at indicated valid times (below) is denoted by blue star in the figure. Wind fields from AHW forecasts have been shifted to observed locations to facilitate comparison. Model valid times is 1200 UTC 29 August (60-h forecast) (Adapted from Davis et al., 2008).
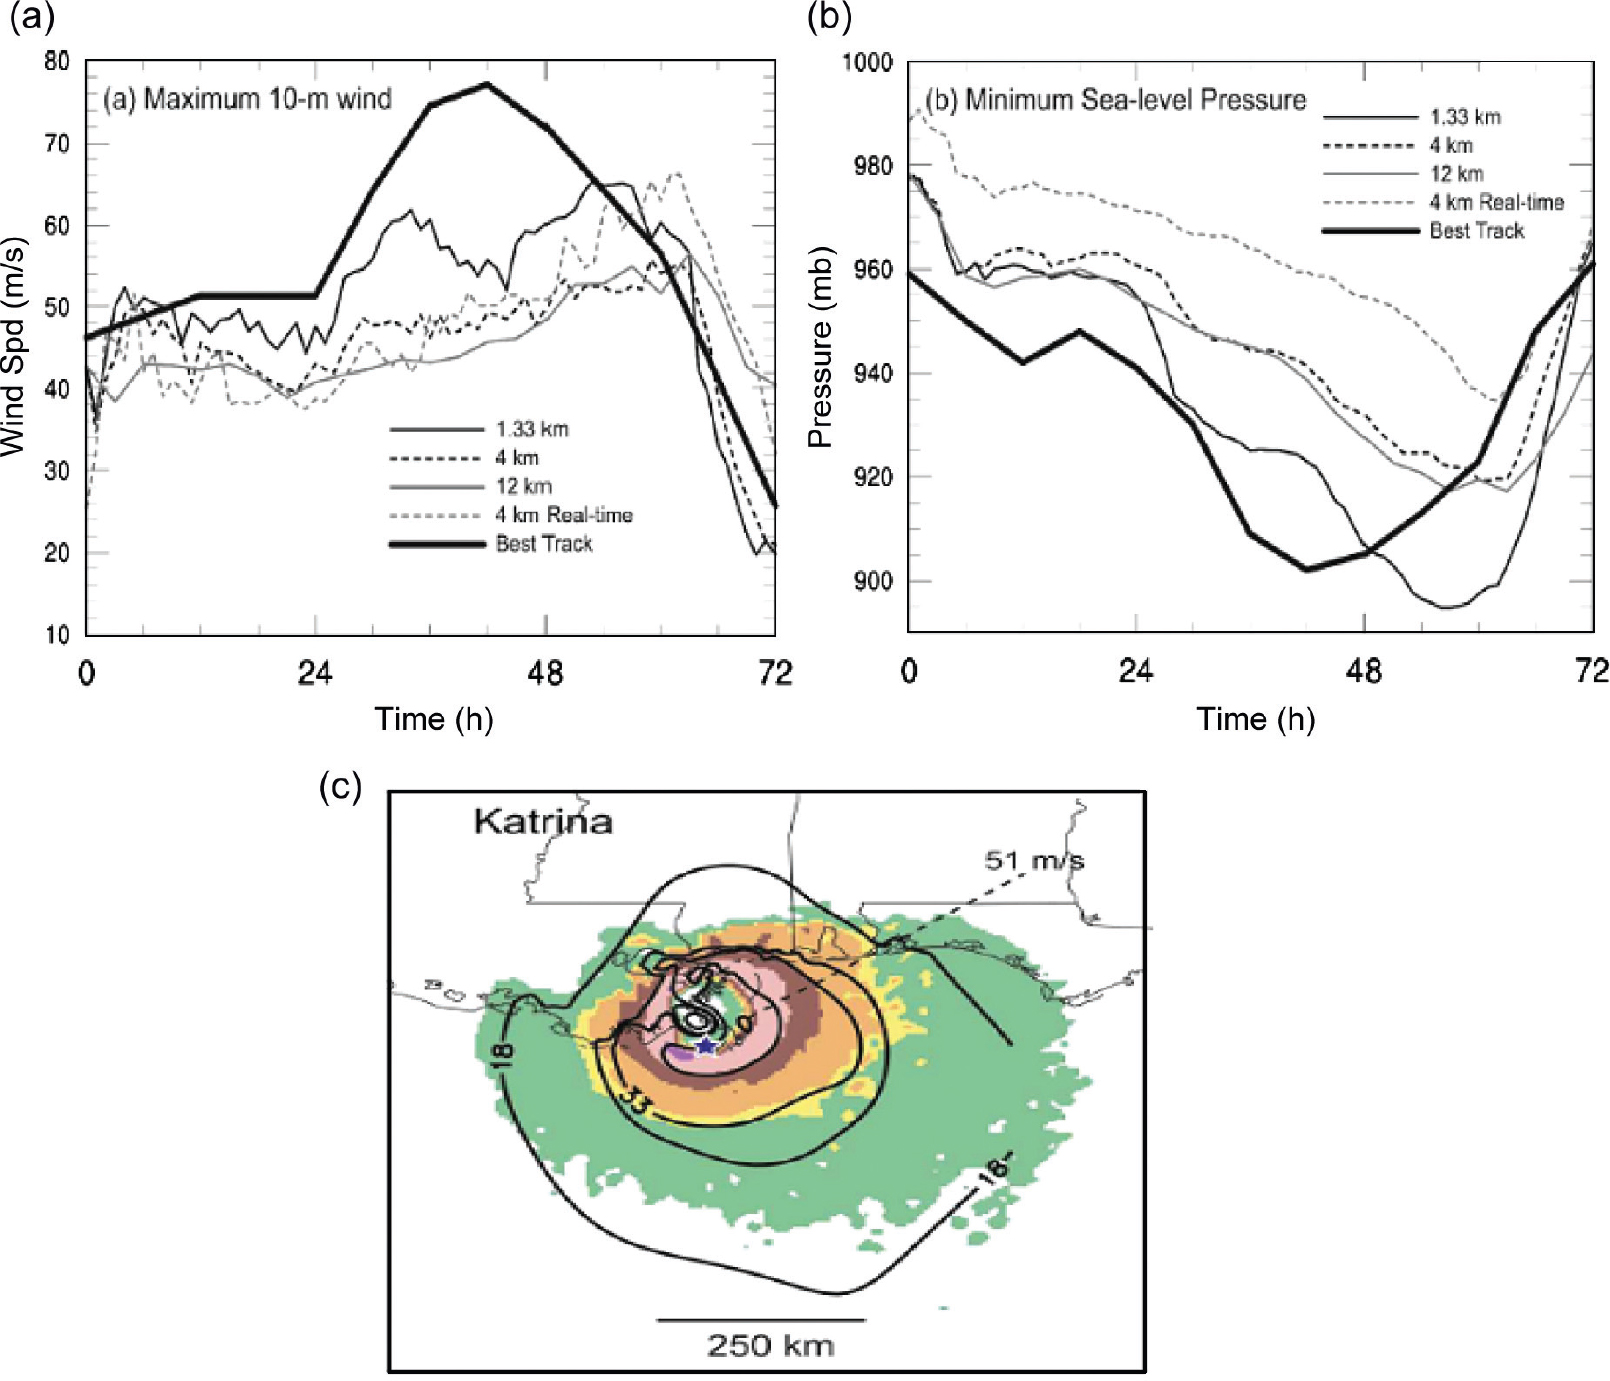
Fig. 3.
The life cycle of a deep convective cloud shown at different times (a) 1500 UTC 28 August 2005; (b) 1600 UTC 28 August 2005; (c) 1700 UTC 28 August 2005; (d) 1800 UTC 28 August 2005. The cloud outline is provided as the 0.0001 kg kg−1 isopleth.
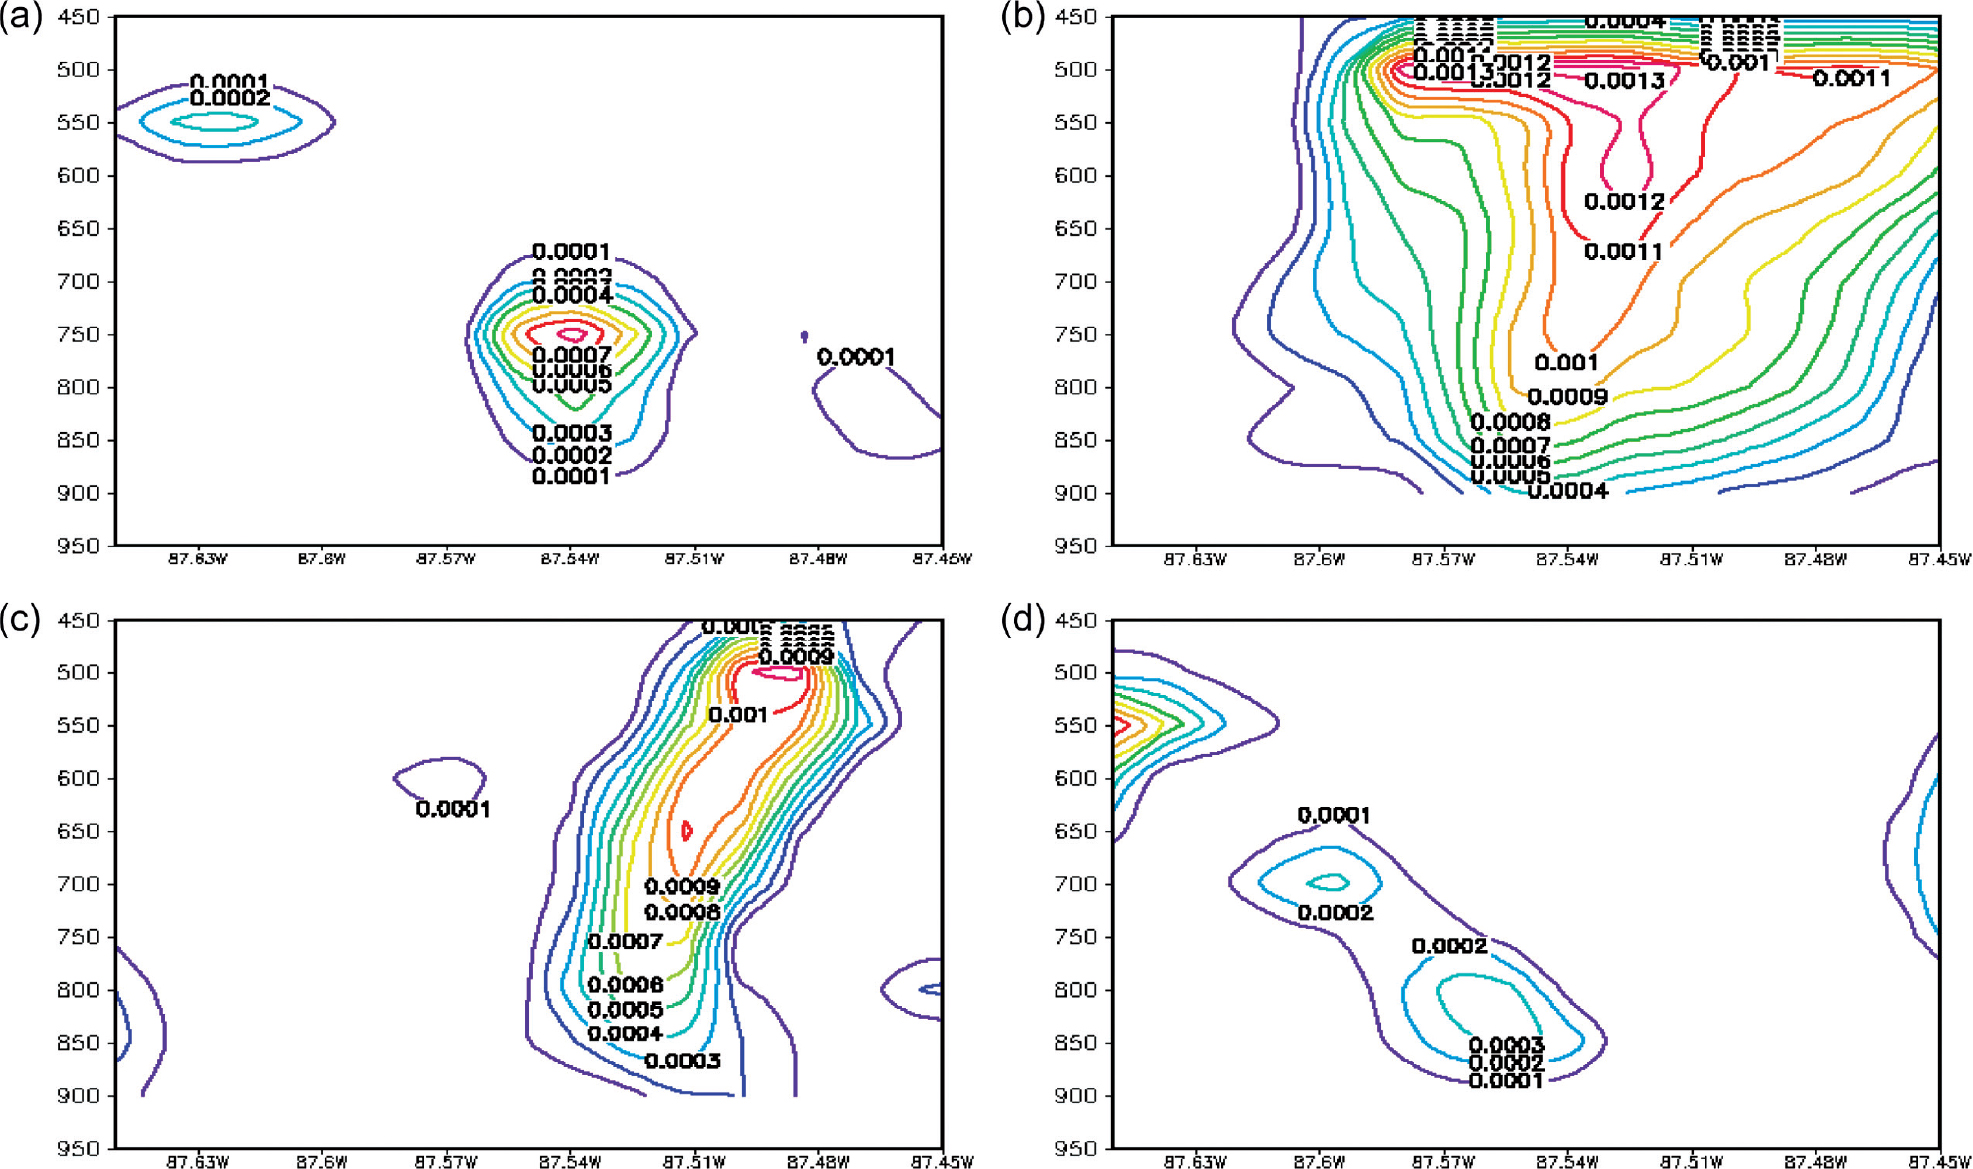
Fig. 4.
The hourly time history of vertically integrated liquid water from surface to 450 hPa levels for (kg kg−1) (a) 1500 UTC 28 August 2005; (b) 1600 UTC 28 August 2005; (c) 1700 UTC 28 August 2005; (d) 1800 UTC 28 August 2005.
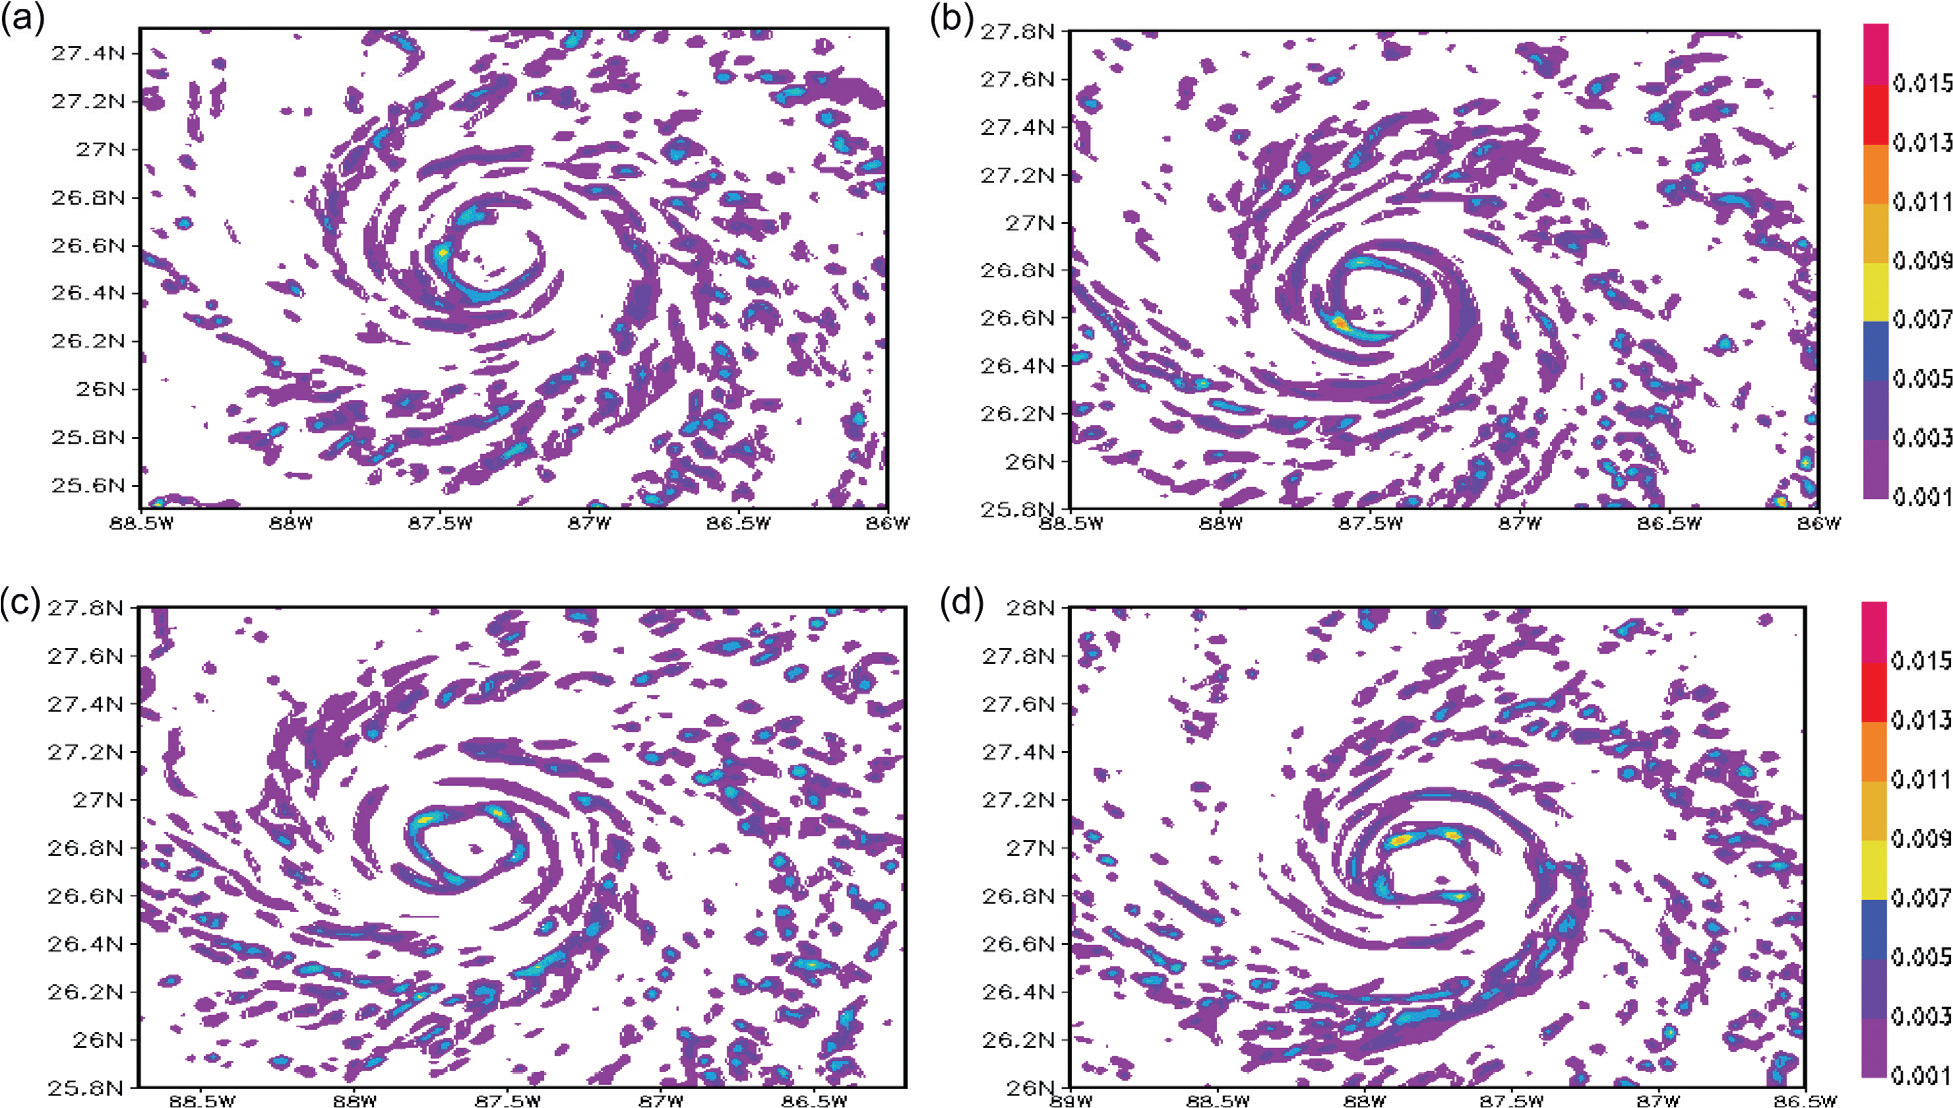
Fig. 5.
The typical hourly time history of divergence (s−1) at the 850 hPa level. (a) 1500 UTC 28 August 2005; (b) 1600 UTC 28 August 2005; (c) 1700 UTC 28 August 2005; (d) 1800 UTC 28 August 2005.
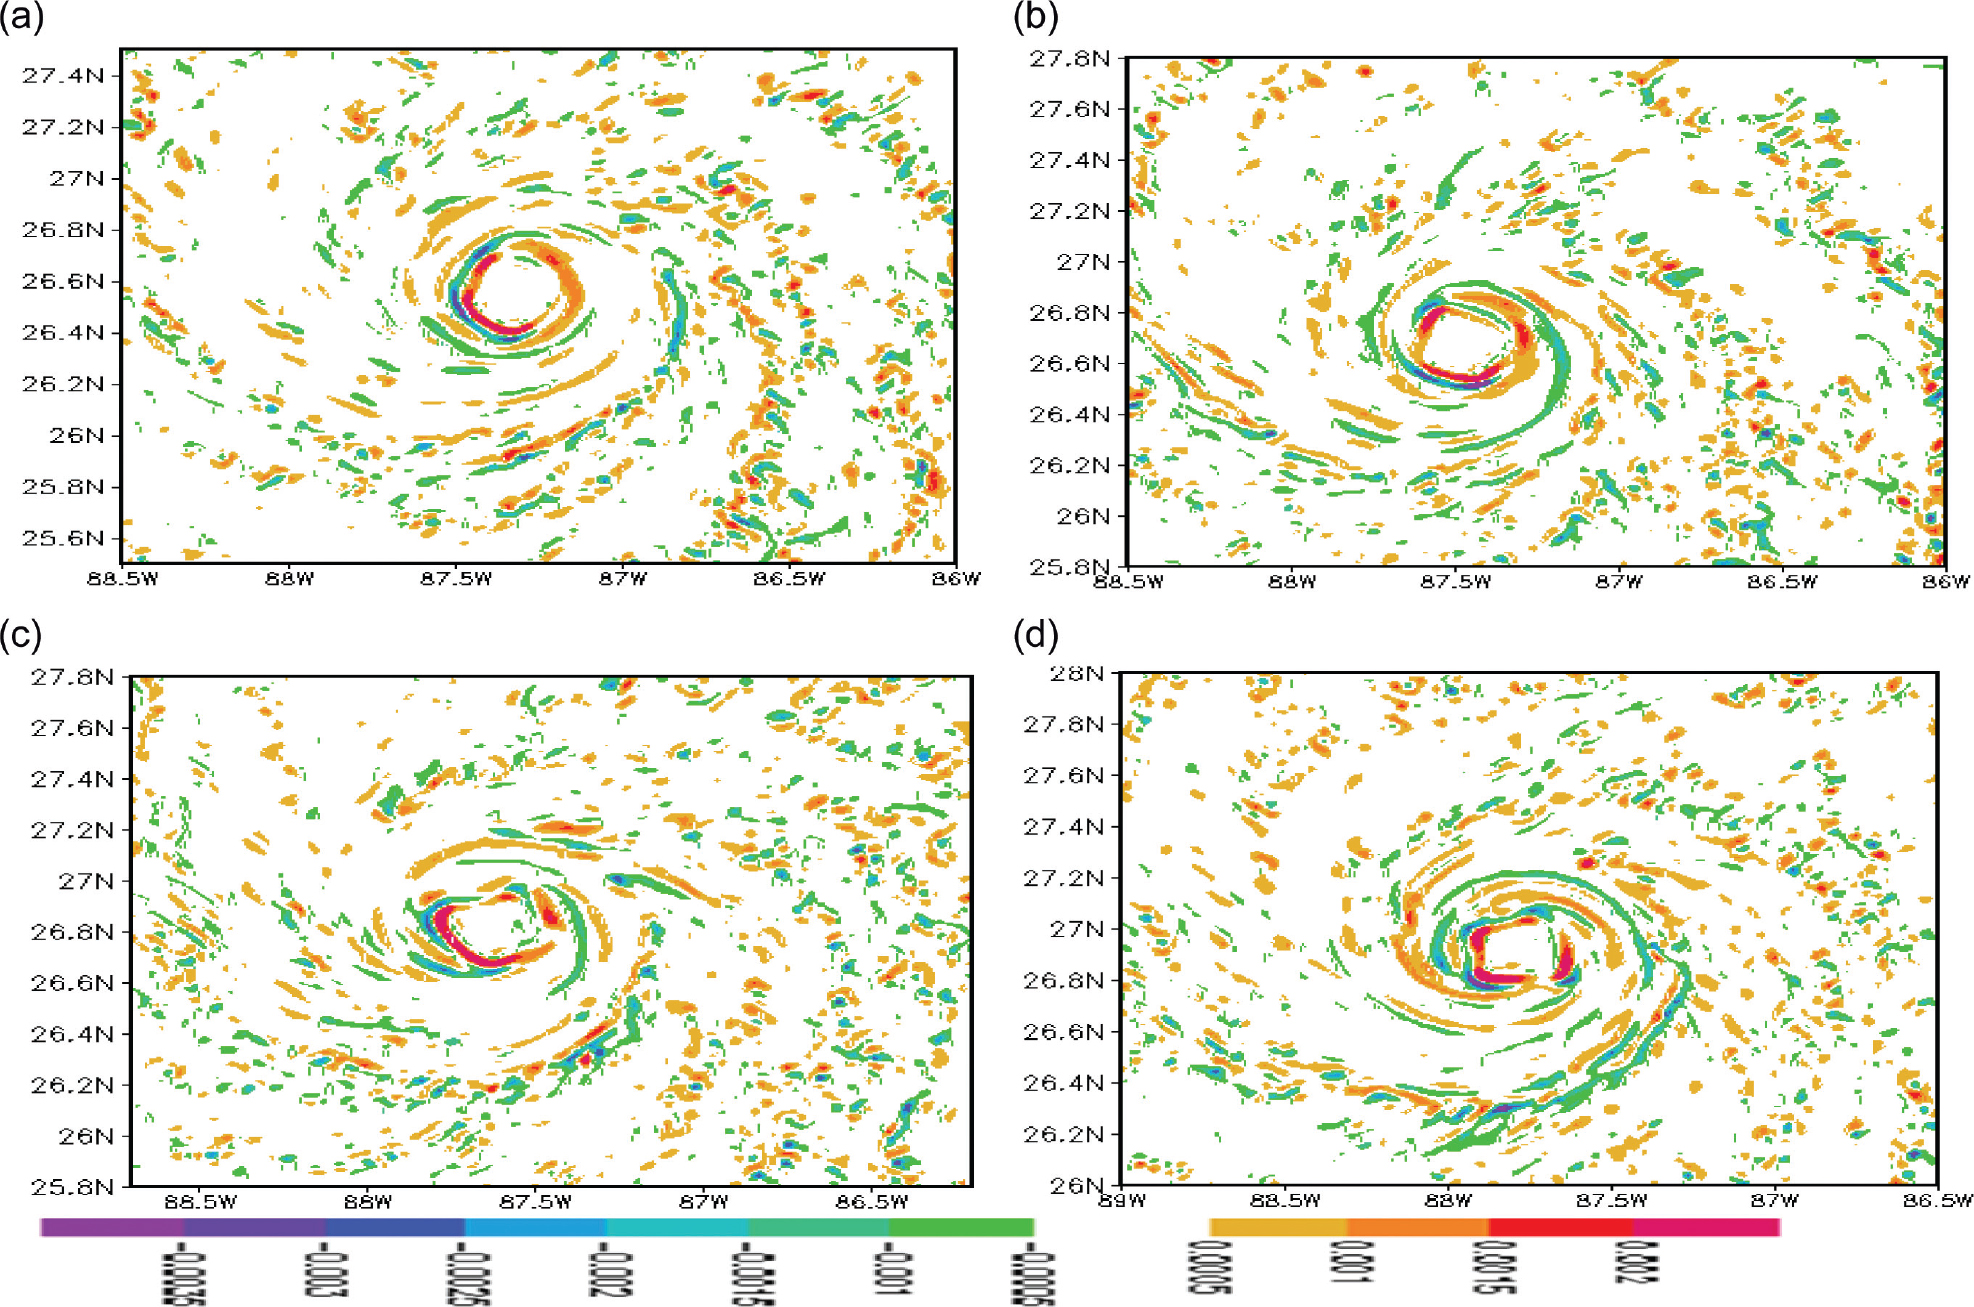
Fig. 6.
The typical hourly time history of non-balance (×10−5 s−2) at the 850 hPa level. (a) 1500 UTC 28 August 2005; (b) 1600 UTC 28 August 2005; (c) 1700 UTC 28 August 2005; (d) 1800 UTC 28 August 2005.
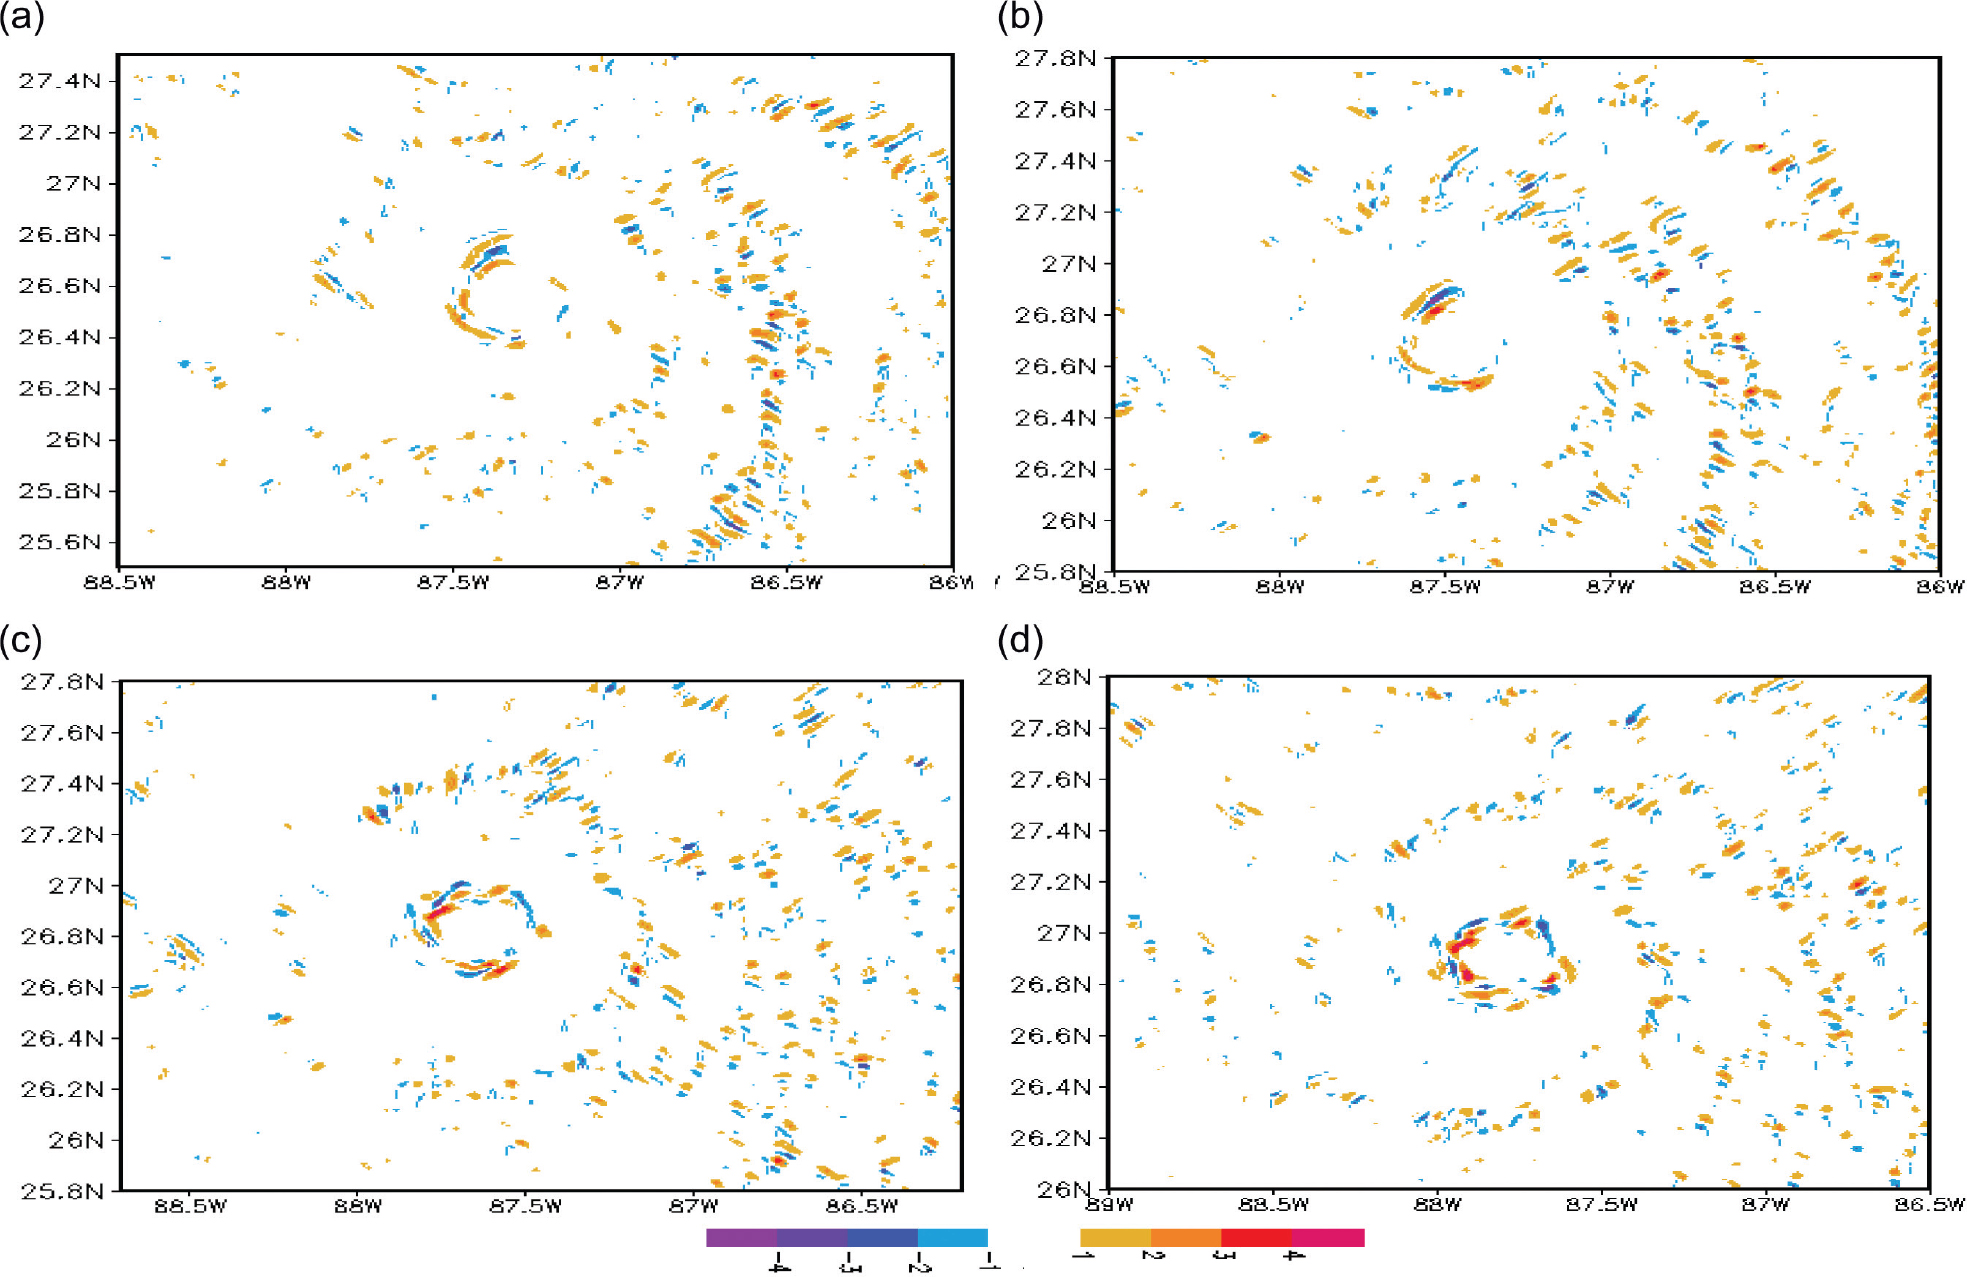
Fig. 7.
The typical hourly time history the intensity of hurricane (ms−1). (a) 1500 UTC 28 August 2005; (b) 1600 UTC 28 August 2005; (c) 1700 UTC 28 August 2005; (d) 1800 UTC 28 August 2005.
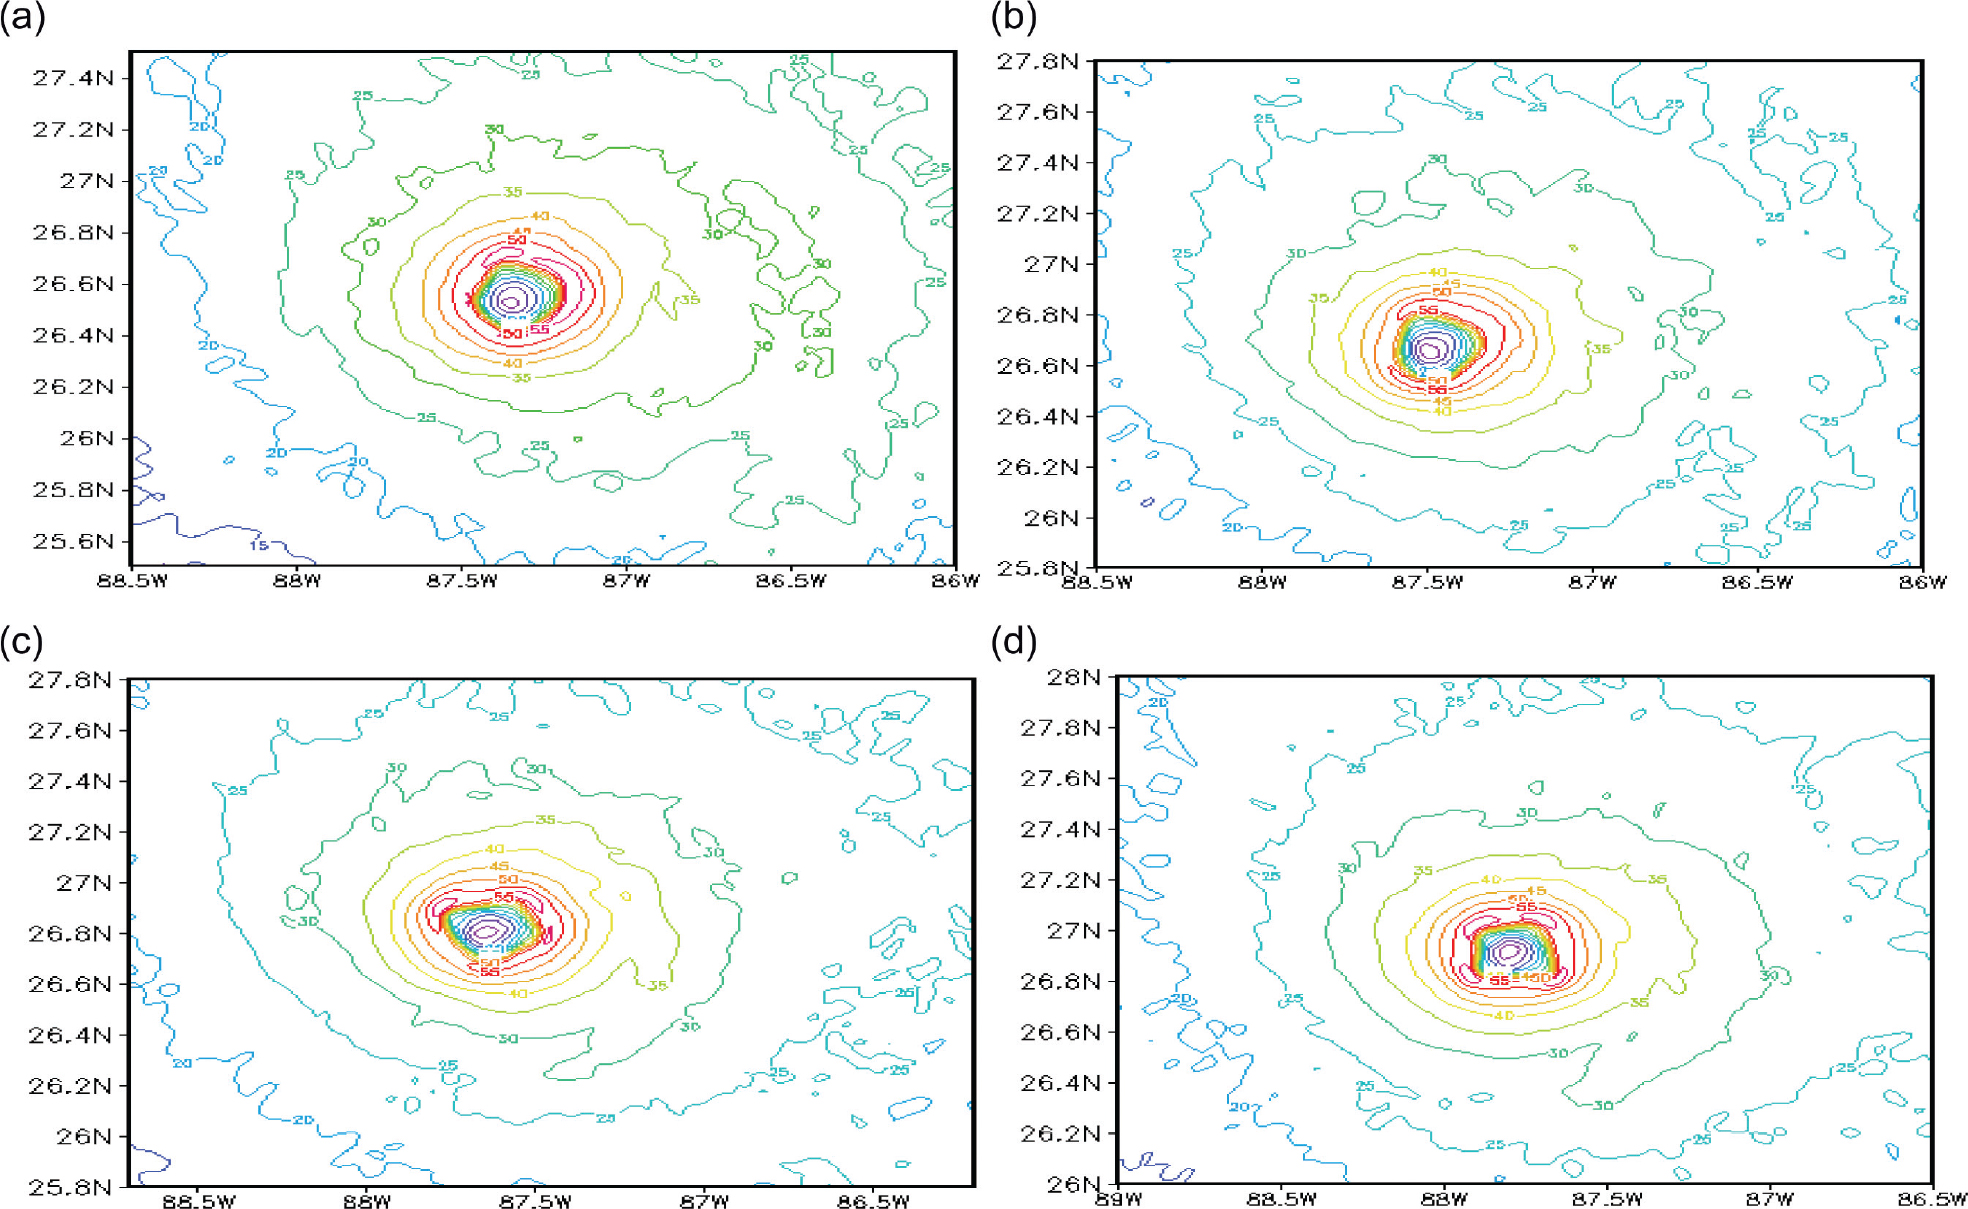
Fig. 8.
Location of the points where deep convection was noted are indicated as letters A, B, C and D and a location outside the eye wall is marked with a letter N.
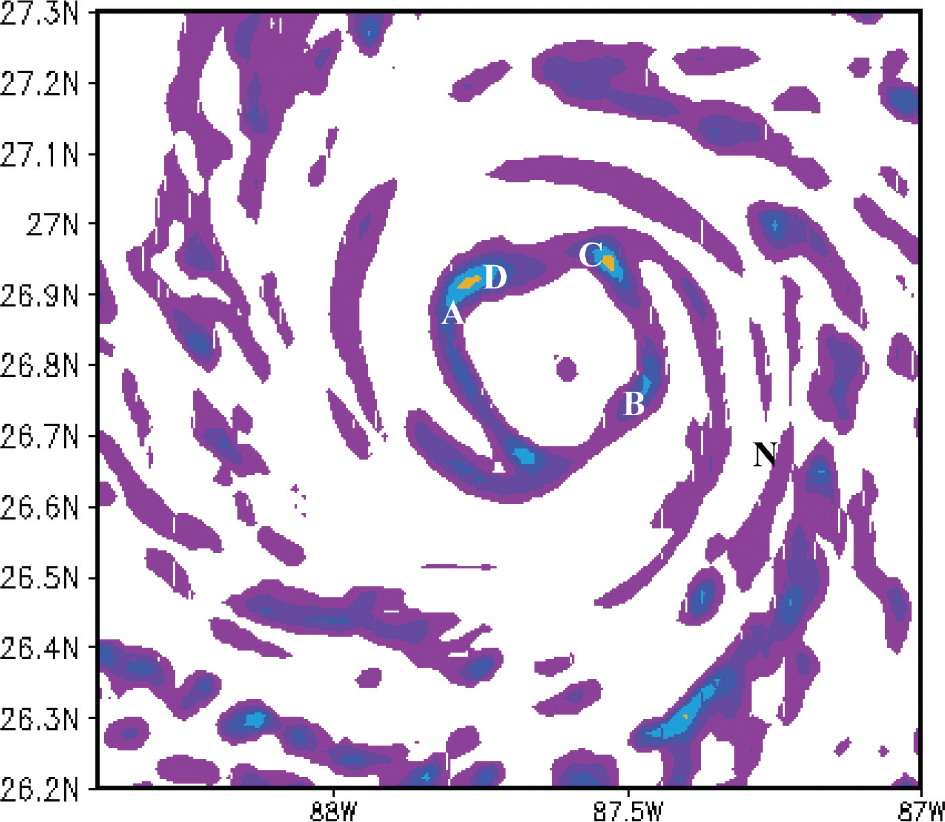
Fig. 9.
An example of hourly (along abscissa) changes, of the (a) cloud liquid water (kg kg−1), (b) divergence s−1, (c) gradient wind departures (×10−5 s−2) and the (d) wind speed (ms−1) as solid line and sea level pressure marked as dashed line (hPa), along the ordinates, for the simulated hurricane Katrina. The azimuthal average wind is shown by short dashes and labelled as hurricane. These are results for a cloud flare up event indicated in Fig. 8 as A along the inner eye wall.
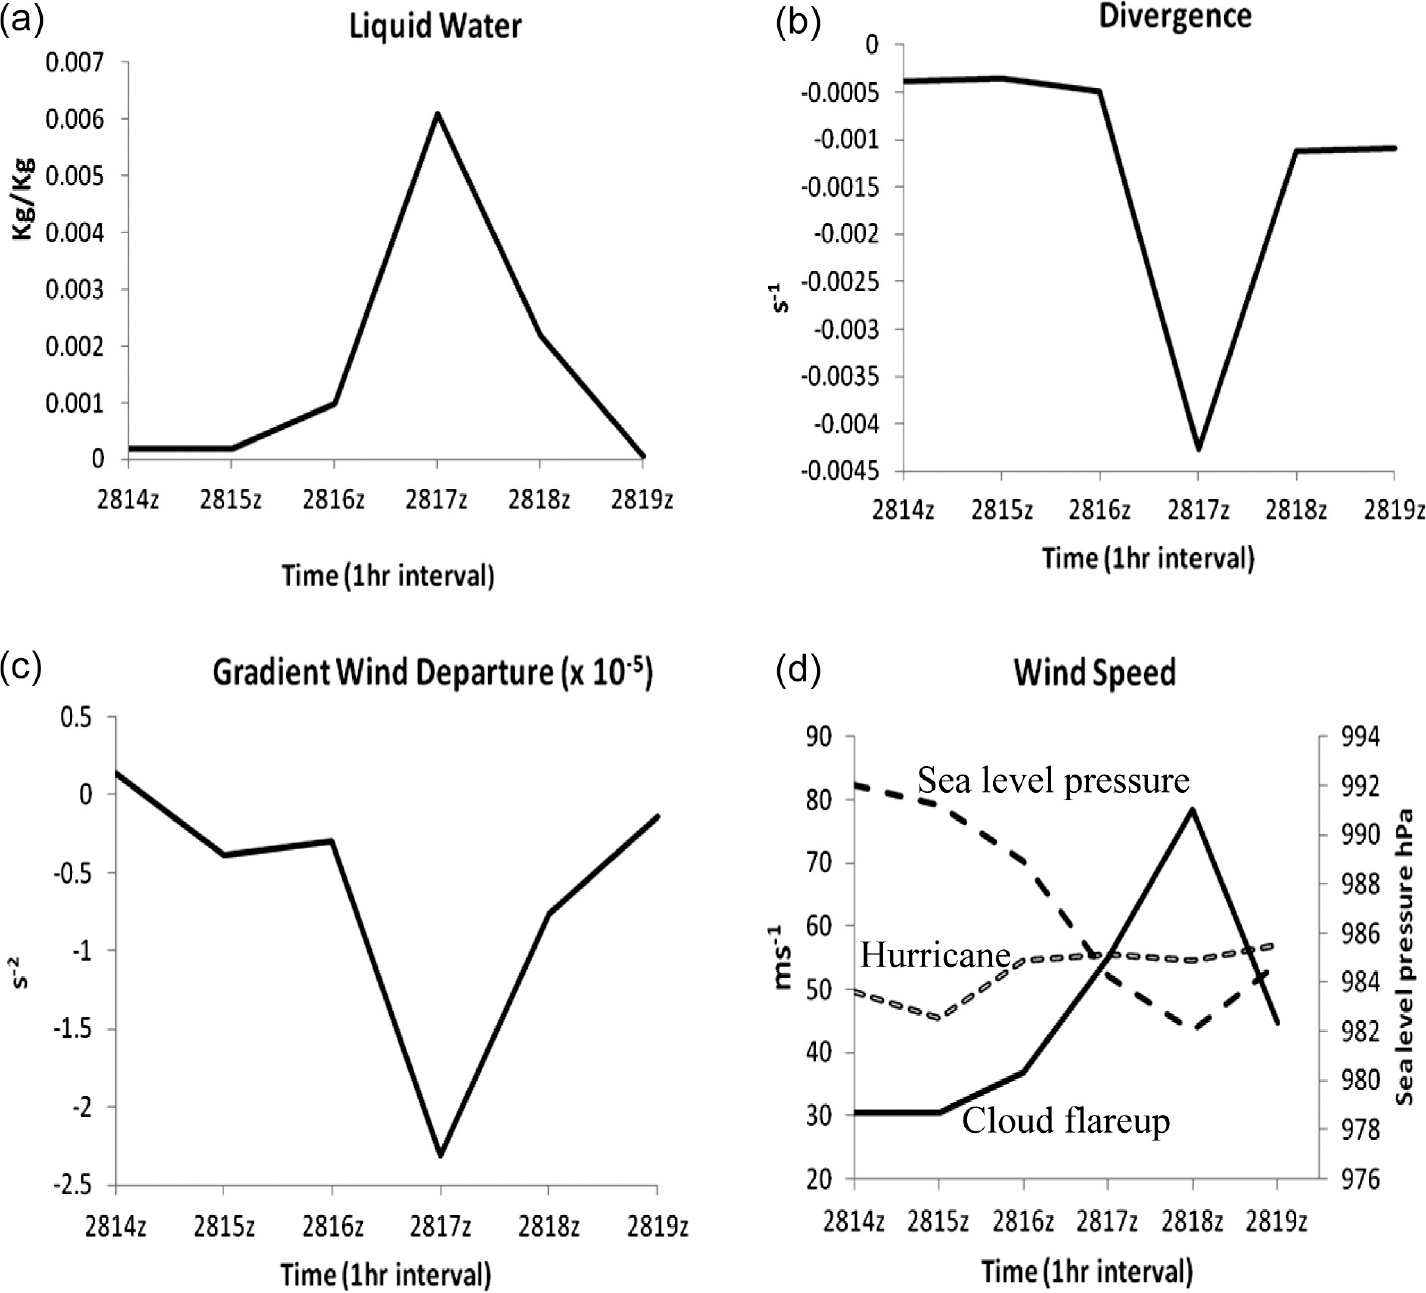
Fig. 10.
Same as Fig. 9, but for another selected cloud flare up event (B in Fig. 8).
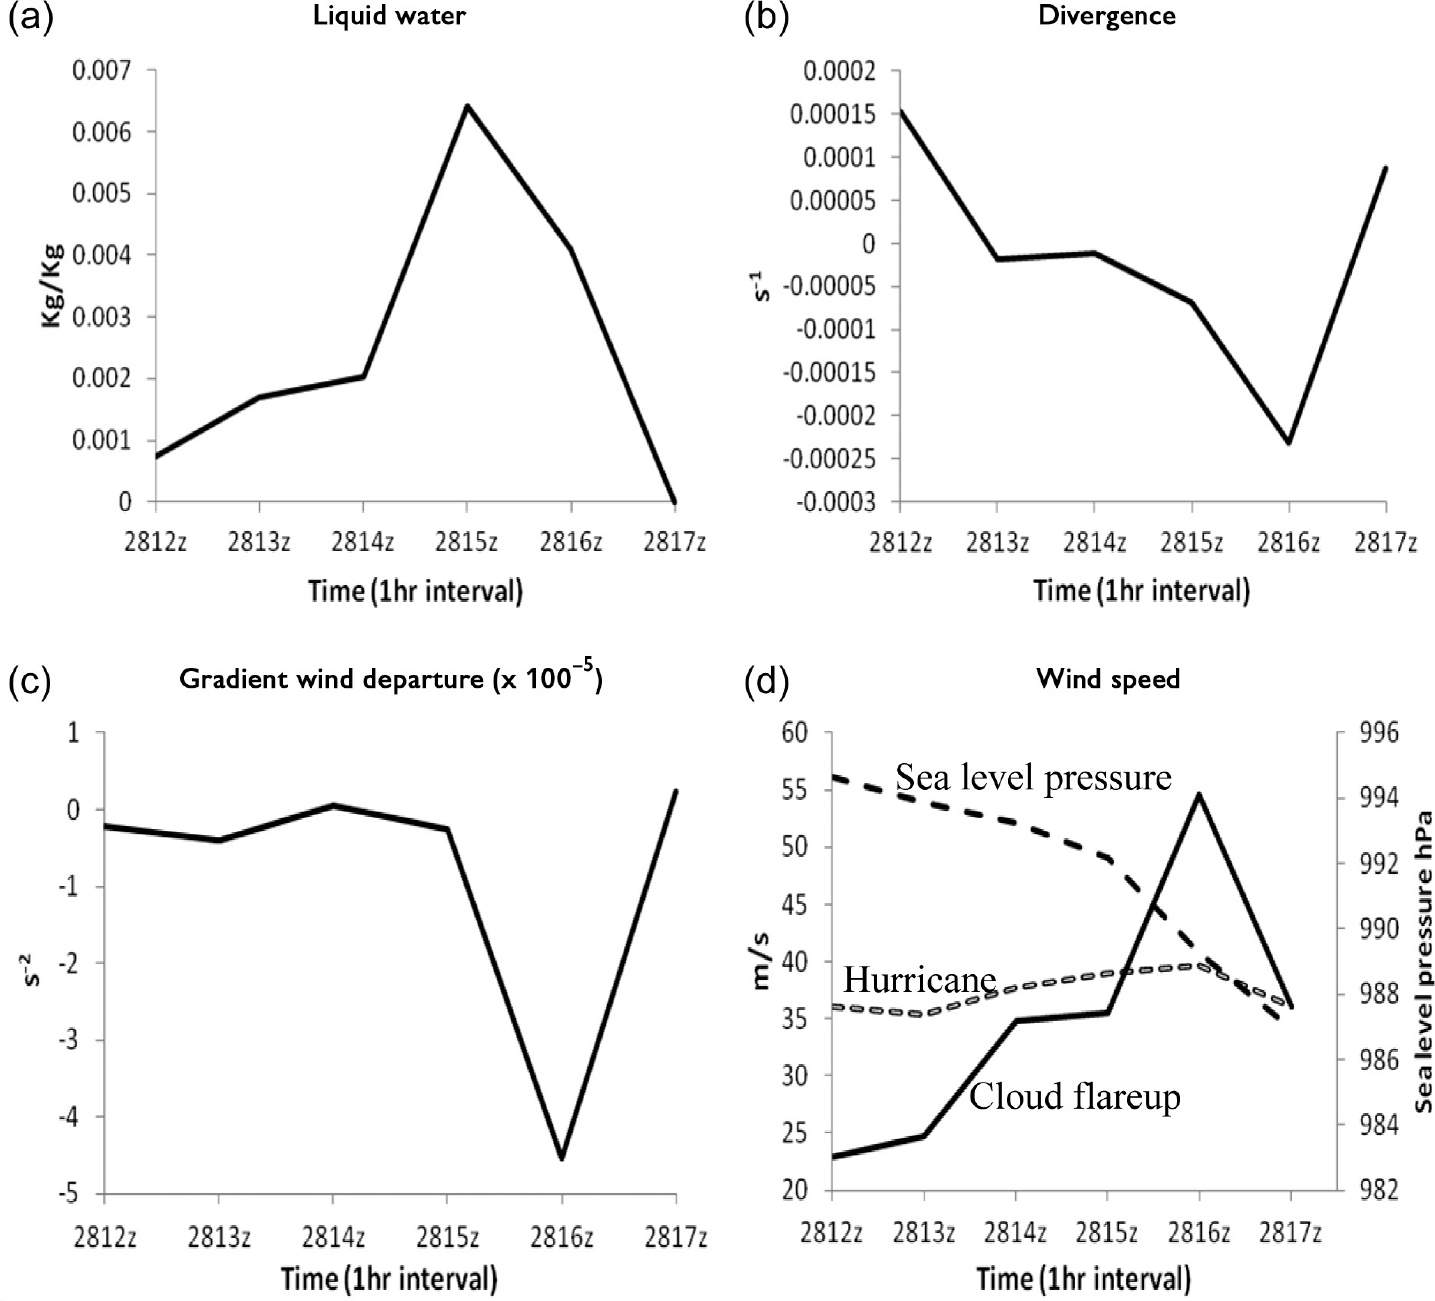
Fig. 11.
Same as Fig. 10, but for another selected cloud flare up event (C in Fig. 8).
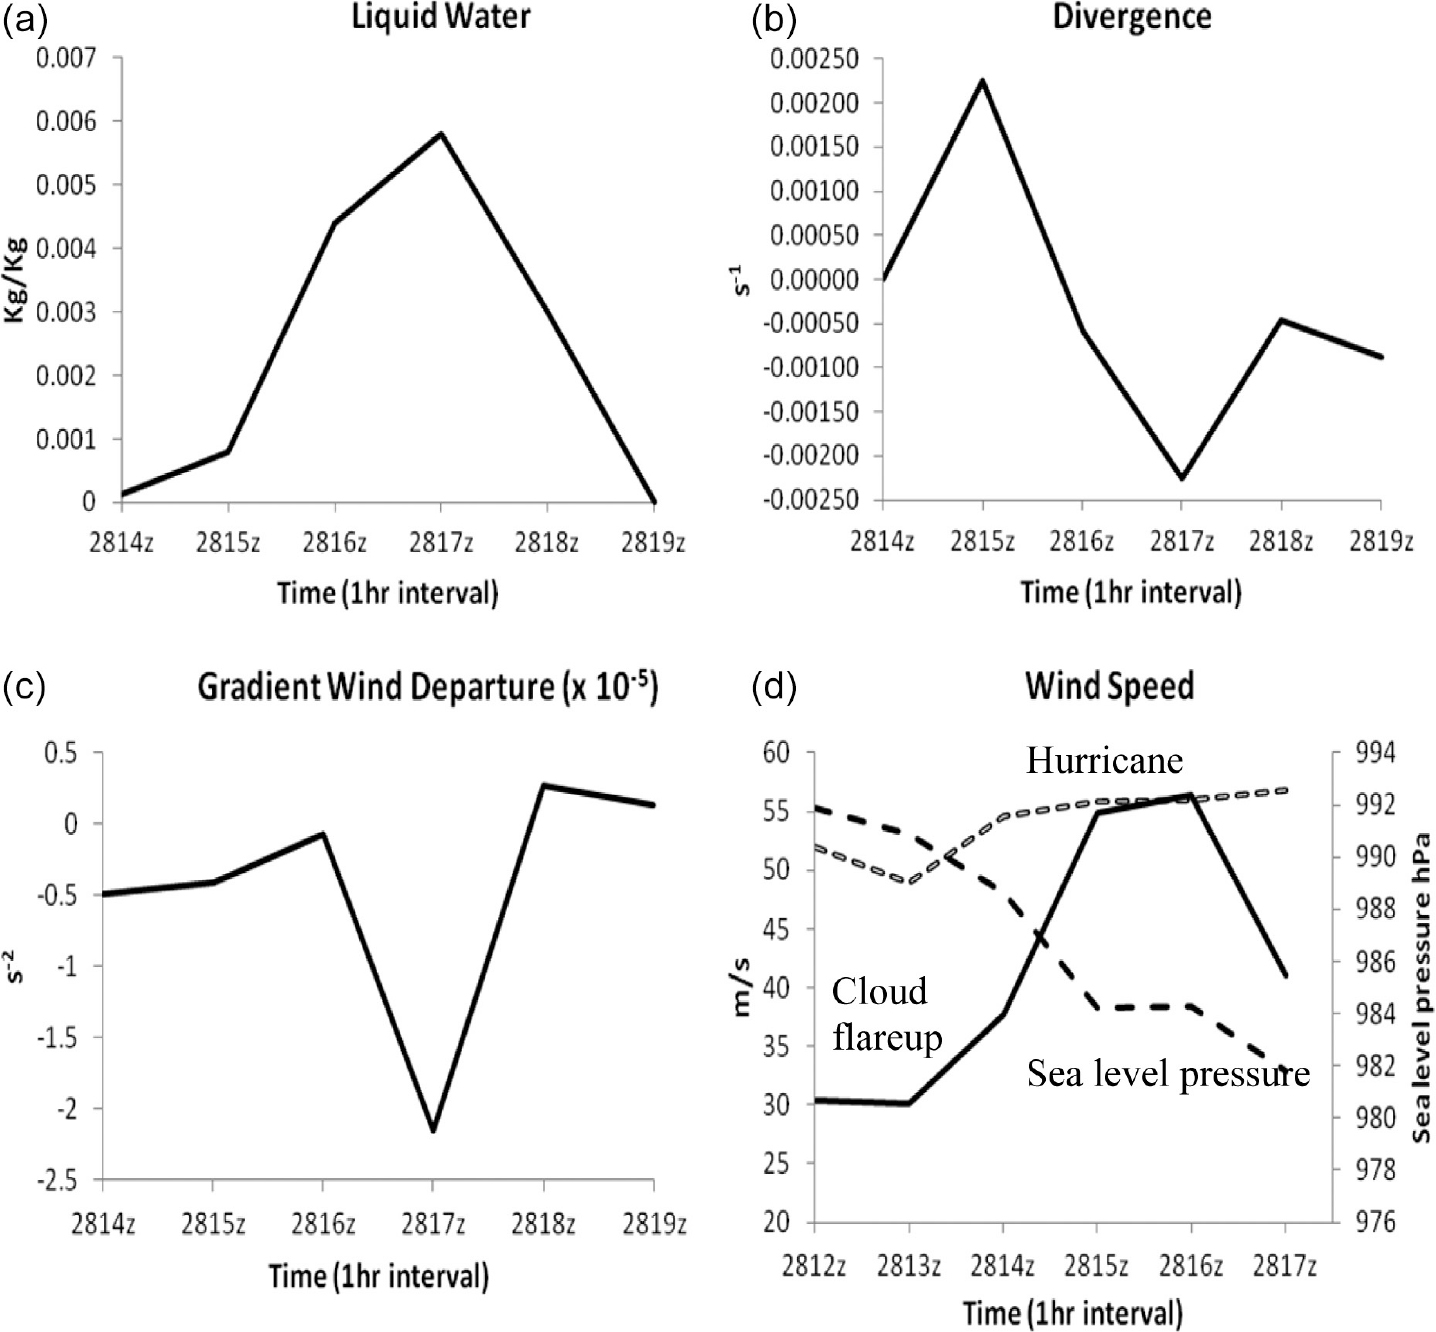
Fig. 12.
Same as Fig. 11, but for another selected cloud flare up event (D in Fig. 8).
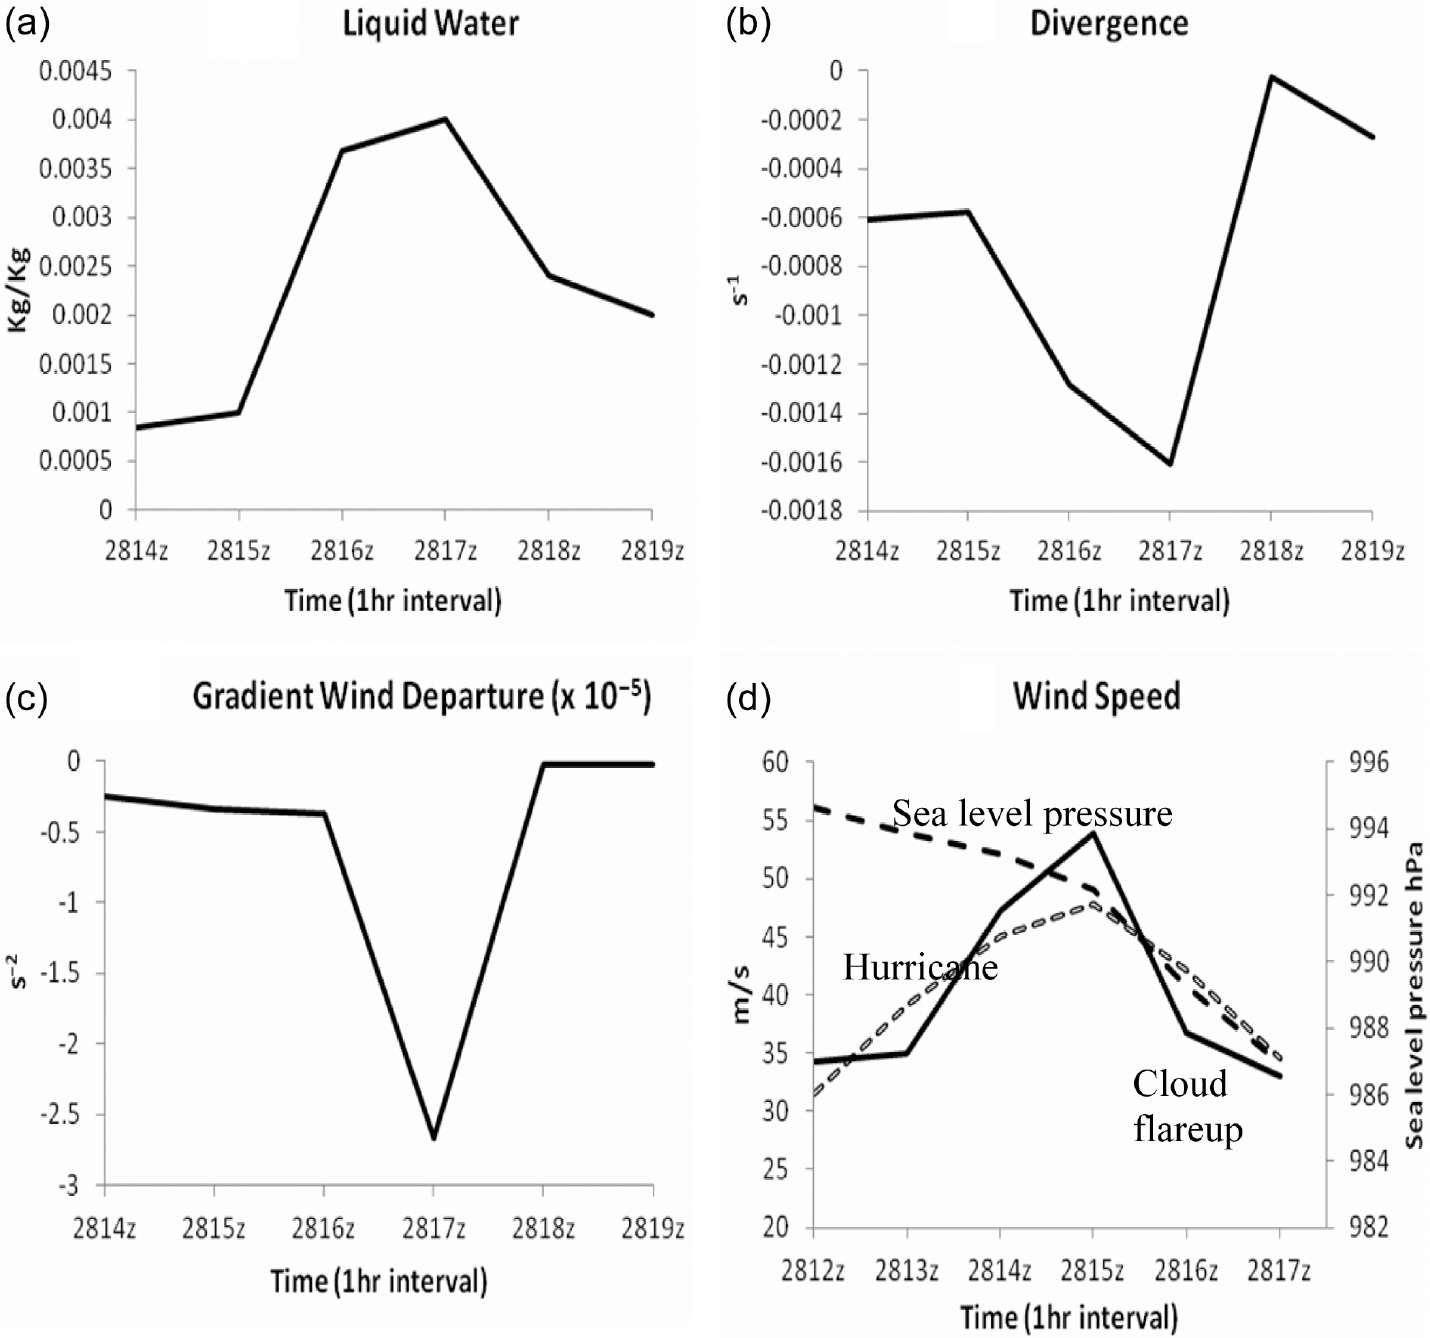
Fig. 13.
An example of hourly (along abscissa) changes, (a) of the cloud liquid water (kg kg−1), (b) divergence s−1, (c) gradient wind departures (×10−5 s−2) and the (d) wind speed (ms−1) as solid line and sea level pressure marked as dashed line (hPa) along the ordinates, for the simulated hurricane Katrina on 28 August 2005. This cloud element indicated as N in Fig. 8 is located well outside of the inner eye wall.
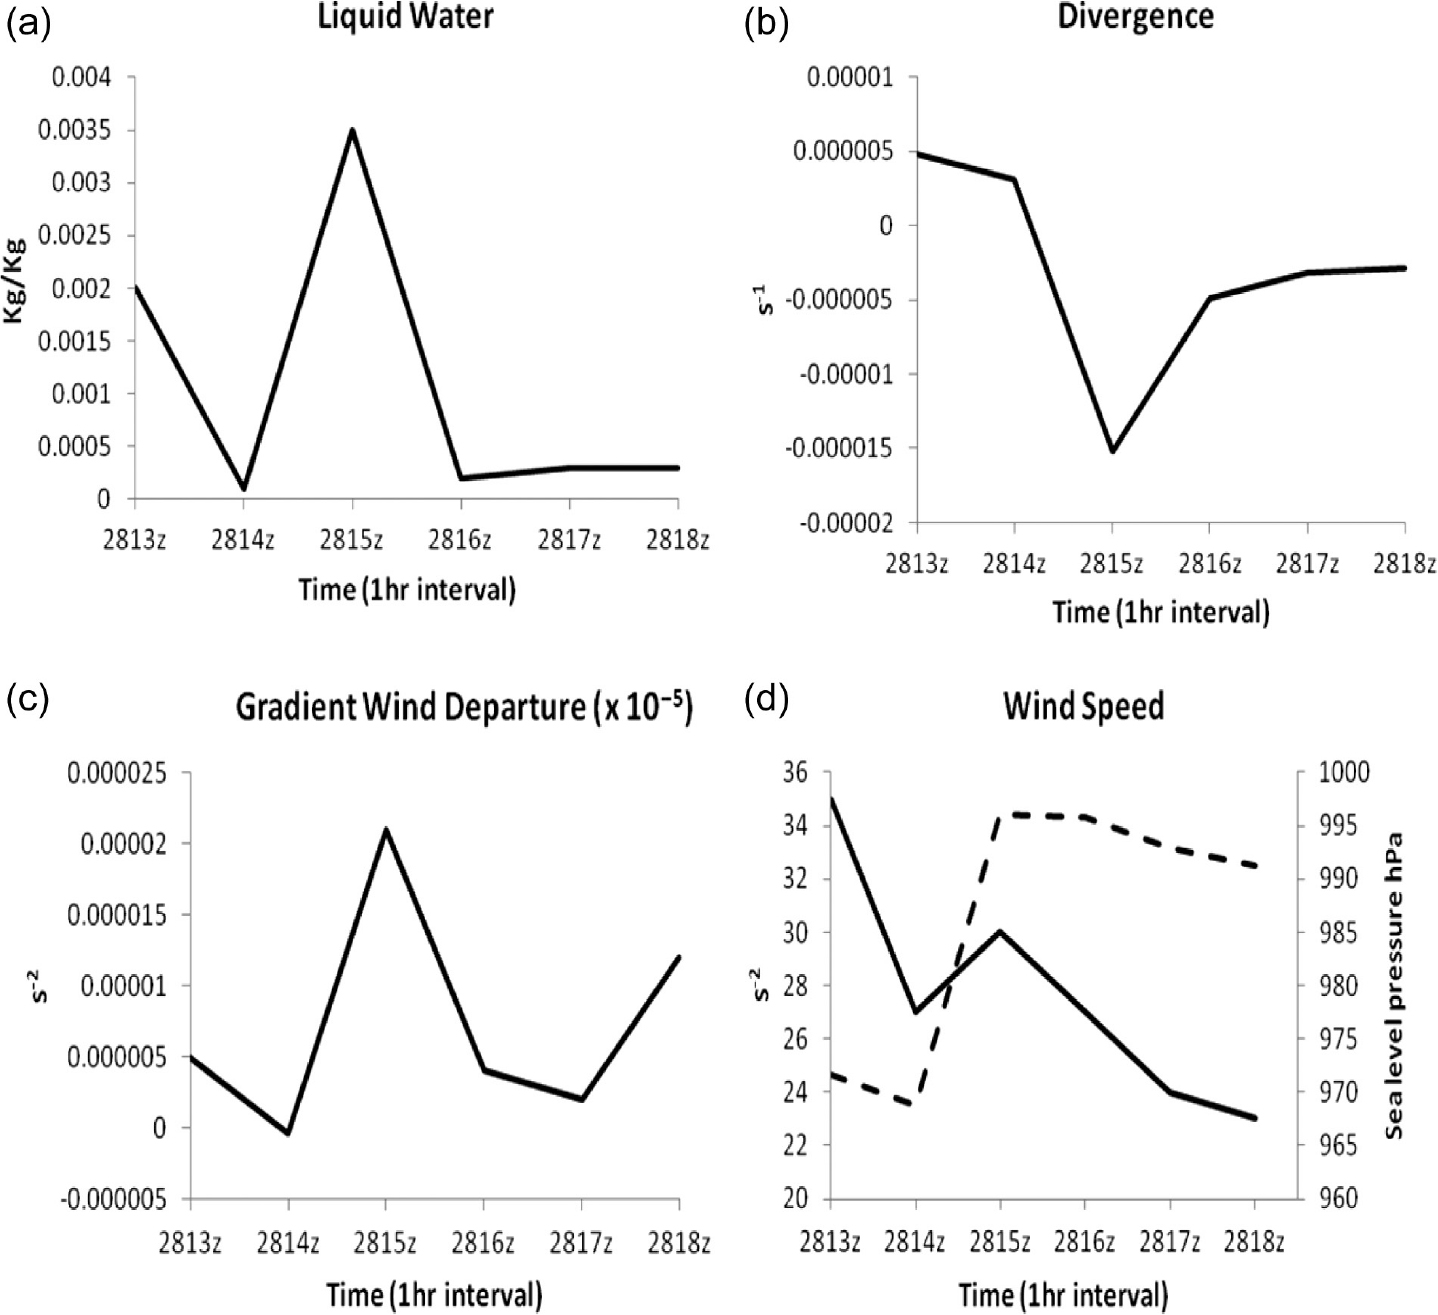
Fig. 14.
Scatter plot of points where the change in liquid water content (kg kg−1) is positive between two hours 1500 UTC and 1600 UTC of 28 August 2005 when the hurricane was intensifying with respect to supergradient winds (ms−1) at 1600 hours of 28 August 2005.
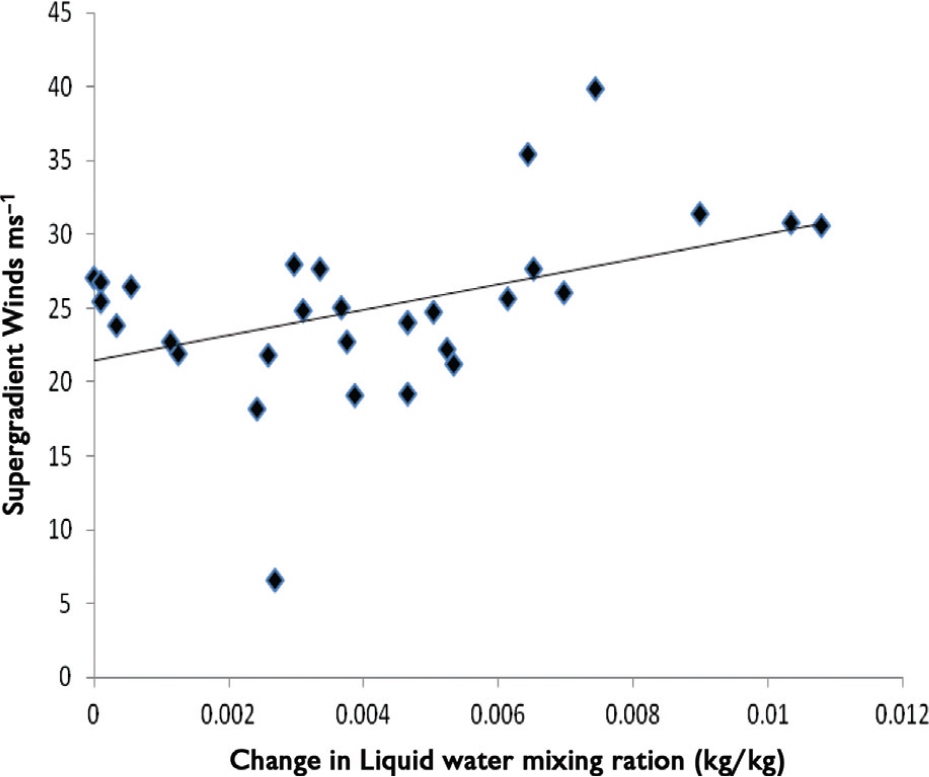
Fig. 15.
Azimuthally averaged radial height cross section of the gradient wind departures, in 10−5 s−2 (pressure, in hPa, along ordinate and radial distance, in km, along the abscissa) for a cloud flare up event.
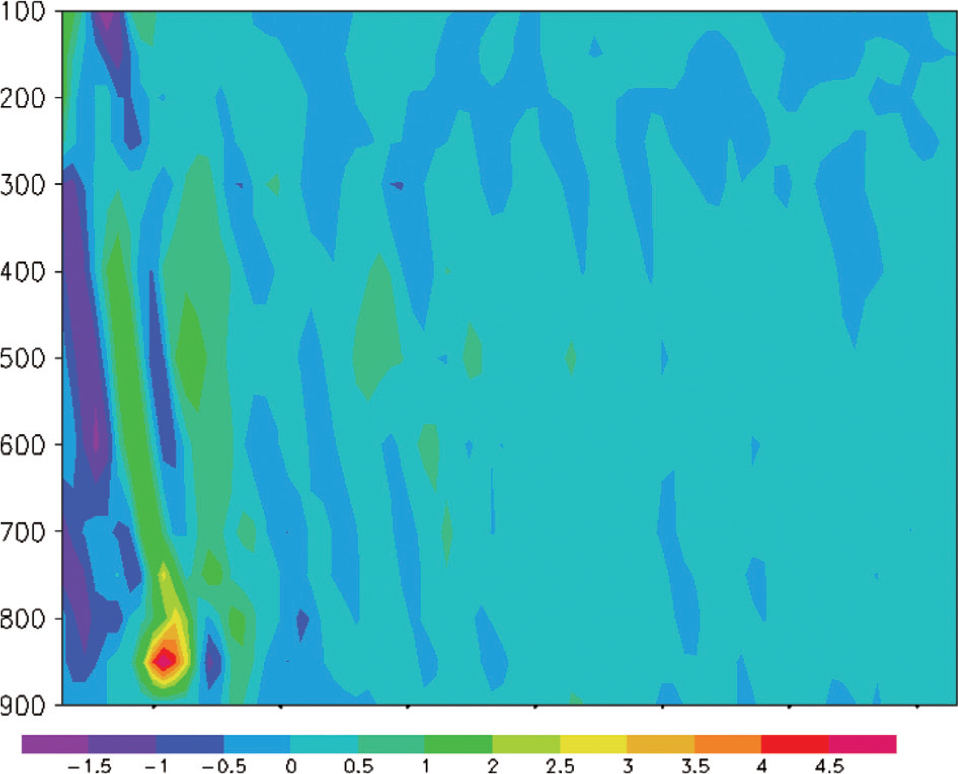
Fig. 16.
Time history of the west to east cross section of the temperature anomaly (anomaly prepared with respect to the Jordan sounding for the hurricane season) for a cloud flare-up event: (a) 1430 UTC 28 August 2005; (b) 1530 UTC 28 August 2005; (c) 1630 UTC 28 August 2005; (d) 1730 UTC 28 August 2005.
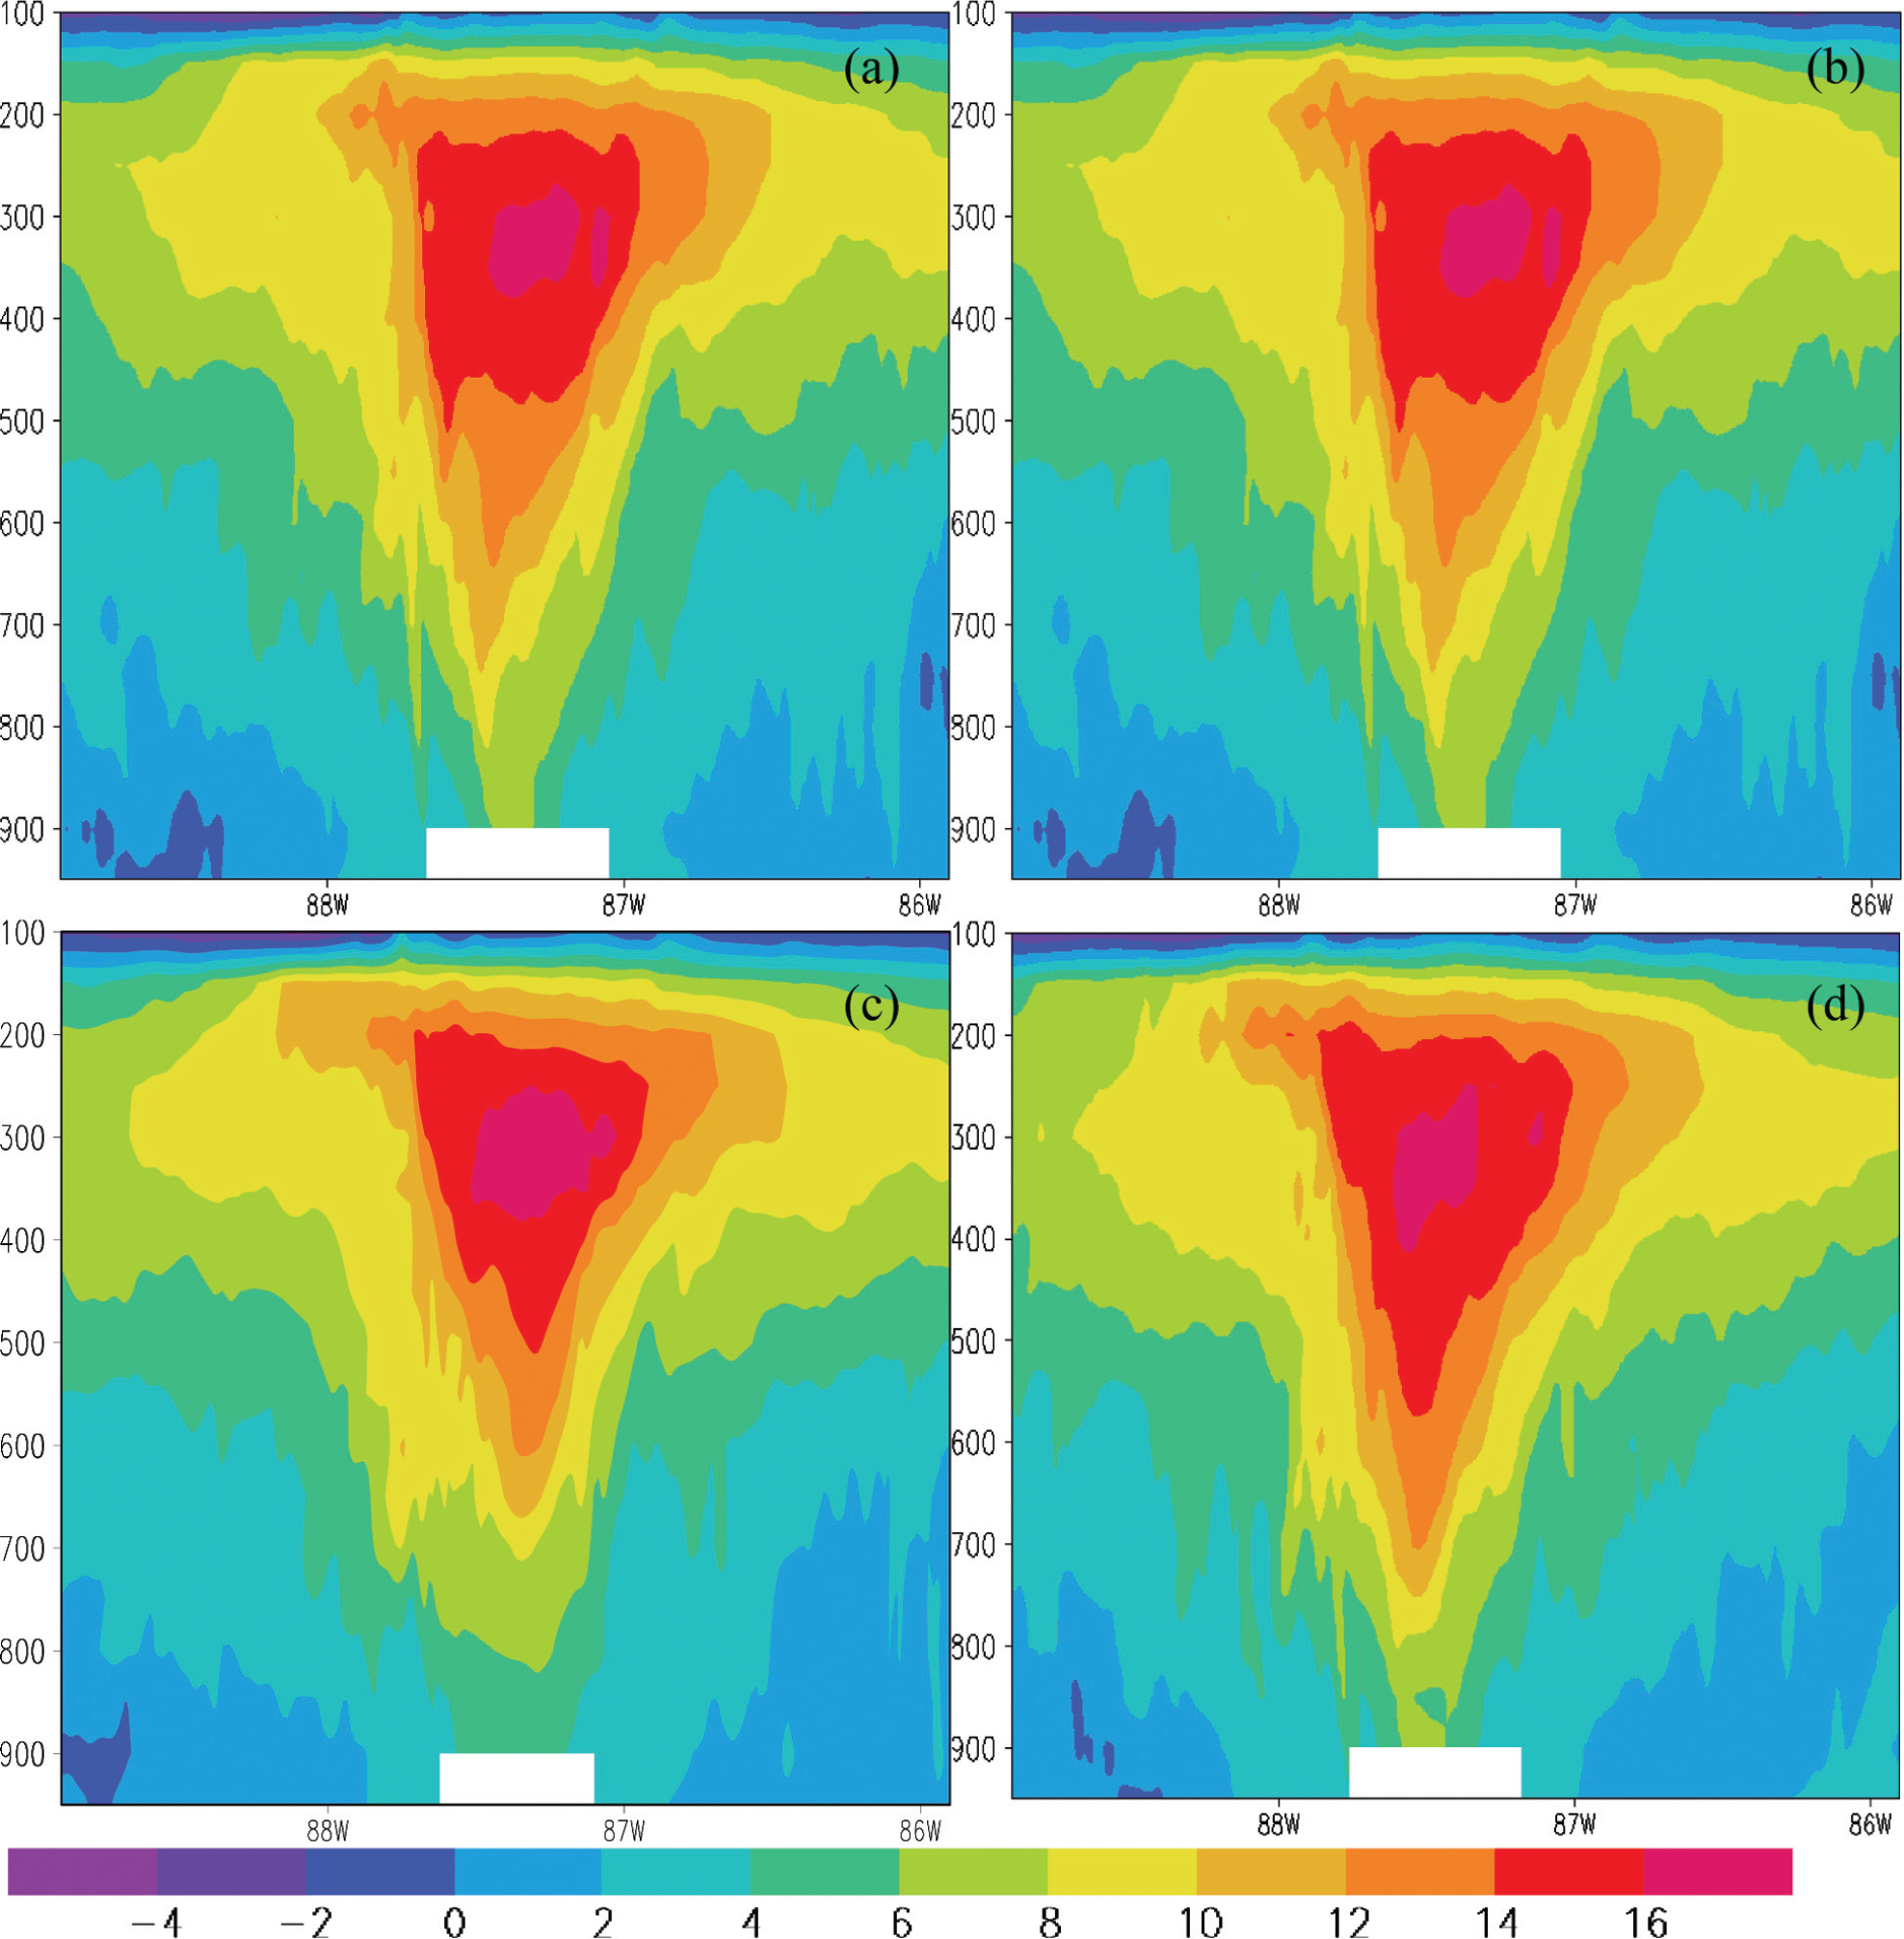
Fig. 17.
Time history of the west to east cross section of the azimuthally averaged cross sections of temperature anomaly, in degree centigrade (pressure, in hPa, along ordinate and radial distance, in km, along the abscissa) for a cloud flare-up event: (a) 1430 UTC 28 August 2005; (b) 1530 UTC 28 August 2005; (c) 1630 UTC 28 August 2005; (d) 1730 UTC 28 August 2005.
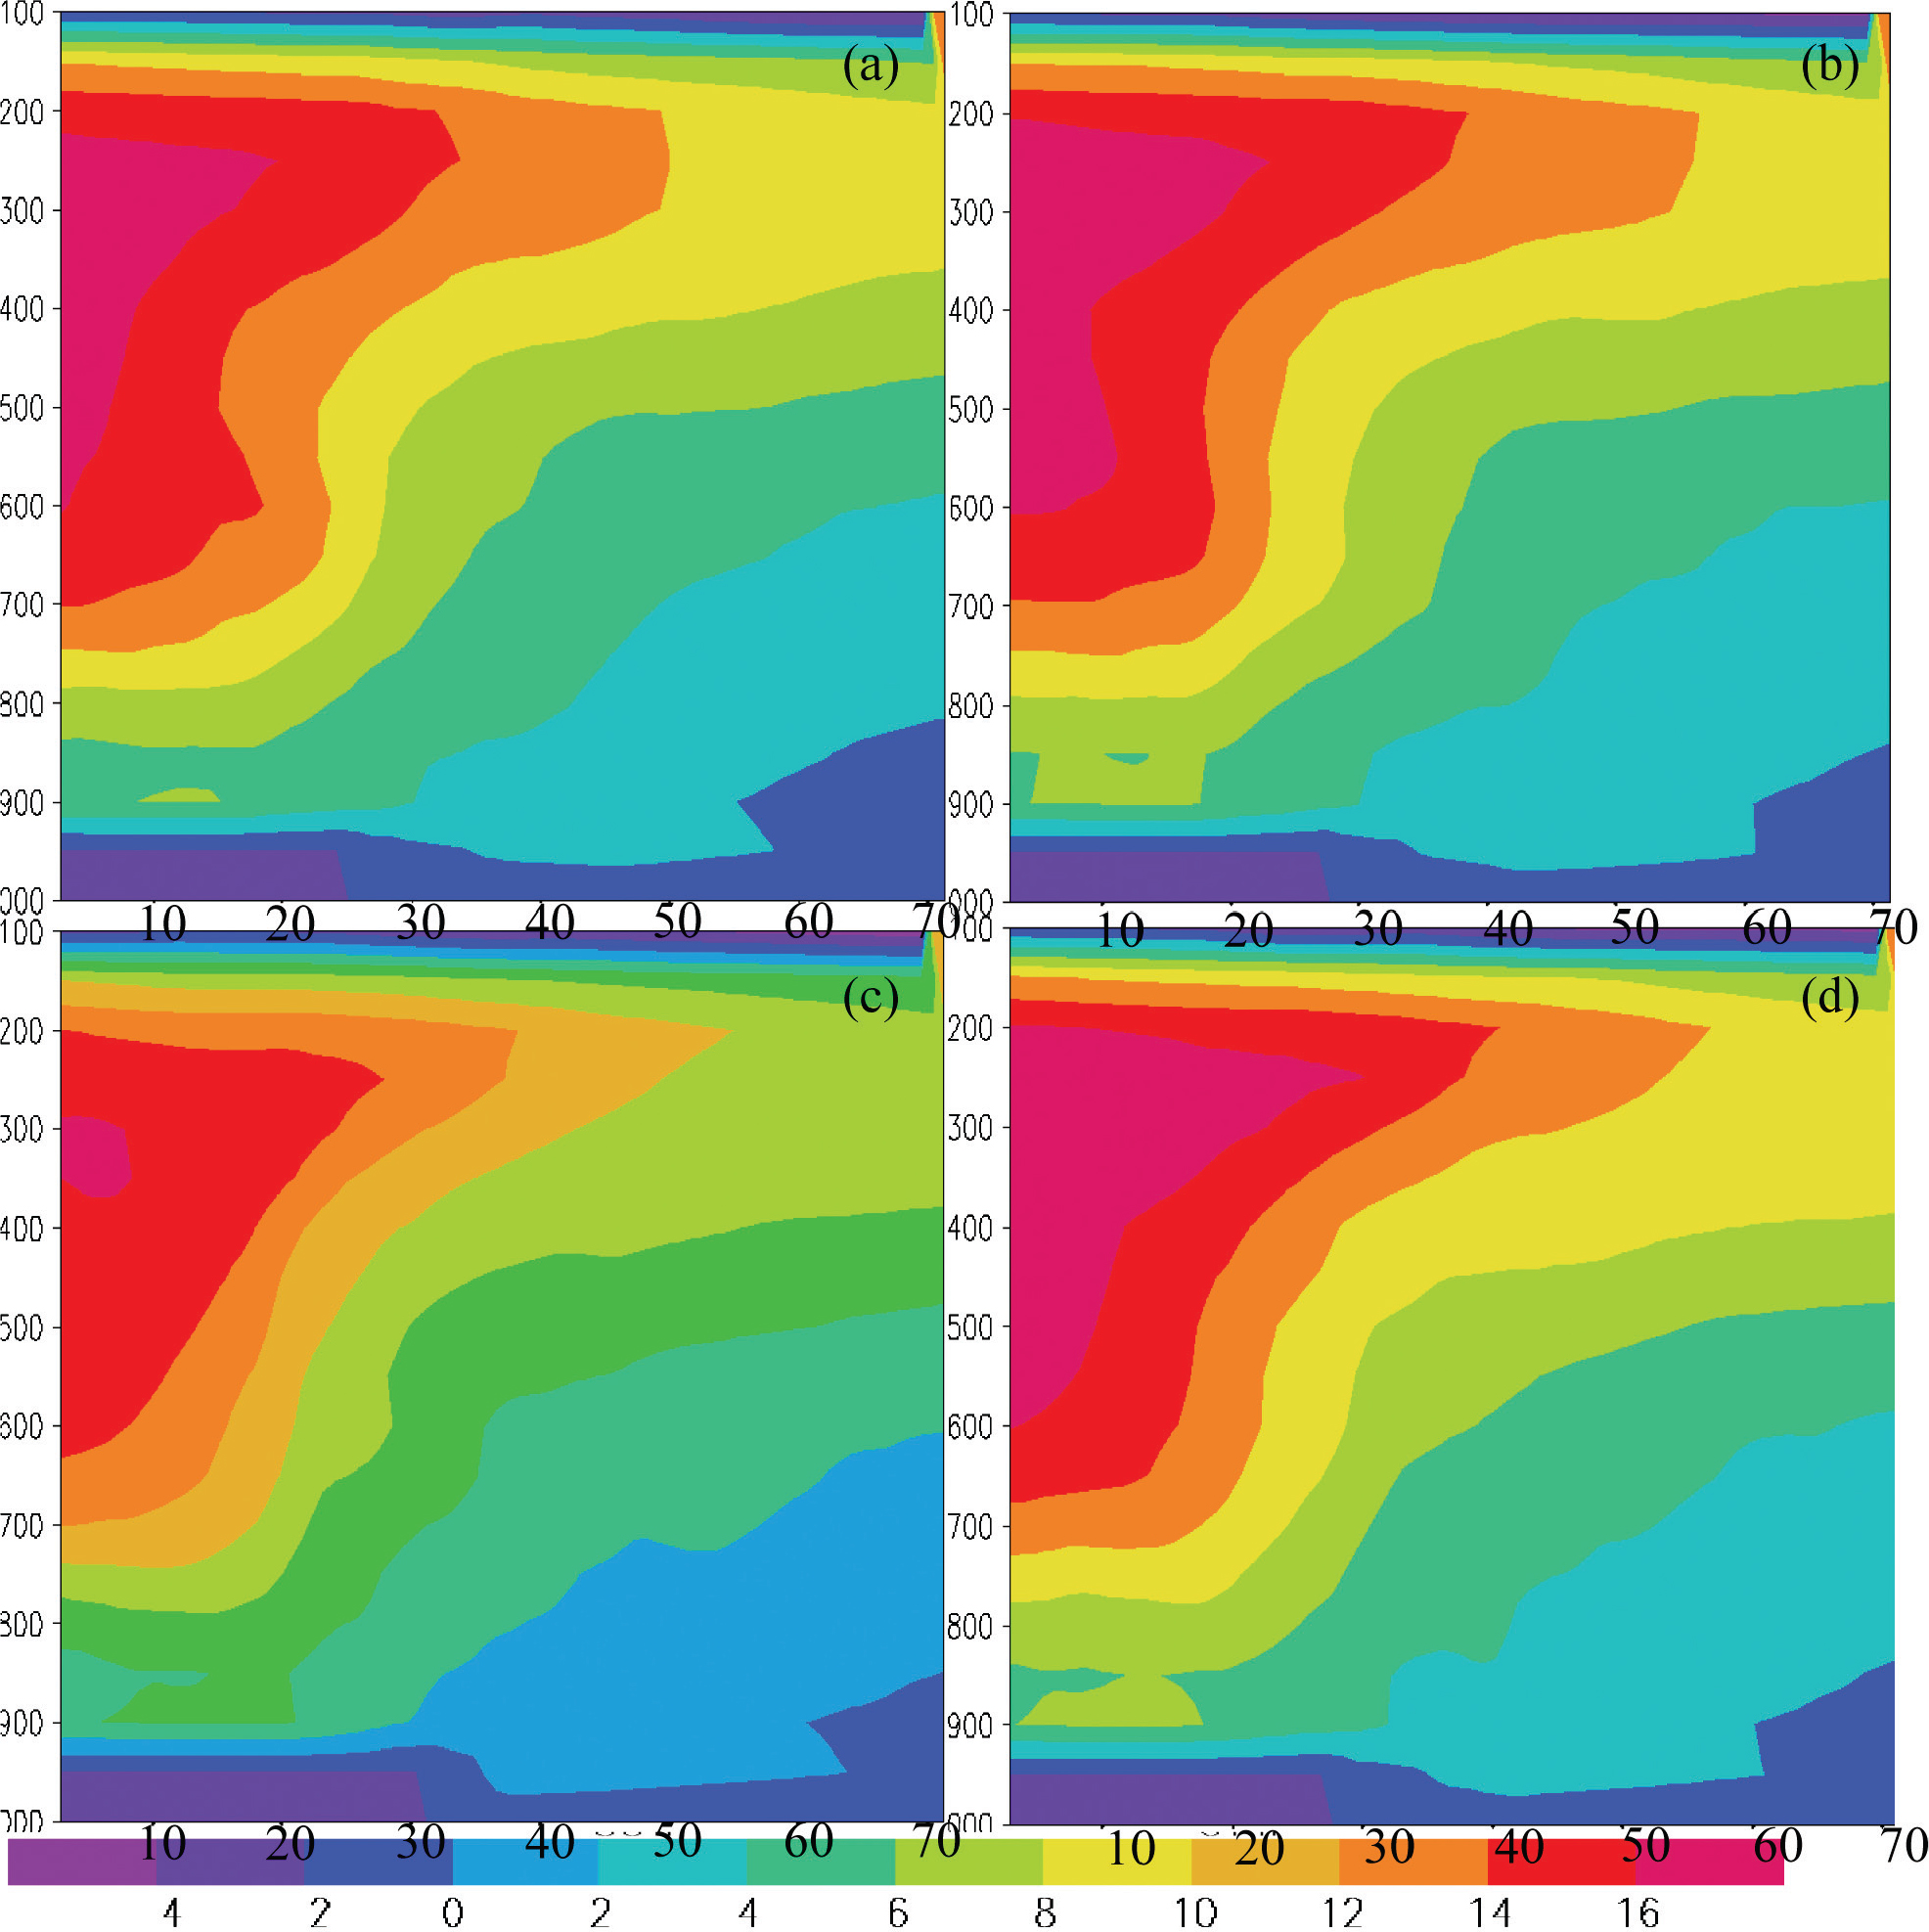
Fig. 18.
Time history of the west to east cross section of the equivalent potential temperature (units: degrees Kelvin) (pressure, in hPa, along ordinate and radial distance, in km, along the abscissa) for a cloud flare-up event: (a) 1430 UTC 28 August 2005; (b) 1530 UTC 28 August 2005; (c) 1630 UTC 28 August 2005; (d) 1730 UTC 28 August 2005.
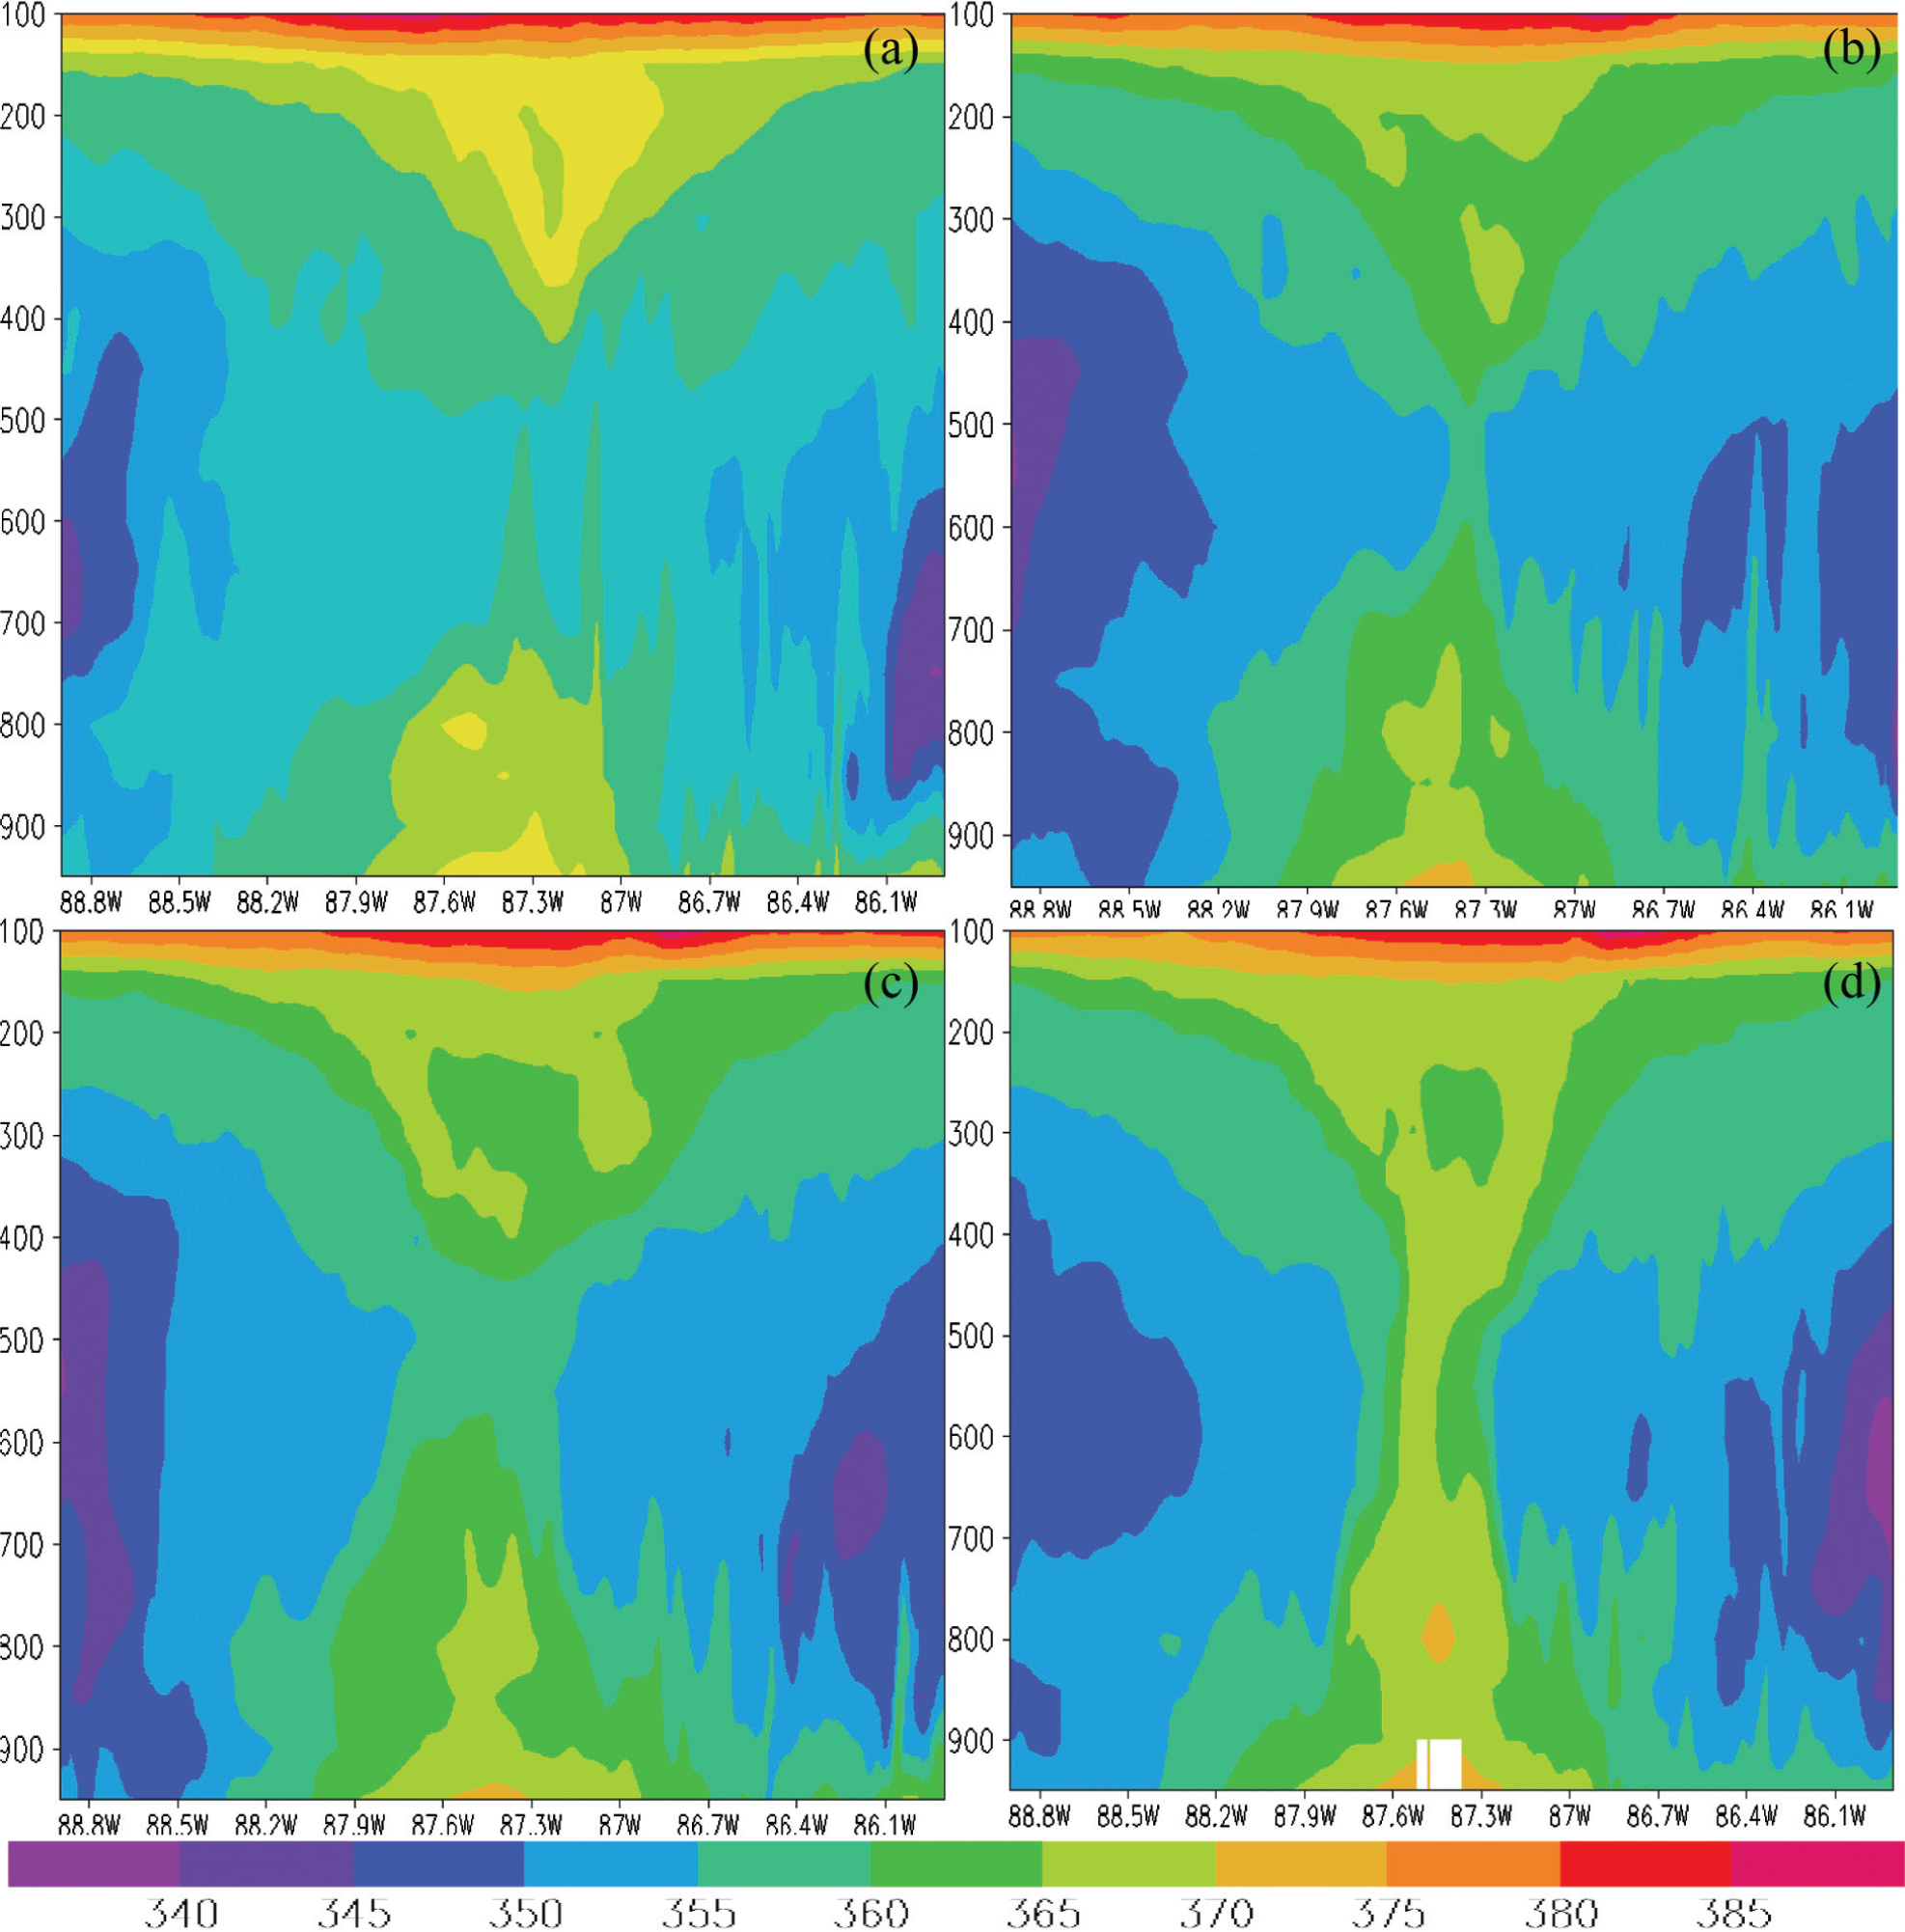
Fig. 19.
Vertical cross section of equivalent potential temperature for Hurricane Inez on 28 September 1966 (Hawkins and Imbembo, 1976).
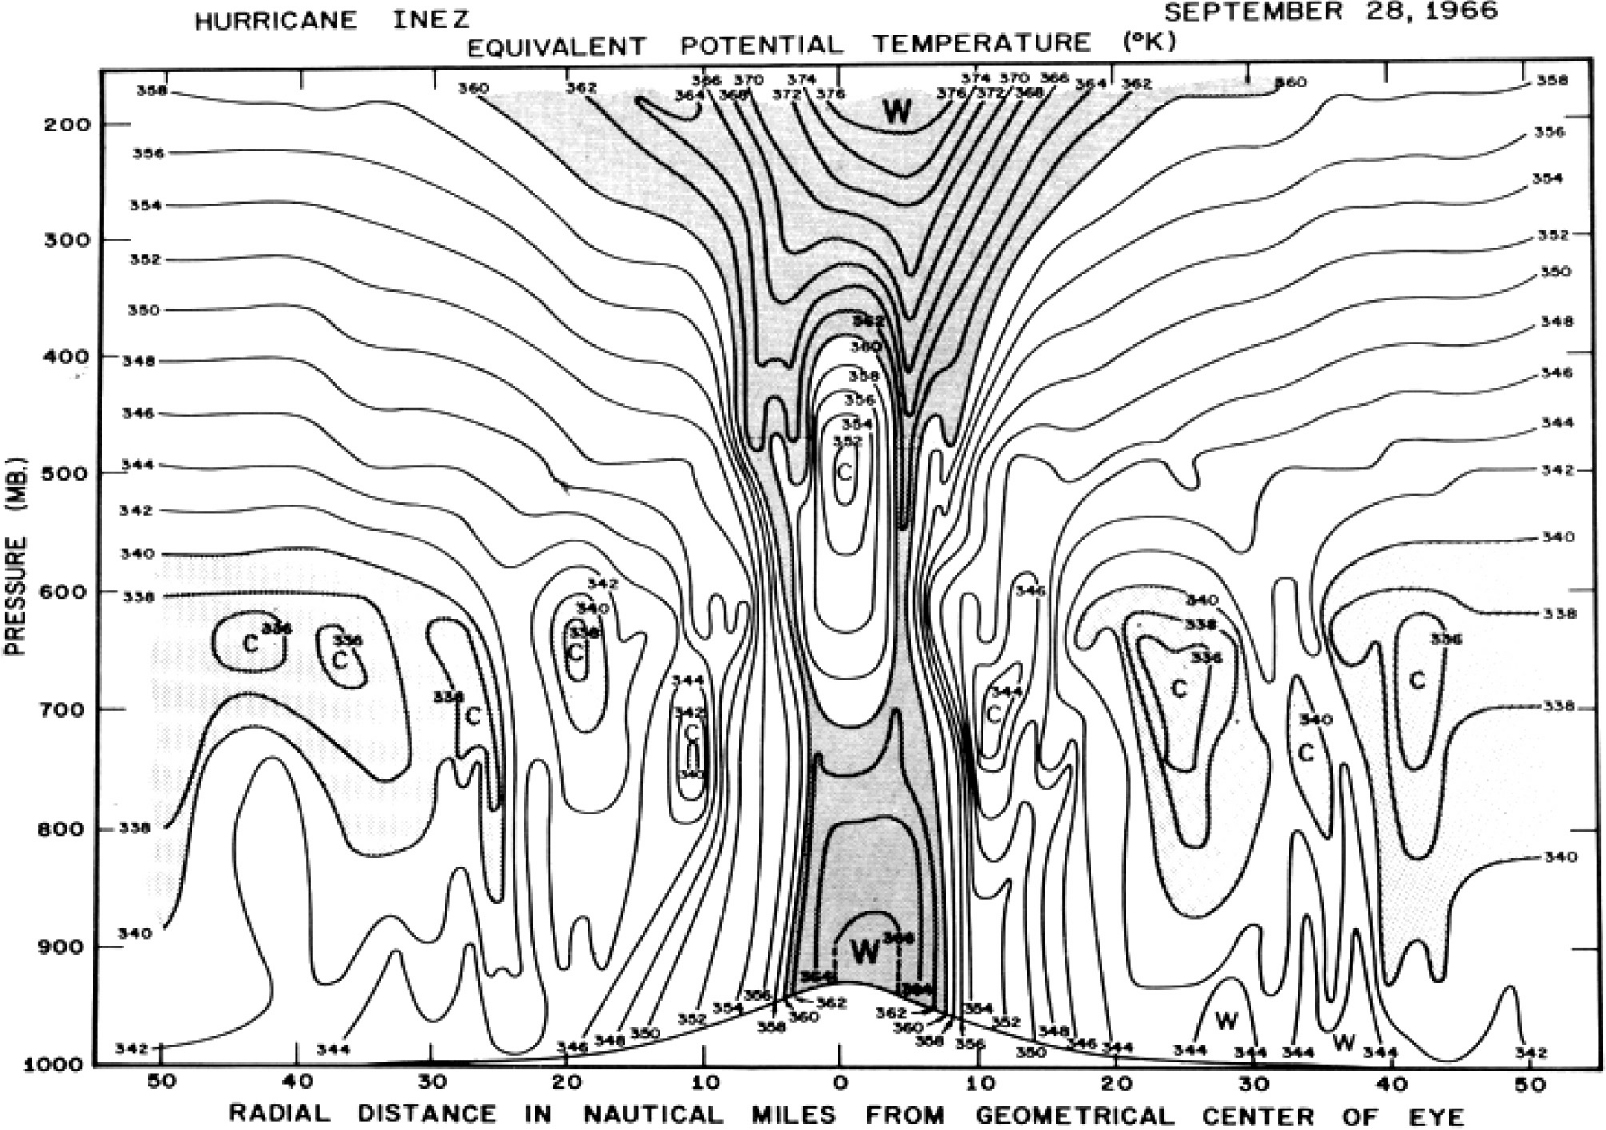
Fig. 20.
An example of hourly (along abscissa) changes, of the latent heat flux (watts/m2), sensible heat flux (watts/m2), momentum flux (pa) as solid line, along the ordinates, for the simulated hurricane Katrina for the same locations shown in Figs. 9–12. These are results for a cloud flare up event along the inner eye wall.
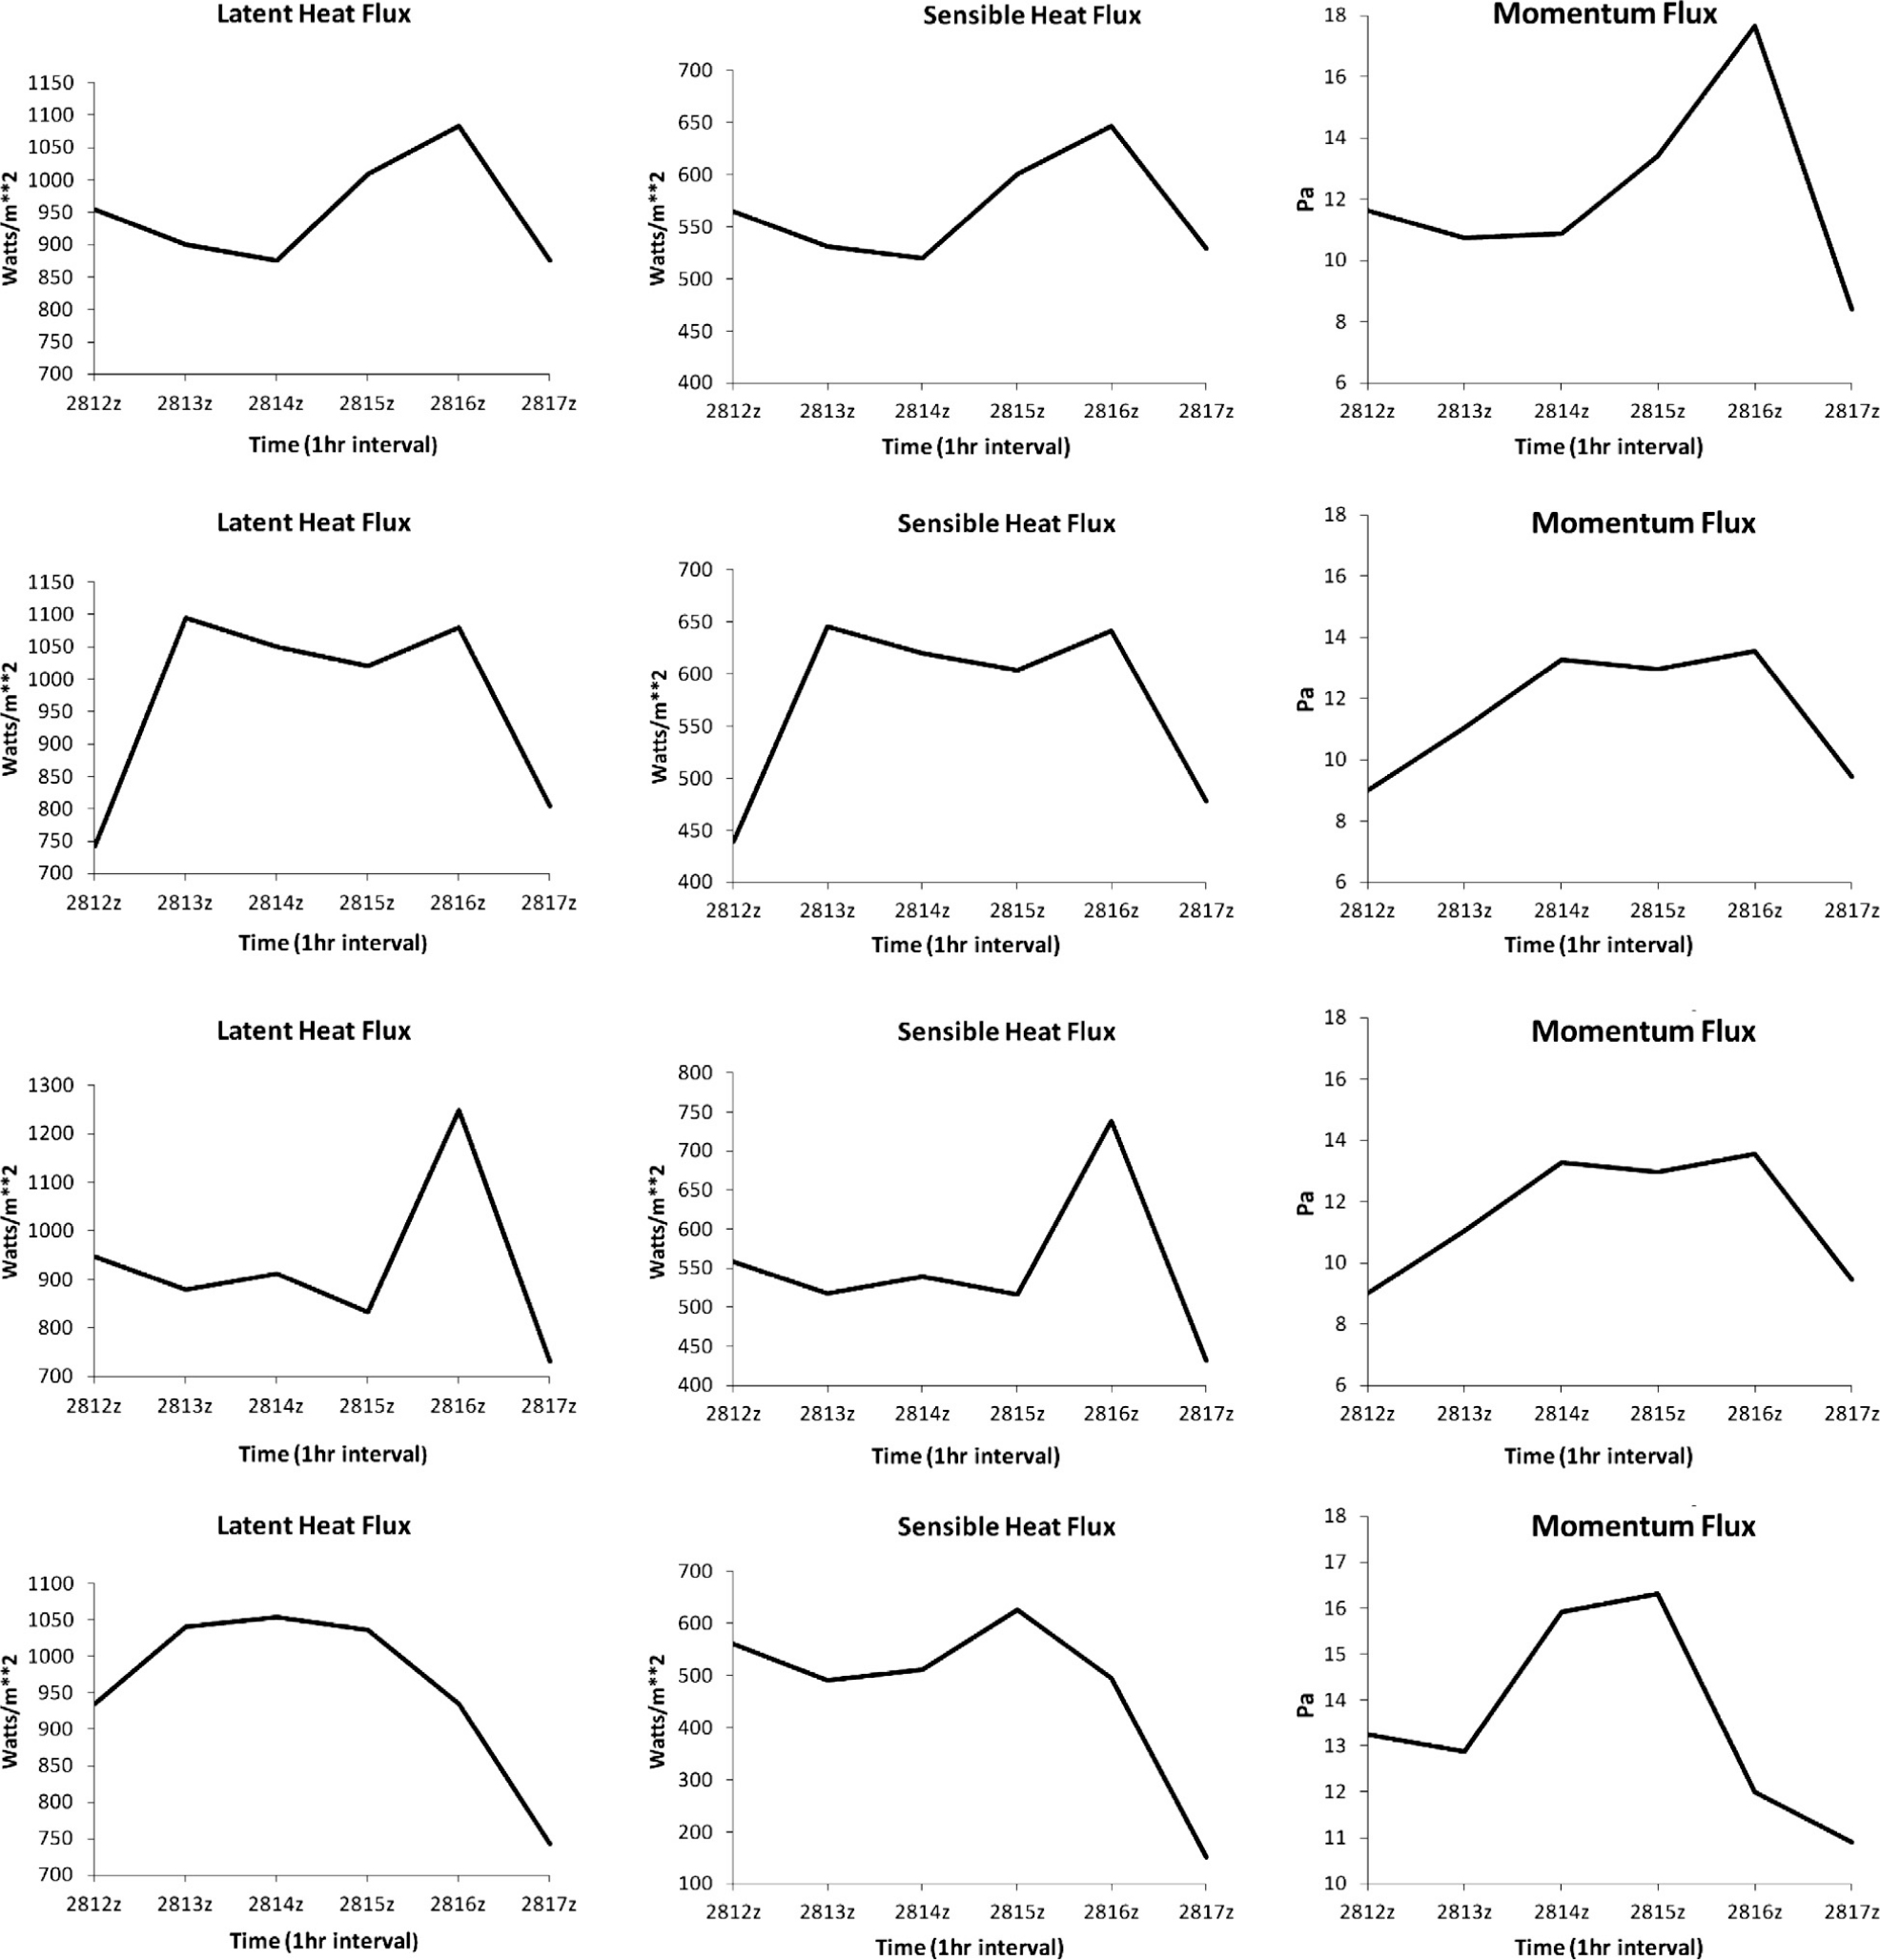
Fig. 21.
Variances for the azimuthal harmonics 0, 1, 2 and 3 for the case where a cloud element was growing along the inner eye wall (shown by dark bars). Also shown are variances when the liquid water mixing ratio of the cloud element was put to zero.
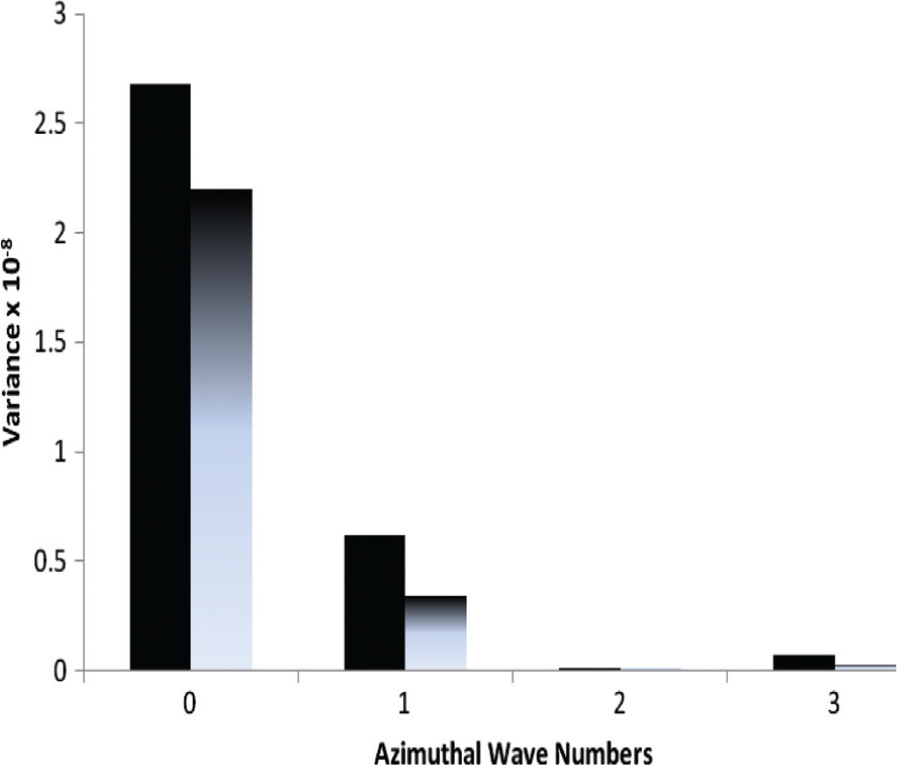
Fig. 22.
The hourly depictions of Buoyancy (ms−2) at 850 hPa level. (a) 1500 UTC 28 August 2005; (b) 1600 UTC 28 August 2005; (c) 1700 UTC 28 August 2005; (d) 1800 UTC 28 August 2005.
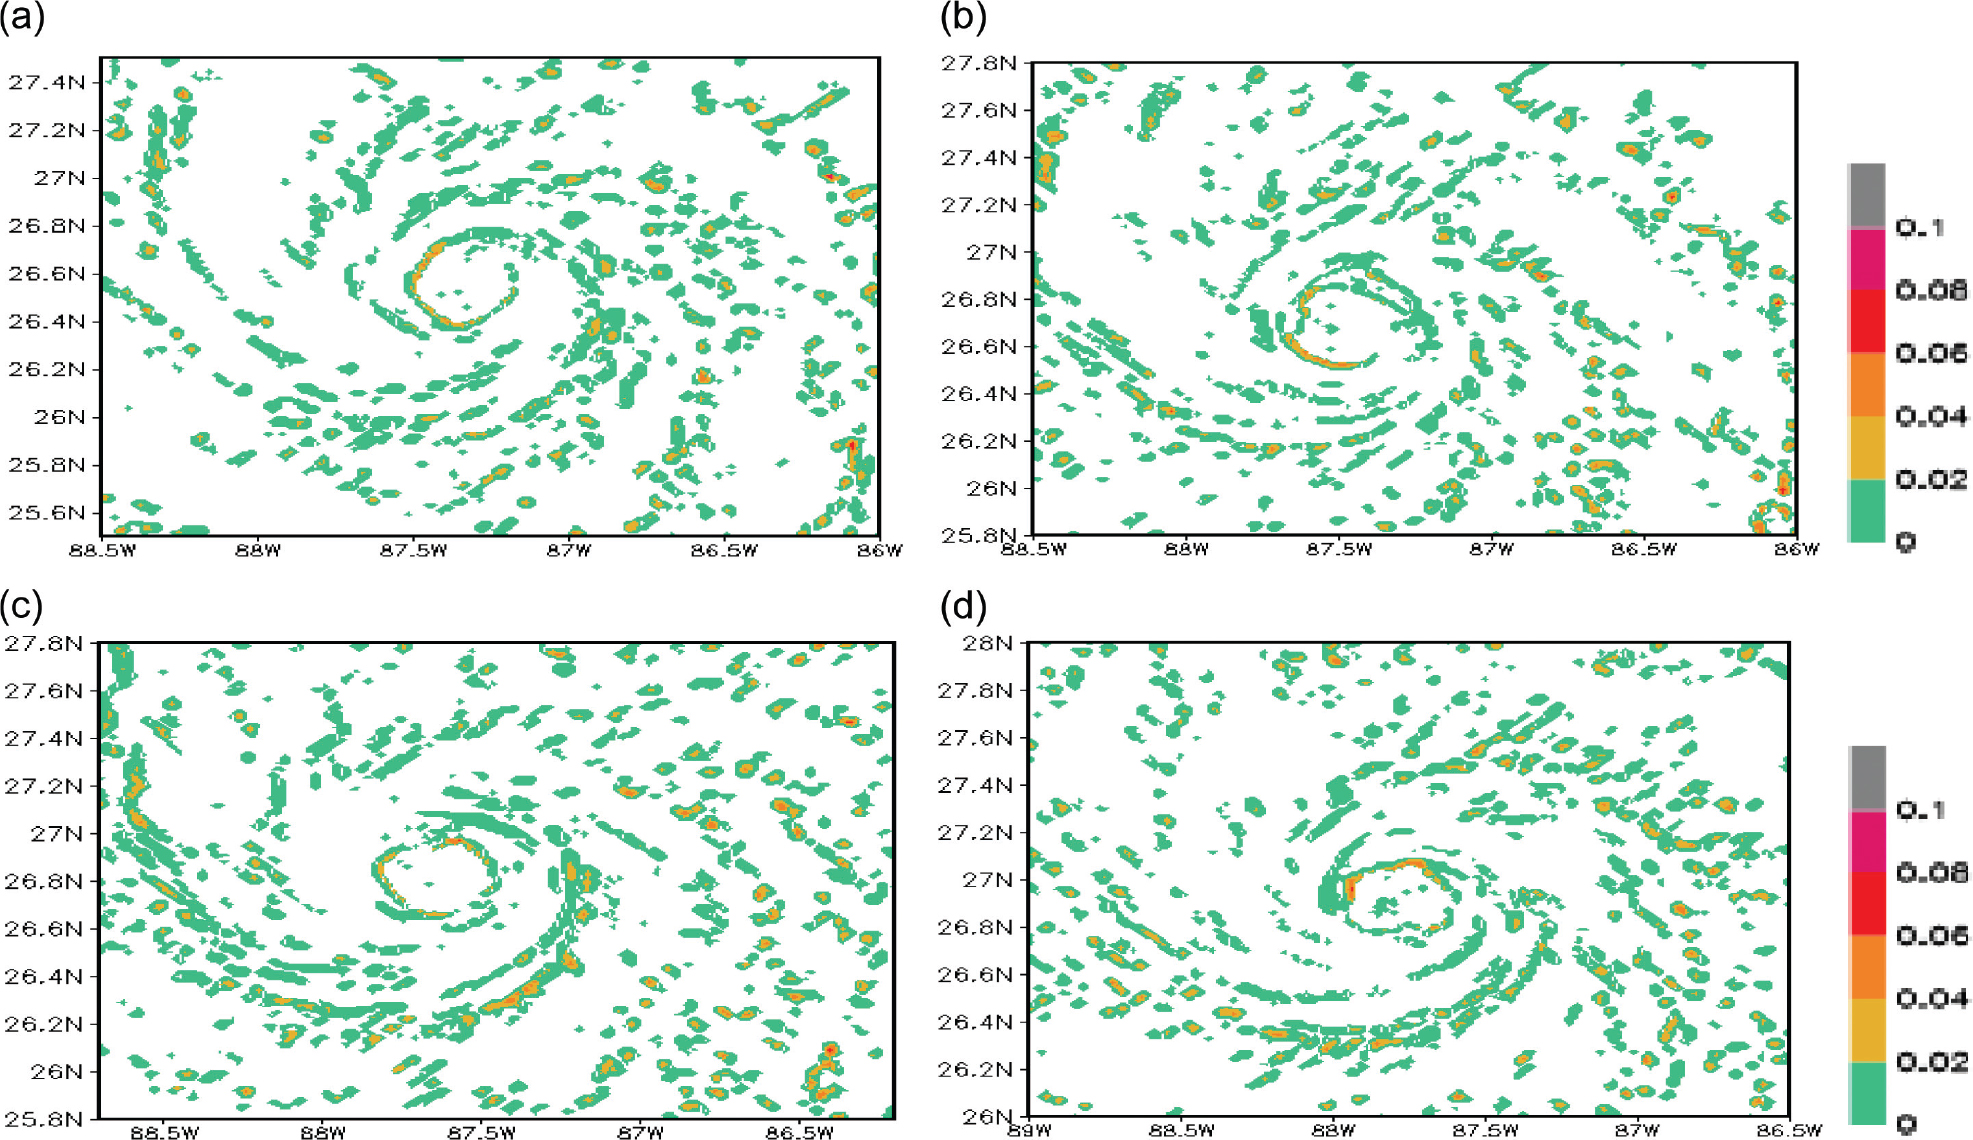
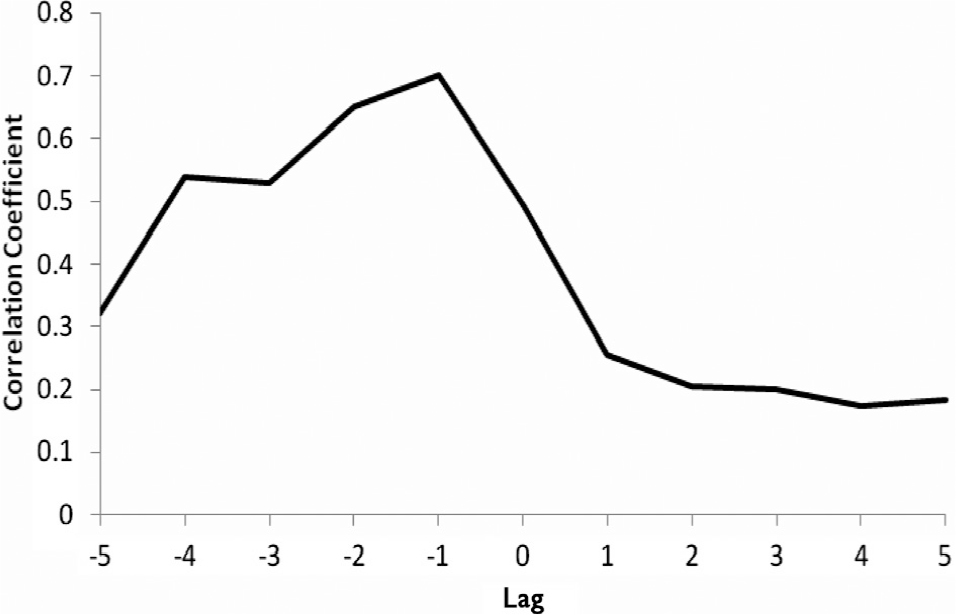
Fig. 23.
Lag correlations (along ordinate) between the buoyancy, at 850 hPa level) and the liquid water mixing ratio (vertically integrated from 950 to the 450 hPa level). The abscissa denotes the lag in hours. Minus sign denotes liquid water leading the buoyancy.