
Table 1
Summary statistics with grade point average scores and neighbourhood socioeconomic status deciles.
| SUBJECTS. IE, CHILDREN: N = 20,578 OBS | |||||
|---|---|---|---|---|---|
| Initial NSES, mean (SD) | −1.27 (1.91) | ||||
| Grades from the norm‑referenced grading system, mean (SD) | 2.95 (0.77) | ||||
| Completed within the norm‑ref. system | 7,713 (37.5%) | ||||
| Grades from the criterion‑referenced grading system, mean (SD) | 188.35 (67.69) | ||||
| Completed within the criterion‑ref. system | N = 12,865 (62.5%) | ||||
| Standardised GPA, mean (SD) | −0.25 (1.04) | ||||
| Unique families | 10 419 | ||||
| Number of siblings, mean (SD) | 2.85 (1.55) | ||||
| Male | N = 10,971 (52.57%) | ||||
| Firstborn | N = 7,208 (34.54%) | ||||
| Year of birth, mean (SD) | 1,982 (3.89) | ||||
| Year of immigration, mean (SD) | 1,988 (1.76) | ||||
| Age at immigration. mean (SD) | 6.23 (3.59) | ||||
| DECILE | INITIAL NSES MEAN (MIN, MAX) | STANDARDIZED GPA (1988–2018) | GRADES FROM NORM‑REFERENCED GRADING SYSTEM (1988–1997) | GRADES FROM CRITERION‑REFERENCED GRADING SYSTEM (1998–CURRENT) | |
| 1 | 1.21 (2.75, 0.66) | −0.17 | 2.98 | 192.8 | |
| 2 | 0.37 (0.66, 0.14) | −0.25 | 2.95 | 187.6 | |
| 3 | −0.07 (0.14, −0.28) | −0.22 | 2.98 | 189.6 | |
| 4 | −0.48 (−0.28, −0.66) | −0.25 | 2.98 | 187.9 | |
| 5 | −0.86 (−0.66, −1.07) | −0.28 | 2.92 | 188.2 | |
| 6 | −1.31 (−1.07, −1.59) | −0.21 | 2.97 | 190.4 | |
| 7 | −1.89 (−1.59, −2.29) | −0.24 | 2.92 | 190.4 | |
| 8 | −2.75 (−2.29, −3.26) | −0.25 | 2.96 | 190.1 | |
| 9 | −3.94 (−3.27, −4.70) | −0.25 | 3.02 | 186.3 | |
| 10 | −6.41 (−4.72, −12.85) | −0.46 | 2.76 | 172.6 | |
[i] Notes: Standardized GPA scores ranged from a minimum of −3.42 points to a maximum of 2.57 points and on a scale of 0–5 points within a norm‑referenced grading system and from 0–320 points within the criterion‑referenced grading system, respectively.
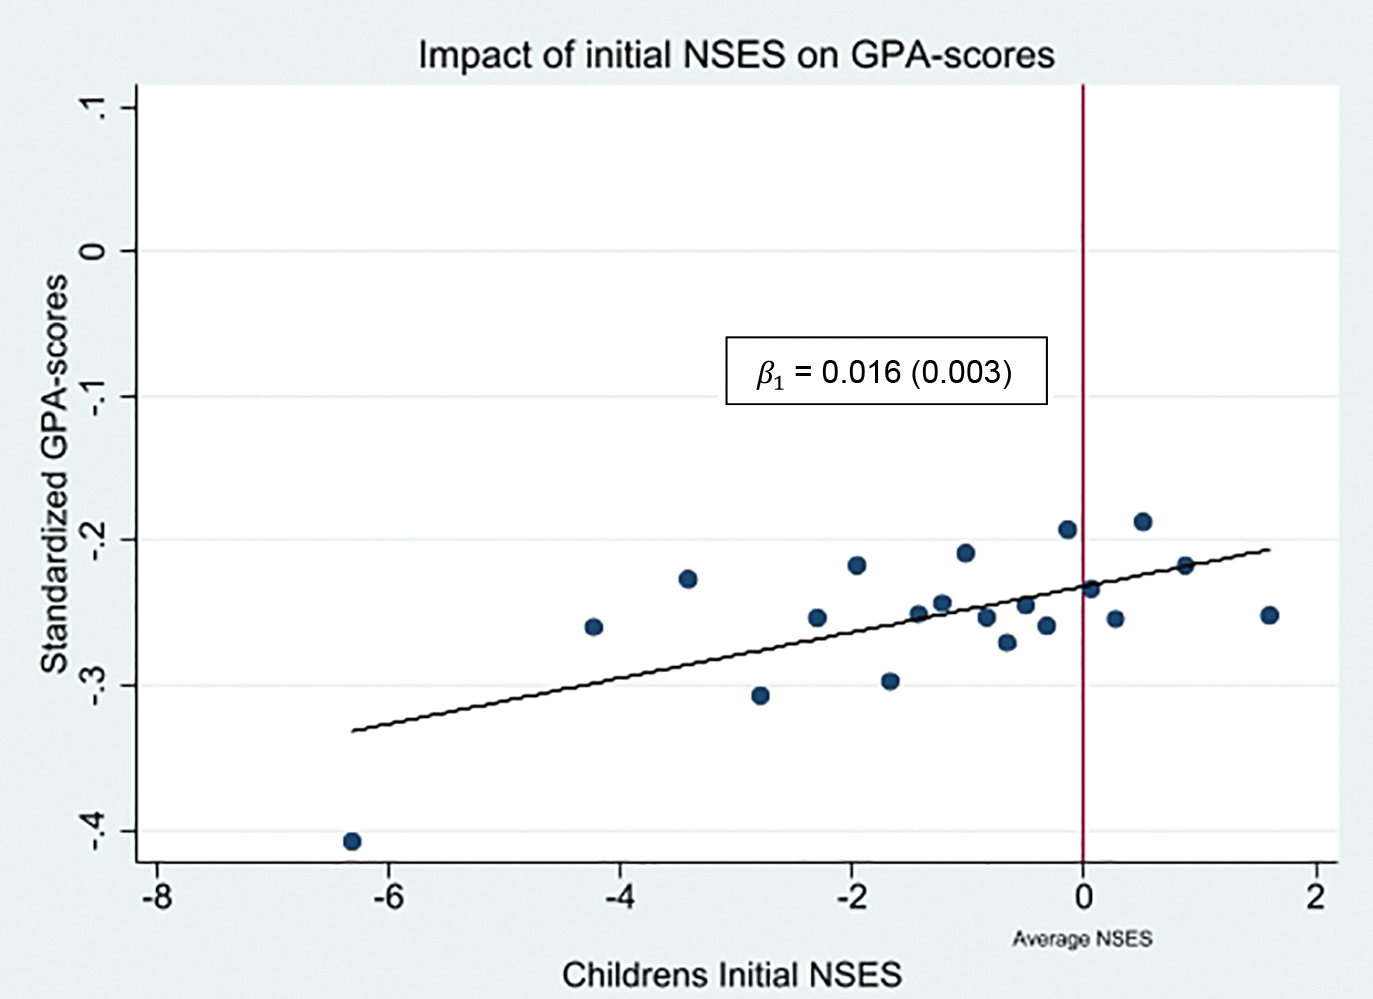
Figure 1
Relationship between neighbourhood socioeconomic status and grade point average scores.
Notes: The graph is a visual representation of the relationship between initial NSES and GPA‑scores. The coefficient is estimated at 0.016. Bin scatter groups the NSES variable into equal‑sized bins, computes the mean of each NSES and GPA‑scores variable within each bin, then create a scatterplot of these data points. It also plots a fitted line based on the underlying data. In the regression models, we controlled for parents’ country of origin, as well as parents’ year of arrival and child’s sex and year of graduation as fixed effects.
Table 2
Full regression of the main analysis: Neighbourhood socioeconomic status and grade point average scores.
| MODEL 1 | MODEL 2 | MODEL 3 | MODEL 4 | |
|---|---|---|---|---|
| NSES | 0.016*** [0.009, 0.023] | 0.015*** [0.008, 0.023] | 0.016*** [0.009, 0.023] | 0.015*** [0.008, 0.022] |
| Sex | – | 0.314*** [0.288, 0.341] | 0.308*** [0.281, 0.335] | 0.308*** [0.282, 0.335] |
| Child’s age at immigration | – | – | −0.221*** [−0.195, −0.246] | −0.222*** [−0.196, −0.247] |
| Mother’s age at immigration | – | – | – | 0.009*** [0.005, 0.013] |
| Father’s age at immigration | 0.011*** [0.006, 0.015] | |||
| Observations | 20 555 | 20 555 | 20 555 | 20 555 |
[i] Notes: In the regression models, we controlled for parents’ country of origin, as well as the parents’ year of arrival and child’s sex and year of graduation as fixed effects.
Table 3
Neighbourhood socioeconomic status and grade point average scores, stratified by sex.
| BOYS | GIRLS | |
|---|---|---|
| NSES | 0.011** [0.002, 0.021] | 0.020*** [0.010, 0.030] |
| Child’s age at migration | −0.182*** [−0.218, −0.147] | −0.264*** [−0.302, −0.227] |
| Mother’s age at migration | 0.009*** [0.003, 0.015] | 0.009*** [0.003, 0.015] |
| Father’s age at migration | 0.010*** [0.004, 0.016] | 0.011*** [0.005, 0.017] |
| Observations | 10,791 | 9,764 |
Table 4
Neighbourhood socioeconomic status and grade point average scores, stratified by age at migration.
| 0–2 YEARS | 3–6 YEARS | 7–12 YEARS | 13+ YEARS | |
|---|---|---|---|---|
| NSES | 0.011 [−0.006, 0.029] | 0.015*** [0.004, 0.026] | 0.018*** [0.006, 0.029] | 0.014 [−0.013, 0.041] |
| Sex | 0.302*** [0.231, 0.372] | 0.300*** [0.259, 0.342] | 0.321*** [0.278, 0.364] | 0.251*** [0.147, 0.356] |
| Children age at migration | –0.445*** [–0.556, −0.33] | –0.457*** [–0.521, −0.393] | –0.239*** [–0.282, −0.196] | –0.080* [–0.171, 0.011] |
| Mothers age at migration | 0.002 [–0.007, 0.011] | 0.012*** [0.005, 0.018] | 0.010*** [0.003, 0.018] | 0.026** [0.004, 0.047] |
| Fathers age at migration | 0.011** [0.002, 0.021] | 0.004 [–0.002, 0.010] | 0.018*** [0.010, 0.026] | 0.030** [0.005, 0.055] |
| Observations | 3236 | 8572 | 7444 | 1298 |
Table 5
Neighbourhood socioeconomic status and long‑term outcomes at ages 25 and 30 years.
| PERCENTILE RANKED INCOME | NUMBER OF UNEMPLOYMENT DAYS | PROBABILITY OF HAVING A COLLEGE DEGREE | |
|---|---|---|---|
| Outcome at 25 years | |||
| Initial NSES | 0.305* [0.039, 0.572] | −0.744* [−1.363, −0.125] | 0.017* [0.002, 0.031] |
| Controls | Yes | Yes | Yes |
| Observations | 12,409 | 12,424 | 8,883 |
| Outcome at 30 years | |||
| Initial NSES | 0.462*** [0.127, 0.797] | −1.332*** [−2.179, −0.485] | 0.026*** [0.009, 0.043] |
| Controls | Yes | Yes | Yes |
| Observations | 8,228 | 8,245 | 6,819 |
[i] Notes: Clustered robust standard errors in parentheses. Confidence intervals are reported in square brackets. The regression models are controlled for parents’ country of origin, parents’ year of arrival, sex and year of graduation. ***p < 0.001, *p < 0.05. NSES = neighbourhood socioeconomic status.
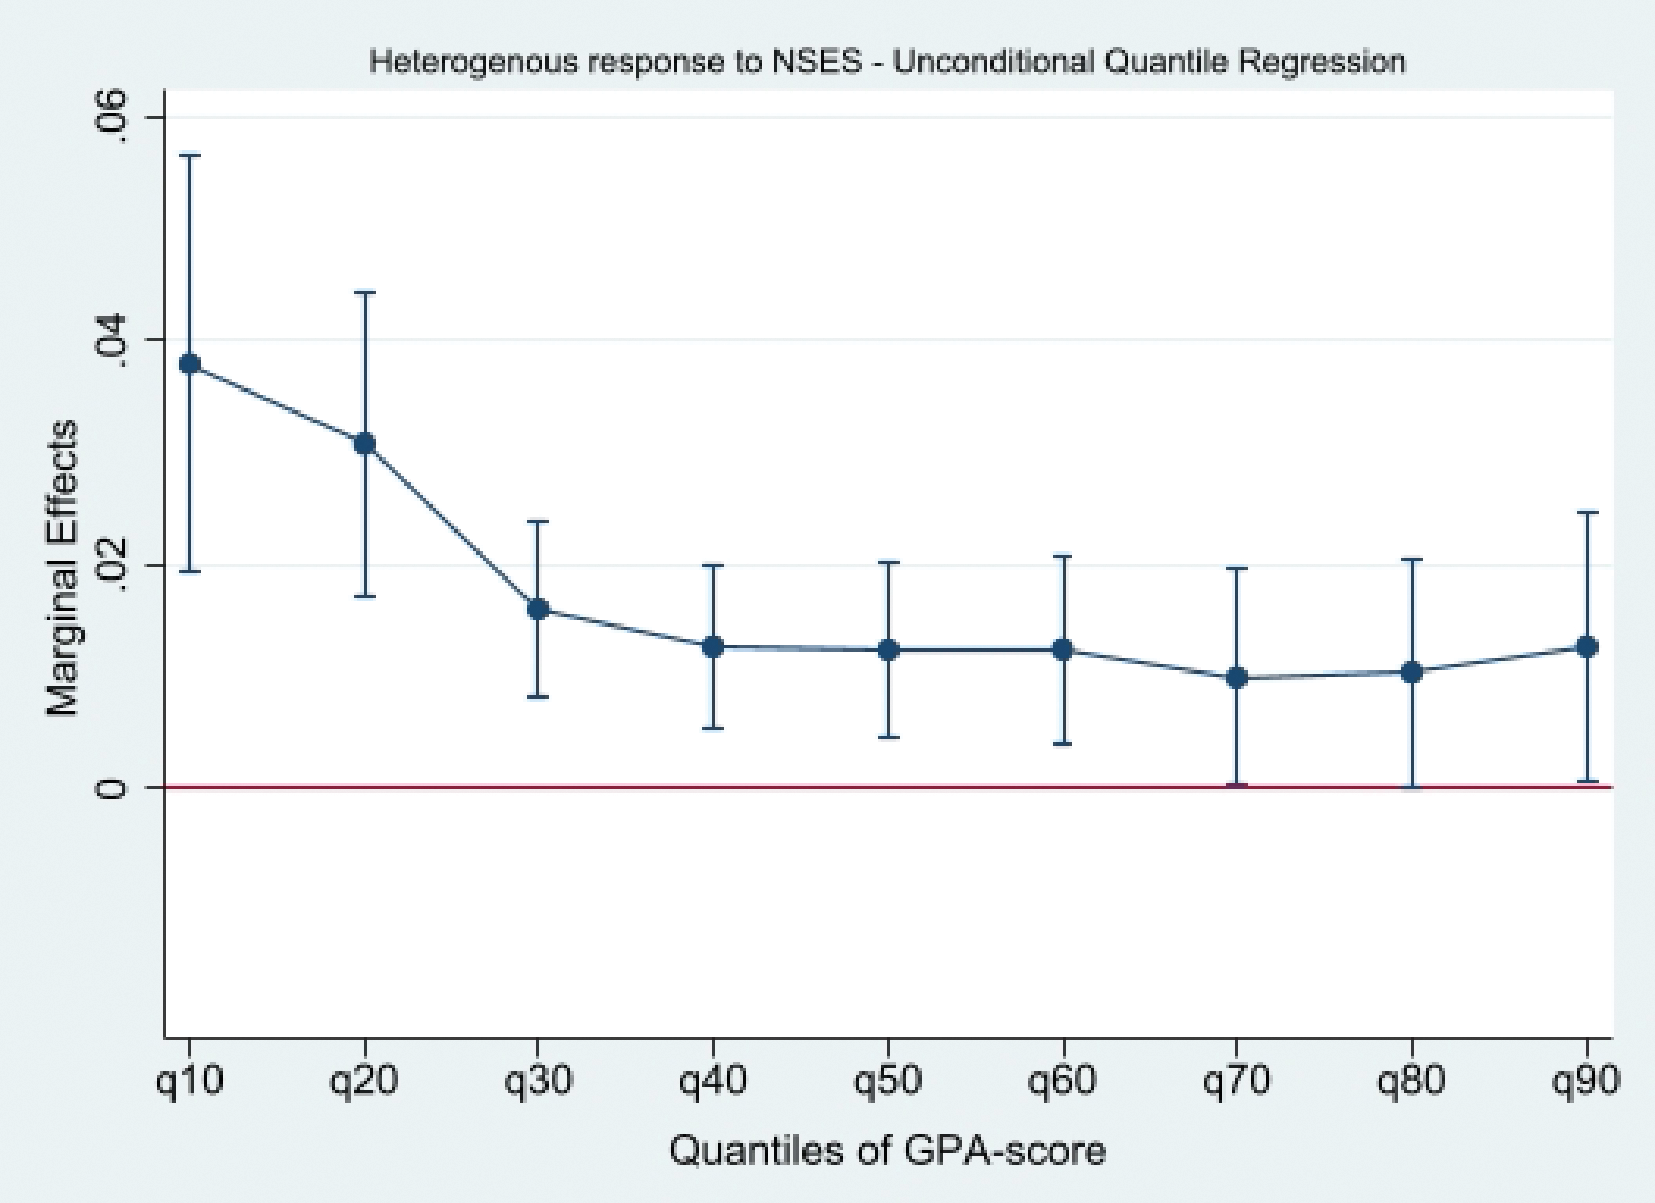
Figure 2
Marginal grade point average scores and neighbourhood socioeconomic status by foreign background.
Notes: The figure shows the marginal changes in GPA‑scores. Quantiles of GPA is shown on the x‑axis, and marginal change in GPA‑scores on the y‑axis. The solid blue line represents relationships and dots point estimates with corresponding 95% CI at each quantile. A refence line at zeros is added to show which coefficients are significantly different from zero. We controlled for parents’ country of origin, as well as parents’ year of arrival and child’s sex and year of graduation as fixed effects.