
Introduction
Over the last 50 years, Sweden has seen a rise in the proportion of individuals with a foreign background. In 1970, approximately 7% of Sweden’s population was foreign‑born, a figure which increased to approximately 20% by 2023. With them composing a growing proportion in the population, there is increasing interest in the educational outcomes of immigrant children in Sweden. Children with immigrant backgrounds tend to have lower educational performances compared to their native‑born peers. According to data from Cerna et al. (2019), 76% of native‑born Swedish students meet the benchmark proficiency levels in reading, mathematics and science, compared to only 49% of immigrant students. Educational performances, assessed by grade point averages (GPAs), may reflect an immigrant student’s ability to navigate the education system. GPAs also reflect various dimensions of integration, such as language proficiency, social adaptation and the ability to engage with peers and teachers. Previous research has shown that academic success is linked to higher levels of social integration, as it reflects individual effort and the extent to which a student has adapted to the social and educational environment (Portes & Rumbaut 2001; Portes 2005). Moreover, a student’s GPA provides an accessible, quantifiable measure that allows for both cross‑sectional and longitudinal analysis, thus making it a valuable tool for studying integration over time.
The lower educational performance of immigrant students has been a focus of extensive research, with various theories used to understand these disparities. Assimilation‑based theories suggest that immigrants make pragmatic decisions to enhance their quality of life, such as improving proficiency in the local language, increasing interactions with natives, becoming familiar with the host country’s culture and norms, pursuing upward mobility through education or economic success, and gaining a better understanding of institutional functions (see Alba & Nee 2003; Portes 2005; Smith et al. 2018). Other research has focused on the timing and duration of adverse exposures using a life‑course approach. This approach includes critical exposure periods (early childhood and adolescence) and cumulative exposure, highlighting that children raised in adverse social conditions tend to exhibit poorer outcomes such as lower levels of skills and abilities (see Ben‑Shlomo & Kuh 2002; Cunha & Heckman 2007) as well as chronic stress, which may influence cognitive development. Another related body of research, ie, studies on neighbourhood effects, emphasises the critical role of a child’s immediate environment in shaping their future human capital formation. The origin of neighbourhood effects on various individual outcomes is a central theme in previous literature. According to this literature, the characteristics of a child’s environment can have enduring effects on their future outcomes (see Galster 2012; Jencks & Mayer 1990; Pebley & Sastry 2003; Sampson et al. 2002). Furthermore, neighbourhood characteristics influence behaviour through peer effects, which can include both positive influences, such as diligence, and negative ones, such as externalising behaviour (Kendler et al. 2020), which may influence school grades.
Grönqvist (2006); Grönqvist & Niknami (2017, 2020) have examined the school performance of immigrant children in Sweden, focusing on developments since the 1990s. They have shown that adolescents with an immigrant background have poorer educational performance than their native counterparts, and this may partly be explained by the quality of their neighbourhood environment (see also Getik et al. 2024). Previous Swedish studies on the educational performance of immigrant students have mainly focused on the impact of the ethnic composition in neighbourhoods on their academic outcomes (see Åslund et al. 2011; Bygren & Szulkin 2010; Johnston, et al. 2005; Neuman 2016; Szulkin & Jonsson 2007). However, more recent research suggests that it is not only the ethnic composition that plays a critical role but also the socioeconomic composition within a neighbourhood (see Andersson et al. 2024; Chakraborty & Schüller 2022). The key argument is that the socioeconomic characteristics within a neighbourhood serve as a proxy for the ‘quality’ of the information, behaviours and norms that occur within the neighbourhood. This body of literature suggests that neighbourhood effects mainly operate through social interactions and social capital, facilitating the formation of networks and the transmission of essential knowledge, which may significantly influence children’s future outcomes (see Kohen et al. 2008; List et al. 2020; Wodtke et al. 2016, but also Ellen & Turner 1997; Galster 2012). In a similar way, contact theories (Allport et al. 1954) posit that inter‑group interactions within small geographic areas foster trust – a view supported by Dinesen and Sønderskov (2018). Nannestad (2004; 2009) further emphasises the importance of social interactions within local geographic areas as a key factor in integration. Empirical studies provide strong support for these theoretical perspectives. For example, research demonstrates that exposure to specific socioeconomic characteristics within a neighbourhood – such as access to high‑quality education, economic prosperity and high social capital – significantly influences children’s future outcomes (see Chetty et al. 2014, 2018; Chyn 2018; Delmos 2022; van Ham et al. 2012). It has also been shown that neighbourhood socioeconomic characteristics are associated with the physical environment, including both health‑promoting and health‑damaging resources (Kawakami et al. 2011). These findings indicate that the socioeconomic composition of a neighbourhood may shape important outcomes later in life. Furthermore, these socioeconomic factors may be especially crucial for individuals with limited prior experience or access to information about behaviours, networks and norms (Kramarz & Skans 2014; Mogstad & Torsvik 2023).
In summary, recent research has highlighted the significant influence of the socioeconomic characteristics of a person’s childhood neighbourhood on their later‑life outcomes. However, despite the potential importance of these neighbourhood factors, there is surprisingly little understanding of their impact on the educational performance of refugee children, which may be particularly vulnerable, and this gap in the literature motivates our study. The first aim of this study is to examine the impact of neighbourhood socioeconomic status (NSES) of refugee children’s initial neighbourhoods on their future educational performances. Second, we also seek to determine which group of students may benefit most from an improved NSES. Specifically, we hypothesise that refugee children who were exposed to higher NSES in their initial neighbourhoods performed better academically later in life and vice versa, and that low‑performing students may benefit the most from a higher initial NSES. The main empirical challenge in neighbourhood effect studies is the self‑selection of immigrants into neighbourhoods, making their residential choice endogenous. In this study, to get around this endogeneity problem, we made use of a dispersal placement policy that was implemented in Sweden between 1985 and 1994 (see Edin et al. 2003). If we can assume that the initial neighbourhood of a refugee within a given municipality was random, we will allow for a better causal interpretation of the results in relation to our research questions.
Our paper makes three main contributions to the literature. Our first contribution is the specific focus on how neighbourhood socioeconomic characteristics impact refugee children’s educational outcomes. Our second contribution lies in examining the initial neighbourhood conditions refugee children encounter upon arrival, building on previous research that demonstrates how initial conditions in the host country may influence immigrants’ future integration. Aksoy et al. (2023), Åslund and Rooth (2007), Damm (2014) and Hangartner et al. (2019) found that refugees placed in favourable neighbourhood conditions upon arrival achieved better labour market outcomes. Furthermore, in Sweden, the placement of immigrants, including refugees, continues to be a key focus in discussions on effective integration policies (see Mottagandeutredningen, SOU 2018:22). Countries such as the United Kingdom, Denmark (see Damm 2005), Norway (see Solodoch 2023) and Germany have implemented or are exploring policies to shape immigrants’ initial settlement conditions (see also Bansak et al. 2018; Martén et al. 2019; Trapp et al. 2018). Finally, our third contribution is to shift the focus from ethnic factors, which dominate much of the existing literature, to neighbourhood socioeconomic characteristics and their impact on educational outcomes.
The swedish spatial dispersal policy, 1985–1994
The study population consisted of children and adolescents exposed to Sweden’s spatial dispersal policy for refugees. This policy was applied from 1985–1994, and refugees were assigned to specific municipalities upon receiving their residence permits. The policy aimed to distribute the refugees evenly across Swedish municipalities and share the economic costs associated with their support (Andersson 2003; Robinson et al. 2003). Initially, 60 municipalities participated in the policy; however, due to the increasing numbers of arrivals, the number of municipalities increased to 277 out of 284 municipalities by 1989. By 1991, the policy was applied less consistently (see Åslund & Rooth 2007; Edin et al. 2003). The policy involved a two‑stage assignment process. In the first stage, refugees were assigned to an immigrant centre while awaiting decisions on their residence permits, a process that typically lasted between 3 and 12 months. Once approved, refugees were assigned to municipalities, with families being treated as units and placed together. The Swedish Board of Immigration negotiated the number of refugees that each municipality could accept. Placement officers, who did not interact directly with the refugees, had access to information such as sex, education level, marital status, family size and country of origin when deciding on the initial neighbourhood assignments. In the second stage, municipalities placed refugees in specific neighbourhoods using local agencies (eg, ‘den kommunala invandrarbyrån’) (Soininen 1992). Refugees were housed through municipality‑owned housing companies, with apartments available across a range of neighbourhood types, from affluent to disadvantaged areas (see Figure S1, which illustrates the distribution of refugees across different neighbourhoods in Stockholm). Table S1 in the Appendix provides the absolute numbers and percentages of refugees from the top five source countries. In the sample, the largest share of refugees originated from the following five countries: Iran (25.39%), Chile (12.97%), Lebanon (11.80%), Turkey (5.61%), and Iraq (4.93%). In total, refugees came from 131 different countries, highlighting a diverse range of countries. Individuals coming from wealthier nations, such as the United States and Canada, represented a smaller proportion (1.57%).
For the purposes of this study, refugees were defined based on their recorded immigration status in administrative data at the time of arrival during the dispersal policy period. We used data from the Swedish longitudinal database for integration (STATIV) to define the population. For inclusion, the child or at least one parent had to be registered with the following grounds for residence in Sweden: ‘Humanitarian grounds’, ‘Need for protection’, ‘Other refugees’, or ‘Other’. Note, more than 90% of the individuals included in this study fell into one of the first three categories. Those who came for studies or work were excluded, ie, those who were not apparent refugees. The empirical analysis focused on non‑European immigrants who arrived in Sweden between 1985 and 1991, as the dispersal policy became less restrictive after 1991 (Andersson 2003; Robinson et al. 2003). This resulted in a population of 30,075 individuals. We excluded individuals who had emigrated and, therefore, did not have a final grade registered before the age of 19 years, totalling 9,204 exclusions. After these adjustments, the study population consisted of 20,871 individuals (see Figure S2).
Data
We used administrative registers provided to us by Statistics Sweden (SCB) to construct the study dataset. Various registers were matched using the Swedish 10‑digit personal ID‑number. The ID‑numbers were replaced with serial numbers to preserve confidentiality. The following data sources were used: LISA (Longitudinal Integration Database for Health Insurance and Labor Market Studies) containing information about education, income, employment and receiving social welfare; the Total Population Register with information about marital status and year of citizenship from 1968 and onwards; the Multi‑generation Register, containing information on sex, birth year, country of birth, and parents, for everyone born in Sweden after 1932 or immigrating together with their parents; the Education Register for information about school grades in ninth grade, ie end of compulsory school. Of importance for this study is that the data includes detailed geographical information, given by place of residence at SAMS level. In addition, the data contains information on date of immigration and emigration.
Outcome variable
We used an administrative graduation register for the period 1988–2008, which contained information on GPAs from compulsory schooling at ninth grade for students at a typical graduation age of 16 years. In our sample, individuals are typically 17 years old (98.89%) when they complete ninth grade, with most having graduated by 19 years of age. In Sweden, all children aged 7–16 years were required to attend compulsory school during the study period. Education is regulated in accordance with the national syllabus as outlined by the Education Act (2010: 800) and the Compulsory School Ordinance Act (1994: 1194). Since the early 1990s, the Swedish school system has been decentralised. While the overall framework is governed by national legislation, municipalities have been responsible for its implementation. Two important aspects relevant to this study are that Swedish municipalities are responsible for assigning students to schools and that school admissions are typically based on the residential proximity principle ‘närhetsprincipen’ (Edmark 2014). Thus, the initially assigned neighbourhood of the children largely determined the school they attended (see, eg, Björklund et al. 2003; Getik et al. 2024; Holmlund, Sjögren & Öckert 2019). During the examined period, the educational grading system underwent some changes. Prior to 1997, students were graded using a norm‑referenced grading system, with grades assigned on a scale of 1–5 points, where students’ performances were evaluated compared to those of their cohort peers. After 1997, a criterion‑referenced grading system was introduced, where students’ grades were determined based on a set criterion. Here, students who fulfilled a minimum level criterion would pass, while meeting additional criteria rendered distinctions (Lundahl 2002). Due to changes in the Swedish grading system, we standardised GPA scores by year of graduation, according to the following formula: where is individual i’s final GPA score, is the mean GPA score and is the standard deviation at year t. Standardisation captured the relative performance of students each year, ensuring that grades were comparable across different grading systems. Standardisation also addressed grade inflation observed in the criterion‑referenced grading system (see eg, Cliffordson 2004; Vlachos 2010). The GPA characteristics of the study population are presented in Table 1. We also analysed labour market outcomes as percentile‑ranked incomes at the ages 25 and 30 years.
Table 1
Summary statistics with grade point average scores and neighbourhood socioeconomic status deciles.
| SUBJECTS. IE, CHILDREN: N = 20,578 OBS | |||||
|---|---|---|---|---|---|
| Initial NSES, mean (SD) | −1.27 (1.91) | ||||
| Grades from the norm‑referenced grading system, mean (SD) | 2.95 (0.77) | ||||
| Completed within the norm‑ref. system | 7,713 (37.5%) | ||||
| Grades from the criterion‑referenced grading system, mean (SD) | 188.35 (67.69) | ||||
| Completed within the criterion‑ref. system | N = 12,865 (62.5%) | ||||
| Standardised GPA, mean (SD) | −0.25 (1.04) | ||||
| Unique families | 10 419 | ||||
| Number of siblings, mean (SD) | 2.85 (1.55) | ||||
| Male | N = 10,971 (52.57%) | ||||
| Firstborn | N = 7,208 (34.54%) | ||||
| Year of birth, mean (SD) | 1,982 (3.89) | ||||
| Year of immigration, mean (SD) | 1,988 (1.76) | ||||
| Age at immigration. mean (SD) | 6.23 (3.59) | ||||
| DECILE | INITIAL NSES MEAN (MIN, MAX) | STANDARDIZED GPA (1988–2018) | GRADES FROM NORM‑REFERENCED GRADING SYSTEM (1988–1997) | GRADES FROM CRITERION‑REFERENCED GRADING SYSTEM (1998–CURRENT) | |
| 1 | 1.21 (2.75, 0.66) | −0.17 | 2.98 | 192.8 | |
| 2 | 0.37 (0.66, 0.14) | −0.25 | 2.95 | 187.6 | |
| 3 | −0.07 (0.14, −0.28) | −0.22 | 2.98 | 189.6 | |
| 4 | −0.48 (−0.28, −0.66) | −0.25 | 2.98 | 187.9 | |
| 5 | −0.86 (−0.66, −1.07) | −0.28 | 2.92 | 188.2 | |
| 6 | −1.31 (−1.07, −1.59) | −0.21 | 2.97 | 190.4 | |
| 7 | −1.89 (−1.59, −2.29) | −0.24 | 2.92 | 190.4 | |
| 8 | −2.75 (−2.29, −3.26) | −0.25 | 2.96 | 190.1 | |
| 9 | −3.94 (−3.27, −4.70) | −0.25 | 3.02 | 186.3 | |
| 10 | −6.41 (−4.72, −12.85) | −0.46 | 2.76 | 172.6 | |
[i] Notes: Standardized GPA scores ranged from a minimum of −3.42 points to a maximum of 2.57 points and on a scale of 0–5 points within a norm‑referenced grading system and from 0–320 points within the criterion‑referenced grading system, respectively.
Exposure variable
We defined neighbourhoods using detailed geographical small‑area market statistics (SAMS) (see Amcoff 2016). There are approximately 9,200 SAMS in Sweden, and the average population in each SAMS is around 1,000 residents. Individuals in our sample were assigned to 4,833 SAMS. Empirical studies have used a variety of proxies to define neighbourhood quality (see Dietz 2002: 556–563). The large number of potential definitions point to one important feature of neighbourhood quality – namely, that they are multidimensional and have several determinants. In this study, we defined neighbourhood quality using an approach that has previously been used to study the relationship between NSES and several health outcomes (see eg, Kendler et al. 2014; White et al. 2016; Winkleby et al. 2007). We applied a principal component analysis (PCA) to SAMS‑level information based on four neighbourhood socioeconomic characteristics to construct an aggregated NSES measure. These characteristics were: percentage with low income, percentage with unemployment, percentage with low educational status and percentage of residents receiving social welfare assistance of the working population in each SAMS area, ie, those aged between 25 and 64 years. We constructed the NSES index for each SAMS neighbourhood using observations from both Swedish and foreign‑born residents for the years 1985–1994. The input variables loaded onto the first principal component (+0.55–0.43) and the first component explained 47% of the total variation between these variables. Because the eigenvalue was greater than 1, we retained the first principal component. Moreover, the Kaiser–Meyer–Olkin (KMO) value, which is the variance not shared with other variables, needs to be low for factor analysis to be useful. In our case, for all variables, the KMO was greater than 0.5, and the overall KMO was 0.61, which indicated that PCA for our sample was useful. The NSES index is standardised per year with a mean of 0 and a standard deviation of 1. Furthermore, the distribution of NSES was skewed due to lower NSES scores being primarily found in segregated metropolitan areas. In Table 1, summary statistics for the sample and the distribution of our NSES index are presented. The NSES of the initially assigned neighbourhoods ranged between −12.85 and 3.15, with a standard deviation of 1.91, where negative values indicated a lower NSES and positive values indicated a higher NSES. The average initial NSES in our study sample was −1.27 below the mean in the overall Swedish population, indicating that refugees, on average, were assigned to neighbourhoods with lower NSES.
Control variables
The control variables included: country of origin, year of arrival, age at arrival, marital status at the time of arrival and parents’ level of education. We also considered family size, the number of siblings and whether the child was the firstborn. For the children, we included similar variables as for the parents: sex, country of birth, age at arrival and year of graduation.
Peri‑migration family socioeconomic characteristics can impact the educational performance of immigrant children (see Björklund & Jäntti (2020)). We therefore controlled for several parental characteristics to isolate the effect of initial NSES on educational outcomes. The country of origin can influence parents’ integration process, particularly through challenges such as language barriers (Cummins 2000). These barriers may limit parental involvement in their children’s education, making it difficult to assist with homework, attend school meetings or communicate effectively with teachers. As a result, children may receive less academic support, which can negatively affect their educational outcomes (Smith et al. 2016). Other parental characteristics, such as year of arrival, age at arrival and marital status at the time of arrival, are closely linked to the level of education the parents have attained. These background factors may, in turn, shape the educational environment and expectations within the household. Parental education is often strongly correlated with country of origin (Portes & Rumbaut 2001). Beyond structural factors, these characteristics can also influence students’ achievement through aspirations and cultural values related to education. In some cultures, academic achievement is highly valued, and parents may have strong expectations of their children’s performance. In others, cultural norms may place less emphasis on formal education or introduce additional challenges (Le Goff 2024). Using the family identification number, we also calculated family size, the number of siblings and whether the child was the firstborn. In larger families, resources such as time, money and attention may be limited. Parents with multiple children often have less time for each child, which may reduce opportunities for academic support (Downey 2001). Firstborn children often receive more focused attention during their early years, as parents are more intensively engaged in their academic and social development. These children may also be more likely to conform to parental expectations, potentially leading to better school performance (Belsky & de Haan 2011). At the same time, siblings can introduce a competitive dynamic within the household. Competition for parental attention or academic recognition can produce both motivational and stressful effects (Bong & Skaalvik 2003). These variables help to control for differences in the intra‑household distribution of resources (Hermansen 2016; Meurs et al. 2017).
Regarding the children themselves, we included variables similar to those for parents: sex, country of birth, age at arrival and year of graduation. Research consistently finds sex differences in educational performance amongst immigrant children, with girls generally achieving higher levels of adaptation than boys (Ngo et al. 2020; Qian et al. 2018). Both country of birth and age at arrival are crucial factors for educational outcomes. According to child development theory, arriving at an older age increases the likelihood of school dropout or poor performance (Böhlmark 2008; Lundahl & Lindblad 2018; Skolverket 2016b). Finally, we included year of graduation to account for changes in grading systems, potential grade inflation, peer effects and demographic shifts.
Methods
Our identification strategy was based on variation in exposure to NSES at initial placement upon arriving in Sweden. We used the Swedish dispersal policy to examine the effect of initial NSES on later school performance (see Diez Roux 2004; Oakes 2004 for empirical challenges related to selection bias and causal neighbourhood effects). For a potential causal interpretation of the results, refugees should not have influenced their initial neighbourhood, nor should municipalities systematically have sorted refugees into certain neighbourhoods. However, there are a couple of potential threats to these assumptions. The included individuals could, in the initial stages of the placement process, state a preferred location to the placement officer. One hypothesis is that better‑informed individuals would decline certain neighbourhoods. But, as Åslund et al. (2011) argue, the joint probability of obtaining a residence permit coinciding with vacant housing in a preferred location was extremely low, and stated preferences were therefore limited. Housing constraints within municipalities may thus have been a limiting factor in the number of allocated refugees – although there are empirical objections to this claim (see Dahlberg et al. 2017). Another threat to the exogeneity assumption is municipalities’ involvement in the placement process (see Nekby & Pettersson‐Lidbom 2017). Municipalities’ involvement may give rise to two sorts of potential biases: selection bias if municipalities refused refugees with certain characteristics or ‘cherry‑picked’ amongst them. For example, the municipalities of Finspång initially only wanted Polish refugees (Soininen 1992). Furthermore, sorting bias could have occurred if refugees were systematically allocated into neighbourhoods within municipalities conditional on available housing or other characteristics. For example, the municipality of Bollnäs did not assign refugees into the first available apartment but rather assigned them into neighbourhoods with few(er) social problems and where the apartments were of high(er) quality (Soininen 1992). Prior to presenting our empirical model, we tested the assumption of exogeneity.
Test of exogeneity assumption
A complete randomisation would balance individual covariates across the different exposure groups. We examined whether allocation of refugees into different types of neighbourhoods can be considered random by a balancing test, based on available covariates (the same as those available for the placement officers). To this end, the NSES variable is transposed into three categories: high NSES (one standard deviation above the mean), moderate NSES (within one standard deviation of the mean), and low NSES (one standard deviation below the mean). The balancing test is reported in Table S2. The p‑values suggest that the characteristics of the study subjects, such as age at immigration, sex and household size, are evenly balanced across NSES categories. Nevertheless, some parental characteristics, such as education, showed a certain imbalance. To further assess whether the assumption of a random allocation of refugees into different types of neighbourhoods is valid, we examined the correlations between continuous covariates (the same as those available to the placement officers) and the initial NSES. The correlations, presented in Table S2, showed low correlations between initial NSES and the characteristics of study subjects and their parents, suggesting that individual characteristics are not strongly associated with initial neighbourhood placement.
Empirical model
Our baseline model is specified as follows:
where is our main outcome variable measuring educational performance; we use the GPA score of the individual . ; and a continuous variable is our exposure measure of interest – namely, the assigned SAMS neighbourhood at the year of arrival, . Meanwhile, the coefficient, , represents the mean impact of NSES on GPA scores. Thus, a positive estimate of suggests that higher initial NSES, on average, improves GPA scores. Furthermore, represents the vector of parameters for the individual covariates contained in Table 1. The set of individual covariates is sequentially included in the model. In addition to all the covariates presented in Table 1, country of origin, cause of migration, year of immigration and year of graduation are included in the model. , is an error term assumed to be independent and identically distributed with mean zero and standard deviation sigma. First, we estimate equation (1) using linear regression models in the binned scatterplot function in Stata (StataCorp 2019). A binned scatterplot shows both the estimated mean GPA together with non‑parametric estimates of average GPA scores for various NSES categories (Cattaneo et al. 2025). Second, we assessed the potentially heterogenous impact of NSES on GPA scores using unconditional quantile regression (UQR) (Firpo et al. 2009; Rios‑Avila 2020). UQR revealed heterogenous effect quantiles of the distribution of the dependent variable. In the forthcoming analysis, we estimated the marginal impact of initial NSES effects at the 10th, 20th, …., 90th quantiles of GPA scores. Previous research has indicated that neighbourhood effects may differ by sex (Kling et al. 2007; Ludwig et al. 2013), and we therefore ran the baseline model separately for males and females. We also explored whether the neighbourhood effect during specific developmental stages is differently associated with GPA scores, estimating regressions in age categories as follows: 0–2, 3–6, 7–12, and 13+ years (see Ben‑Shlomo & Kuh 2002). Finally, we assessed the impact of NSES on labour market outcomes (ie, income and number of unemployed days at both 25 and 30 years of age) and the likelihood of obtaining a college degree.
Sensitivity analysis
First, we examined the relationship between each of the four items, used in the construction of the NSES index, and GPA scores. Second, to account for changes in the educational grading system, we estimated separate regressions for each grading framework.
Results
Table 1 shows the mean values of the school grades, including standardised GPA scores, norm‑referenced grades, and criterion‑referenced grades, categorised by initial NSES decile, ranging from 1 (highest NSES) to 10 (lowest NSES) points. For the standardised GPA scores, we observed a 0.29 standard‑deviation point difference, on average, between the first and 10th deciles. For the norm‑referenced grades, a 0.22‑point difference was observed between the first and 10th deciles and, for the criterion‑referenced grades, a 20.2‑point difference was observed. The mean school grades differed significantly by NSES deciles for all three types/measures of school grades (p < 0.001, using ANOVA).
Baseline results: impact of initial NSES on GPA scores
We examined the mean effect of initial NSES on standardised GPA scores, using both a crude and adjusted model. The mean effect of NSES on GPA scores from the crude model is presented in a non‑parametric binned scatter plot in Figure 1 (see Table 2 for the full regression output).
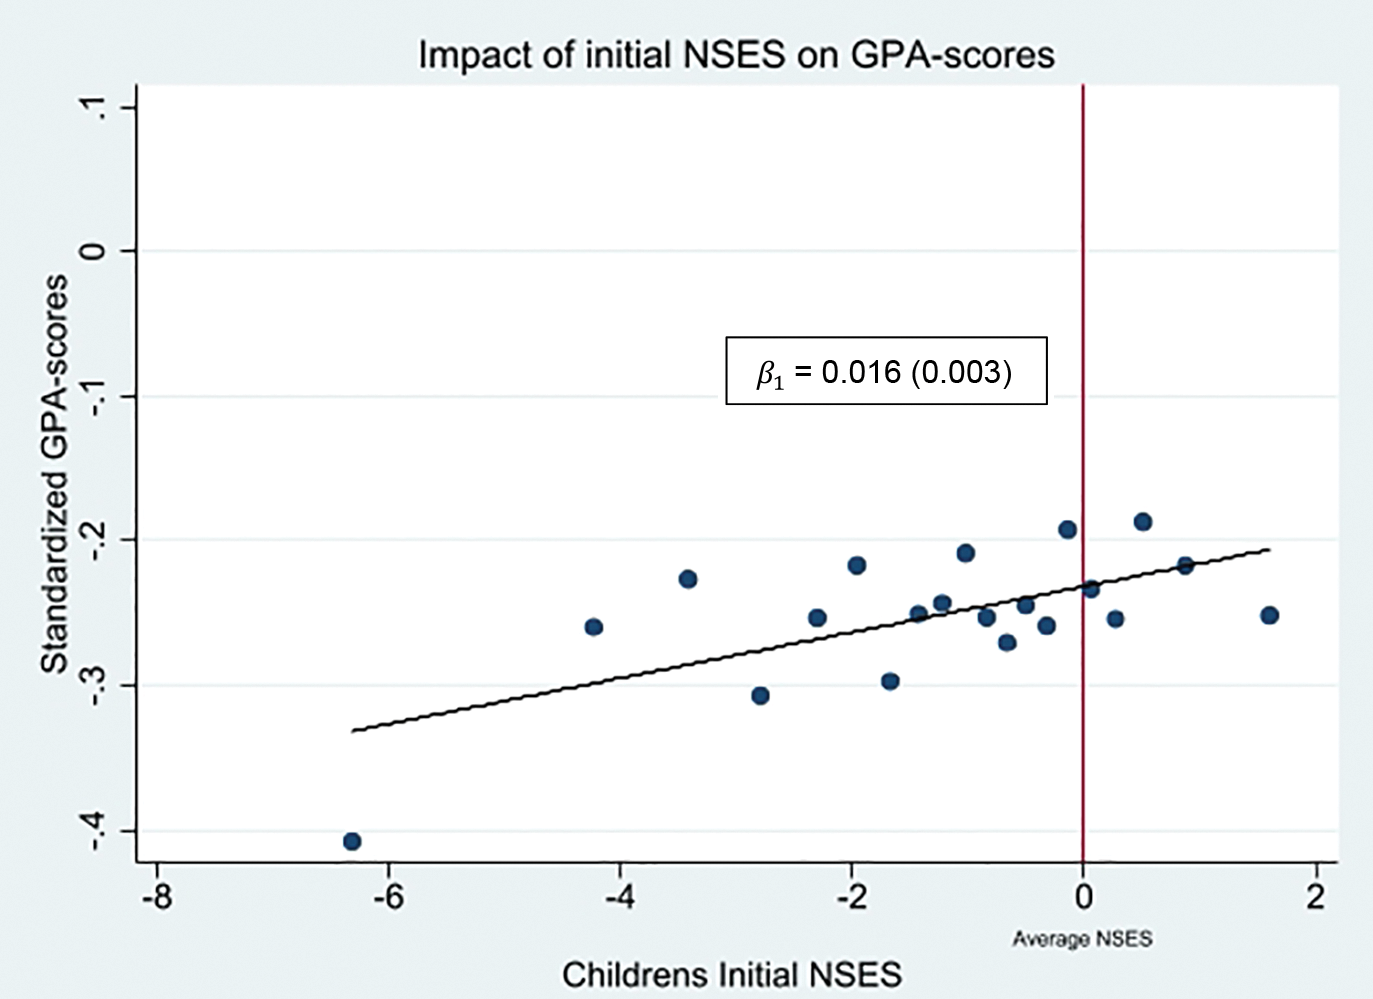
Figure 1
Relationship between neighbourhood socioeconomic status and grade point average scores.
Notes: The graph is a visual representation of the relationship between initial NSES and GPA‑scores. The coefficient is estimated at 0.016. Bin scatter groups the NSES variable into equal‑sized bins, computes the mean of each NSES and GPA‑scores variable within each bin, then create a scatterplot of these data points. It also plots a fitted line based on the underlying data. In the regression models, we controlled for parents’ country of origin, as well as parents’ year of arrival and child’s sex and year of graduation as fixed effects.
Table 2
Full regression of the main analysis: Neighbourhood socioeconomic status and grade point average scores.
| MODEL 1 | MODEL 2 | MODEL 3 | MODEL 4 | |
|---|---|---|---|---|
| NSES | 0.016*** [0.009, 0.023] | 0.015*** [0.008, 0.023] | 0.016*** [0.009, 0.023] | 0.015*** [0.008, 0.022] |
| Sex | – | 0.314*** [0.288, 0.341] | 0.308*** [0.281, 0.335] | 0.308*** [0.282, 0.335] |
| Child’s age at immigration | – | – | −0.221*** [−0.195, −0.246] | −0.222*** [−0.196, −0.247] |
| Mother’s age at immigration | – | – | – | 0.009*** [0.005, 0.013] |
| Father’s age at immigration | 0.011*** [0.006, 0.015] | |||
| Observations | 20 555 | 20 555 | 20 555 | 20 555 |
[i] Notes: In the regression models, we controlled for parents’ country of origin, as well as the parents’ year of arrival and child’s sex and year of graduation as fixed effects.
The linear model showed that a one‑unit increase in initial NSES is associated with, on average, an increase of 0.016 (95% confidence interval [CI] [0.009, 0.0023]) standard deviation points in GPA scores. The estimates were statistically significant at the 1% level. The estimated coefficient should be considered in relation to the mean GPA scores of −0.25 for the study population. Galster (2018) argued that neighbourhood effects and individual outcomes have a non‑linear relationship, and Figure 1 indicates that this might be plausible also in this sample1. The key finding emerging from our estimates shows that, on average, GPA scores improved with increasing NSES. However, it is possible that the effect of improved NSES attenuates for individuals residing in more affluent areas, and individuals exposed to the lowest initial NSES (10%–15% of the study population) might benefit the most from improved NSES (Table 1). In the adjusted analysis, we controlled for sex and both children’s and parents’ ages at immigration. The parameter estimates for the covariates showed that children’s age at immigration decreased the GPA scores with, on average, 0.22 standard deviations per year, and girls generally received higher grades than boys. Fathers’ and mothers’ ages at migration increased GPA scores by 0.011 and 0.009 standard deviation points on average, respectively. Despite the addition of control variables, the association between NSES and GPA was only slightly affected (0.015 (95% CI [0.008, 0.022]), which indicates that there was a minimal confounding from these covariates. This was also supported by the results from the balancing test, where we found a small or no association between these control variables and initial NSES (Table S2). Overall, NSES consistently had a significant positive effect on school grades across all models, indicating that children exposed to higher NSES in their initial neighbourhood tended to perform better academically. In the extended analysis, we accounted for parents’ educational attainment, marital status at immigration, household size and whether the child is the firstborn child or not. Because parental education was missing for a substantial part of the sample, we could only run the adjusted models on a subset of the sample. In the extended analysis, the coefficient for NSES ranged from 0.011 (95% CI [0.002, 0.021]) to 0.012 (95% CI [0.008, 0.026]) across the models, with both estimates remaining statistically significant. This suggests that the differences in parental education and marital status found in the balancing test slightly confounded the initial association. However, this analysis involved a substantial reduction in the number of observations, which also might bias the results.
We also performed stratified analyses based on sex and age at exposure. The results show that higher initial NSES had a significant positive impact on GPA scores in both girls and boys, but the effect seemed to be more pronounced in girls (Table 3), although the interaction tests for sex were not significant. Additionally, we investigated whether the neighbourhood effect differs based on age at migration as a proxy for developmental stage in childhood (Table 4). The results were consistent with the main findings, and only minor differences were found between age groups. In addition, we found that high initial NSES increased the probability of obtaining a college degree and having a lower number of unemployed days and higher income at both 25 and 30 years of age (Table 5). As we move from the lowest to the highest NSES level (see Table 1), income percentiles at ages 25 and 30 years increase with, on average, 2.3 and 3.5 percentiles, respectively. While the increase is relatively small, individuals from higher NSES levels tend to attain better outcomes.
Table 3
Neighbourhood socioeconomic status and grade point average scores, stratified by sex.
| BOYS | GIRLS | |
|---|---|---|
| NSES | 0.011** [0.002, 0.021] | 0.020*** [0.010, 0.030] |
| Child’s age at migration | −0.182*** [−0.218, −0.147] | −0.264*** [−0.302, −0.227] |
| Mother’s age at migration | 0.009*** [0.003, 0.015] | 0.009*** [0.003, 0.015] |
| Father’s age at migration | 0.010*** [0.004, 0.016] | 0.011*** [0.005, 0.017] |
| Observations | 10,791 | 9,764 |
Table 4
Neighbourhood socioeconomic status and grade point average scores, stratified by age at migration.
| 0–2 YEARS | 3–6 YEARS | 7–12 YEARS | 13+ YEARS | |
|---|---|---|---|---|
| NSES | 0.011 [−0.006, 0.029] | 0.015*** [0.004, 0.026] | 0.018*** [0.006, 0.029] | 0.014 [−0.013, 0.041] |
| Sex | 0.302*** [0.231, 0.372] | 0.300*** [0.259, 0.342] | 0.321*** [0.278, 0.364] | 0.251*** [0.147, 0.356] |
| Children age at migration | –0.445*** [–0.556, −0.33] | –0.457*** [–0.521, −0.393] | –0.239*** [–0.282, −0.196] | –0.080* [–0.171, 0.011] |
| Mothers age at migration | 0.002 [–0.007, 0.011] | 0.012*** [0.005, 0.018] | 0.010*** [0.003, 0.018] | 0.026** [0.004, 0.047] |
| Fathers age at migration | 0.011** [0.002, 0.021] | 0.004 [–0.002, 0.010] | 0.018*** [0.010, 0.026] | 0.030** [0.005, 0.055] |
| Observations | 3236 | 8572 | 7444 | 1298 |
Table 5
Neighbourhood socioeconomic status and long‑term outcomes at ages 25 and 30 years.
| PERCENTILE RANKED INCOME | NUMBER OF UNEMPLOYMENT DAYS | PROBABILITY OF HAVING A COLLEGE DEGREE | |
|---|---|---|---|
| Outcome at 25 years | |||
| Initial NSES | 0.305* [0.039, 0.572] | −0.744* [−1.363, −0.125] | 0.017* [0.002, 0.031] |
| Controls | Yes | Yes | Yes |
| Observations | 12,409 | 12,424 | 8,883 |
| Outcome at 30 years | |||
| Initial NSES | 0.462*** [0.127, 0.797] | −1.332*** [−2.179, −0.485] | 0.026*** [0.009, 0.043] |
| Controls | Yes | Yes | Yes |
| Observations | 8,228 | 8,245 | 6,819 |
[i] Notes: Clustered robust standard errors in parentheses. Confidence intervals are reported in square brackets. The regression models are controlled for parents’ country of origin, parents’ year of arrival, sex and year of graduation. ***p < 0.001, *p < 0.05. NSES = neighbourhood socioeconomic status.
Sensitivity analysis
We conducted several sensitivity analyses to assess the robustness of our results. The estimated associations between each of the four items, used in the construction of the NSES index, and the GPA scores are presented in Table S3. Each of the four items were associated with GPA scores, although the percentages of low educational status and receiving social welfare assistance seemed to be most strongly associated with school grades. We also ran the baseline model for each grading system. The results consistently showed that students benefit from a higher initial NSES, irrespective of the grading system (data not shown in tables or figures).
Heterogenous response to NSES using UQR
We examined the heterogenous impact of NSES across the GPA score distribution and, more precisely, if the associations can be assumed constant over the range of GPA values. Figure 2 illustrates the UQR point estimates and the 95% CIs for the marginal impact of NSES on standardized GPA scores at the 10th to 90th quantiles. The results should be interpreted as , ie, there were marginal changes in GPA scores with respect to a one‑unit change in NSES at a specific quantile.
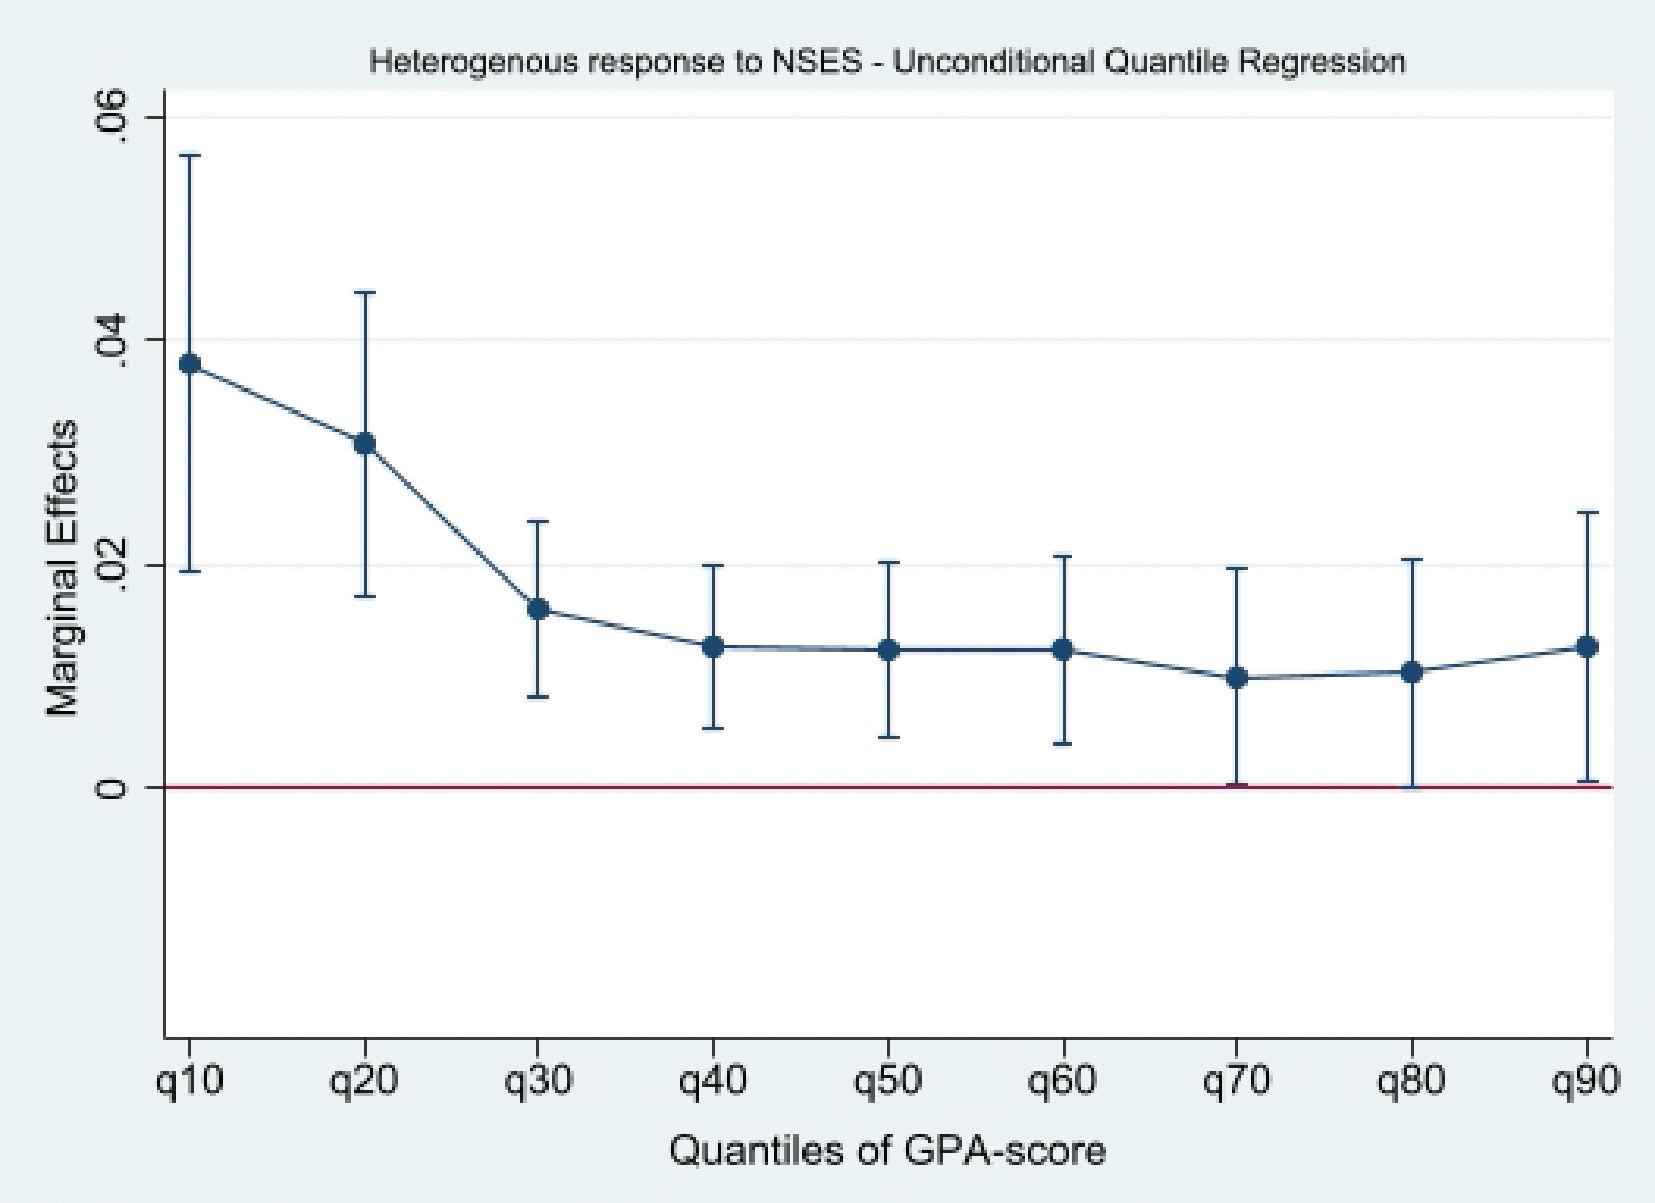
Figure 2
Marginal grade point average scores and neighbourhood socioeconomic status by foreign background.
Notes: The figure shows the marginal changes in GPA‑scores. Quantiles of GPA is shown on the x‑axis, and marginal change in GPA‑scores on the y‑axis. The solid blue line represents relationships and dots point estimates with corresponding 95% CI at each quantile. A refence line at zeros is added to show which coefficients are significantly different from zero. We controlled for parents’ country of origin, as well as parents’ year of arrival and child’s sex and year of graduation as fixed effects.
In Figure 2, at the median GPA, the marginal impact of NSES on GPA scores is 0.016 (95% CI [0.009 0.023]) standard deviation points, in line with the average effect we found using a linear model. We also observed a steep slope at the lower end and decreasing marginal impact until the 30th quantile, and, after the 30th quantile, the association was more or less homogenous. The marginal effect of NSES was particularly high for low‑performing students at the 10th and 20th quantiles, the point estimates were 0.037 and 0.030, respectively, and, at the 90th quantile, the point estimate was 0.019, or approximately half of the effect size at the 10th quantile. The UQR estimates were statistically significant and revealed heterogenous effects across the GPA distribution. The results indicate that low‑performing students benefit more from improved initial NSES.
Discussion
Summary of the findings and relation to previous evidence
The overall aim of this study was to examine the impact of initial neighbourhood socioeconomic characteristics on refugee adolescents’ educational performance upon graduation from compulsory schooling (school grades). This study reaches two main findings. First, we found a positive effect of childhood exposure to higher initial NSES on educational performance. Furthermore, individuals exposed to the lowest NSES, roughly 10%–15% of the study population, had particularly low school grades. Second, we identified heterogeneous effects (using UQR); students with the lowest school grades improved their grades more with an increase in initial NSES upon arrival to Sweden. Our study contributes to filling the gap in existing research on how the initial socioeconomic composition of neighbourhoods influences refugee children’s school grades by using a unique natural experiment.
Potential underlying mechanisms
Neighbourhood socioeconomic characteristics, such as poverty and unemployment, have been shown to influence child development (Jencks & Mayer 1990) and may have a negative impact later in life. The variables used to estimate NSES in our study are related to socioeconomic measures, but they could also be regarded as proxies for the quality of social interaction, networks and information transmitted to the residents in a certain neighbourhood. These mechanisms are likely to influence a number of social and health outcomes amongst immigrants, including refugees, in their host country. As pointed out by Kindler et al. 2015, access to high‑quality interaction in a local geographic area is important for different forms of integration. Hence, the importance of the quality of the initial neighbourhood for future educational performances and labour market outcomes represents valuable information for policy institutions and decision‑makers. Previous research (see Chetty et al. 2014) has shown that neighbourhood characteristics may have an effect on a wide variety of outcomes mediated by educational performance, such as employment, income and health. In our study population, which, in many cases, has been exposed to forced displacement due to ongoing war, political persecution and hunger crisis, it is also likely that socioeconomic deprivation in the initial neighbourhood may limit their socioeconomic opportunities in the host country. Neighbourhood socioeconomic deprivation is also related to a number of health outcomes (see Carlsson et al. 2016; White et al. 2016; Winkleby et al. 2007), which could affect individuals’ socioeconomic opportunities.
Socioeconomically deprived neighbourhoods are characterised by low income and educational levels, high unemployment rates and greater numbers of residents receiving social welfare. However, a number of other factors may also characterise neighbourhood deprivation, such as the physical environment. Although the ambition of the Swedish welfare state is to compensate for socioeconomic differences, at least to a partial extent, deprived neighbourhoods may have less access to high‑quality formative institutions, such as schools and libraries. In addition, because of the existence of a strong welfare state, it could be argued that the socioeconomic opportunities in different types of neighbourhoods are similar, but this is most likely not the case. Affluent neighbourhoods may therefore provide institutions with a higher quality, while deprived neighbourhoods would not only have a lower quality of institutions but also place greater pressure on these institutions, eg, schools, because of the greater needs of families living in deprived neighbourhoods (Pebley & Sastry 2003). In a similar manner, the social disorganisation hypothesis suggests that neighbourhood characteristics, eg, ethnic heterogeneity, high residential turnover rates and low levels of home‑ownership may characterise deprivation (see Jenck & Mayer 1990; Sampson et al. 2002). Neighbourhoods with these characteristics make it more difficult for residents to establish social ties, and children growing up in socially disorganised neighbourhoods may be more likely to participate in deviant behaviour (eg, skipping classes, dropping out from school) and may have less incentive to achieve high school grades in order to pursue further education. Another potential mediating mechanism is through peer effects, where children create their own networks and mimic each other’s behaviour in both positive and negative ways. Akerlof and Kranton (2002) conclude that children interact with each other both inside and outside the classroom, and that ‘students’ aspirations and behaviours at school may be influenced by their peers’ aspirations and behaviour’. These peer effects may be because most students want to conform to the social norms in their peer group. The consequences of such mechanisms may impact the time and effort children give to schoolwork, their school attendance and educational performance (eg, Hermansen 2016; Szulkin & Jonsson 2007). Studies have put forth how contextual factors may impact children’s opportunities. These factors may be attributed to the quality of housing or neighbourhood physical characteristics such as noise levels, littering and vandalism. Perceived neighbourhood characteristics are also important; for example, the perceived safety may be low, and the reputation may be poor in deprived neighbourhoods (see Diez Roux & Mair 2010). Taken together, these mechanisms may represent potentially important clues that may matter for children’s educational performances. If multiple and seemingly different social and physical characteristics of socioeconomic deprivation are linked together in deprived communities, there may be common underlying causes or mediating mechanisms behind low school grades. In addition, gender and age of exposure to initial NSES may have influenced the association between initial NSES and educational performances. Boys and girls might respond somewhat differently to NSES (see Ludwig et al. 2013). This may potentially be due to variations in social expectations eg, cultural and peer interactions. Similarly, the age at which children are first exposed to NSES can shape how they internalise local norms and educational opportunities (see Ben‑Shlomo & Kuh 2002). Early exposure may lead to cumulative effects over time, whereas arriving at a later age could limit the long‑term influence of NSES.
Therefore, individuals sorting into certain neighbourhoods may result in additional disparities in neighbourhood socioeconomic characteristics. The subsequent sorting patterns may concentrate disadvantage within neighbourhoods (Leventhal & Brooks‑Gunn 2000; Sampson et al. 2002), and it is therefore essential to understand how the neighbourhood socioeconomic context shapes disparities in other outcomes, such as educational performance. Factors that may lead to neighbourhood sorting are the individuals’ own preferences, including preferences to live close to people that are similar to themselves (Schelling 1971). Market‑dominated housing systems may, on the other hand, sort people by their income into certain neighbourhoods (Reardon & Bischoff 2011). Increasing income inequalities may also have resulted in the sorting of individuals into certain neighbourhoods (Liang 2021), although it is important to acknowledge that the mechanism behind socioeconomic segregation is complex. In addition, individual choices based on type of household, lifestyle and culture can influence irrespective of income and the welfare state, which includes financial transfers to those with lower incomes that can buffer market processes (Marcińczak et al. 2015).
Limitations and strengths
One limitation of our study was that our analyses relied upon nationwide administrative geographic units that do not necessarily represent how residents themselves define their neighbourhoods. However, qualitative measures of neighbourhoods do not exist at a nationwide level. Furthermore, our NSES index provides only a relative measure of deprivation between neighbourhoods and not the absolute levels of economic, social or cultural aspects within a neighbourhood. In addition, although the four variables used in our NSES index were carefully selected, other types of input variables may have had a different impact on the NSES index and thereby influenced the results. However, our NSES index was constructed from established socioeconomic variables and is therefore useful for comparisons across neighbourhoods and over time, where the use of PCA summarises a larger set of variables into a smaller and manageable number. Another limitation is the exclusion of 9,204 children who emigrated before ninth grade, which may introduce age and selective emigration biases, potentially limiting the representativity and generalisability of our findings.
Separately, one key strength is the adoption of a natural experiment where the newly arrived refugees to Sweden offered a unique solution to the fundamental problem of bias due to neighbourhood sorting. The natural experiment improves our ability to provide a causal interpretation of our results. The random variation in NSES amongst newly arrived refugees was a result of the Swedish Dispersal Policy during the period 1985–1991. This policy has been used as an approach to improve causal inferences by other research groups (see eg, Åslund et al. 2011). Other strengths are that we also examined the associations between each of the four items, used in the construction of the NSES index, and school grades as well as the associations between the NSES index and future labour market outcomes (college degree, income unemployed days) at both 25 and 30 years of age. Our results could therefore be regarded as robust and consistent based on the alternative model specifications and econometric estimation strategies used in this study.
To sum up, this study shows that refugee adolescents’ educational performances are shaped by the NSES in the neighbourhood upon the arrival of their families. Considering that refugees tend to cluster in deprived and immigrant‑dense neighbourhoods, our results motivate place‑focused approaches in educational institutions as well as neighbourhoods to improve integration and future socioeconomic opportunities.
Ethical Approval
This study was conducted in accordance with Swedish ethical guidelines, regulations and legislation. Ethical approval for the use of the secondary, registered data in this study was permitted by the Swedish Ethical Authorities in Lund in 2012. Data protection was guaranteed in a secure data environment to ensure confidentiality and personal integrity of all individuals.
Data Availability Statement
The individual‑level data used in this study are protected under Swedish laws and other confidentiality regulations. As a result, these data cannot be shared.
Competing Interests
The authors have no competing interests to declare.
Notes
Additional Files
The additional files for this article can be found as follows:
Supplementary Table 1
Top five source countries and regions, frequency and percentage of refugees. DOI: https://doi.org/10.33134/njmr.878.s1
Supplementary Table 3
Estimates of the effects on school grades from single items included in the NSES index. DOI: https://doi.org/10.33134/njmr.878.s3
Supplementary Figure 1
Spatial distribution of immigrants (1985–1991) across SAMS neighbourhoods in the municipality of Stockholm. DOI: https://doi.org/10.33134/njmr.878.s4
Supplementary Figure 2
Study population and grading systems. DOI: https://doi.org/10.33134/njmr.878.s5