
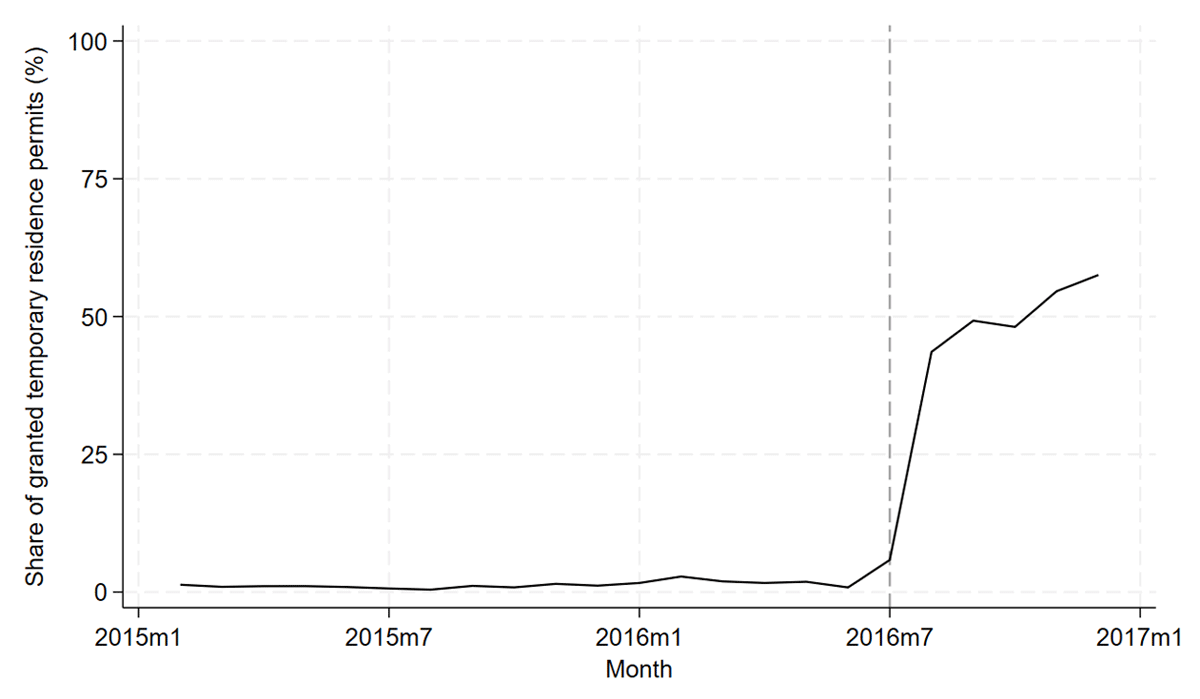
Figure 1
Share of individuals granted temporary residence permits in 2015 and 2016.
Notes: Data from the Swedish Migration Agency (2023).
Table 1
Characteristics of individuals in the treatment and control group.
| MEAN | N | ||
|---|---|---|---|
| Main variables: | |||
| Temporary | 0.51 | 847 | |
| WHO-5 | 48.0 | 847 | |
| Stress about own status | 0.44 | 847 | |
| Stress about family status | 0.42 | 847 | |
| Control variables: | |||
| Age | 35.9 | 847 | |
| Male | 0.54 | 847 | |
| Married | 0.73 | 847 | |
| University | 0.36 | 847 | |
| Children | 0.79 | 847 | |
| (1) | (2) | (3) | |
| CONTROL | TREATMENT | DIFFERENCE | |
| Control variables: | |||
| Age | 38.02 | 33.12 | 4.90*** |
| Sex | 0.53 | 0.55 | –0.02 |
| Married | 0.93 | 0.45 | 0.48*** |
| University | 0.31 | 0.37 | –0.05 |
| Children | 0.99 | 0.55 | 0.44*** |
| Observations | 450 | 397 |
[i] Notes: The table displays central characteristics of our sample. Data from Preserving (2020). ***p < 0.001.
Table 2
Assessing the influence of temporary residence on stress and well-being.
| FULL SAMPLE | CALIBRATED SAMPLE | ONLY WITH CHILDREN | ||||
|---|---|---|---|---|---|---|
| (1) | (2) | (3) | (4) | (5) | (6) | |
| WHO-5 INDEX | ||||||
| Temp.Res | –10.885*** | –6.467*** | –11.670*** | –6.622*** | –7.644*** | –6.363*** |
| (1.908) | (2.318) | (2.009) | (2.407) | (2.410) | (2.391) | |
| N | 767 | 767 | 757 | 757 | 568 | 576 |
| INDIVIDUAL STATUS | ||||||
| Temp.Res | 0.767*** | 0.700*** | 0.780*** | 0.710*** | 0.716*** | 0.721*** |
| (0.023) | (0.028) | (0.023) | (0.032) | (0.032) | (0.031) | |
| N | 772 | 772 | 772 | 772 | 575 | 575 |
| FAMILY STATUS | ||||||
| Temp.Res | 0.439*** | 0.506*** | 0.442*** | 0.521*** | 0.507*** | 0.519*** |
| (0.033) | (0.039) | (0.035) | (0.037) | (0.040) | (0.038) | |
| N | 698 | 698 | 698 | 698 | 553 | 553 |
| Controls | No | Yes | No | Yes | No | Yes |
[i] Notes: Standard errors in parentheses. We show the full regression tables in the Appendix. *p < 0.05, **p < 0.01 and ***p < 0.001.
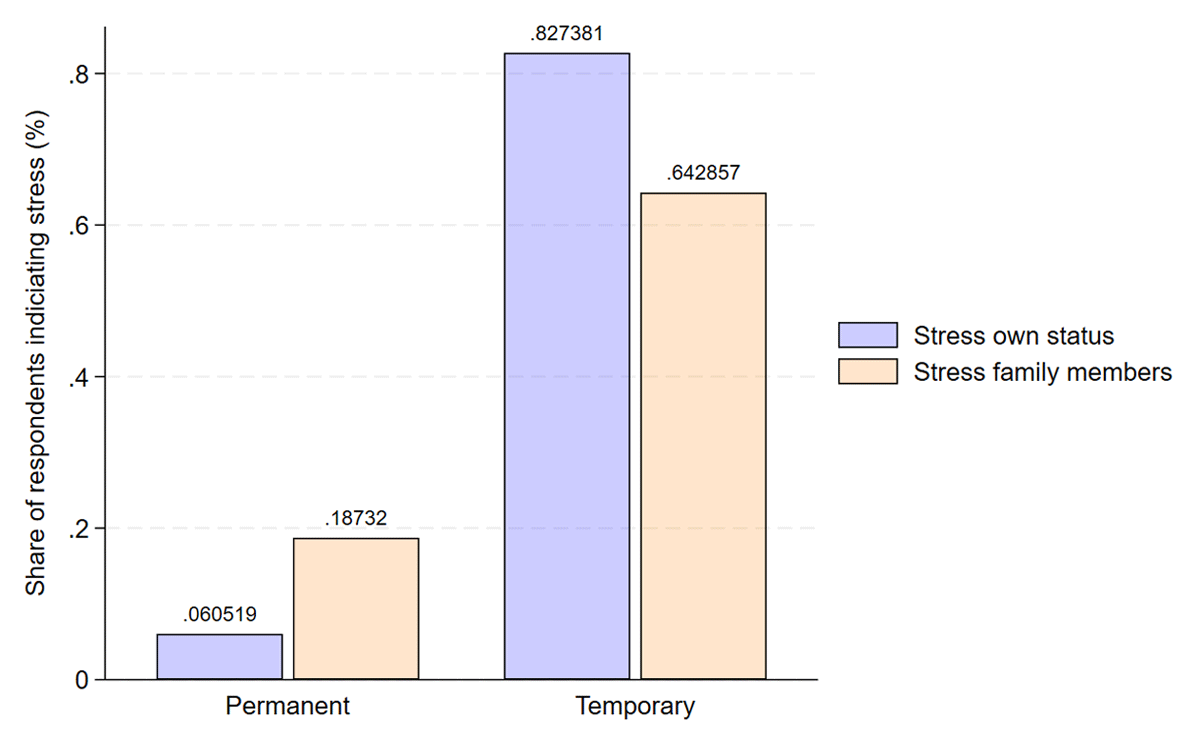
Figure 2
Share of individuals experiencing stress regarding one’s own status (blue) and the status of family members (orange) among individuals granted permanent (left) and temporary (right) permits.
Notes: Data from Preserving (2020).
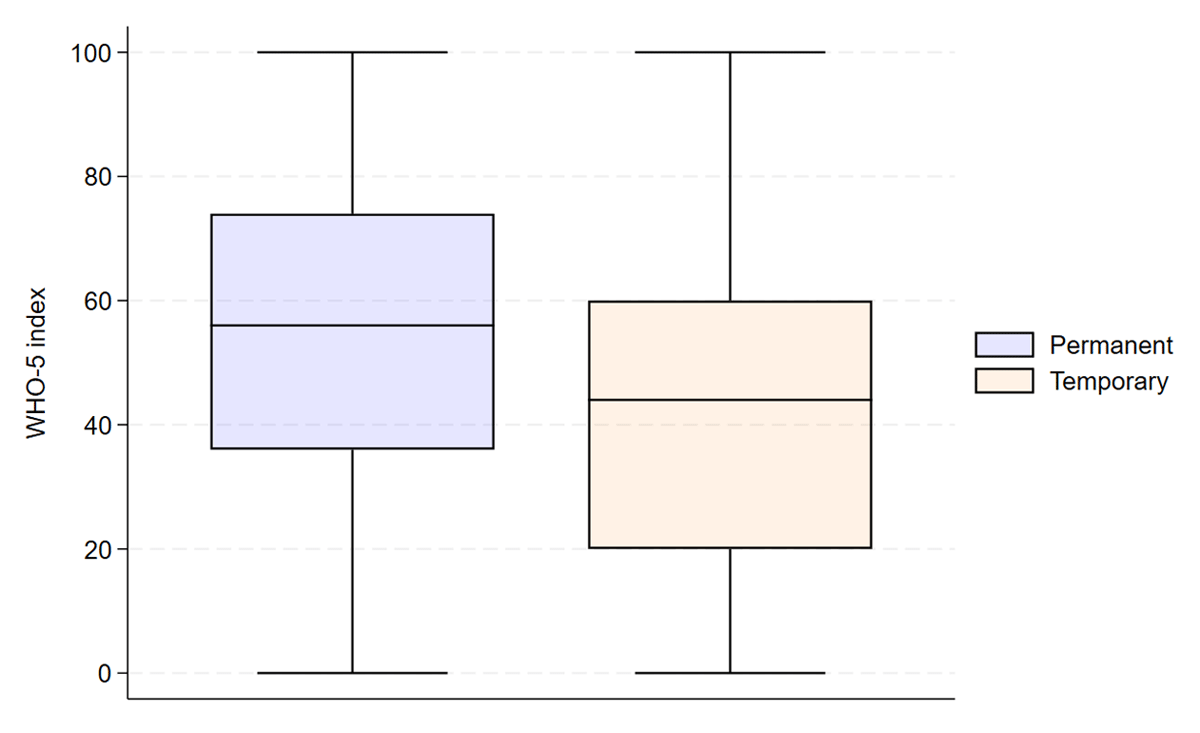
Figure 3
Distribution of the WHO-5 index between groups granted permanent (left) and temporary (right) permits.
Notes: Data from Preserving (2020).
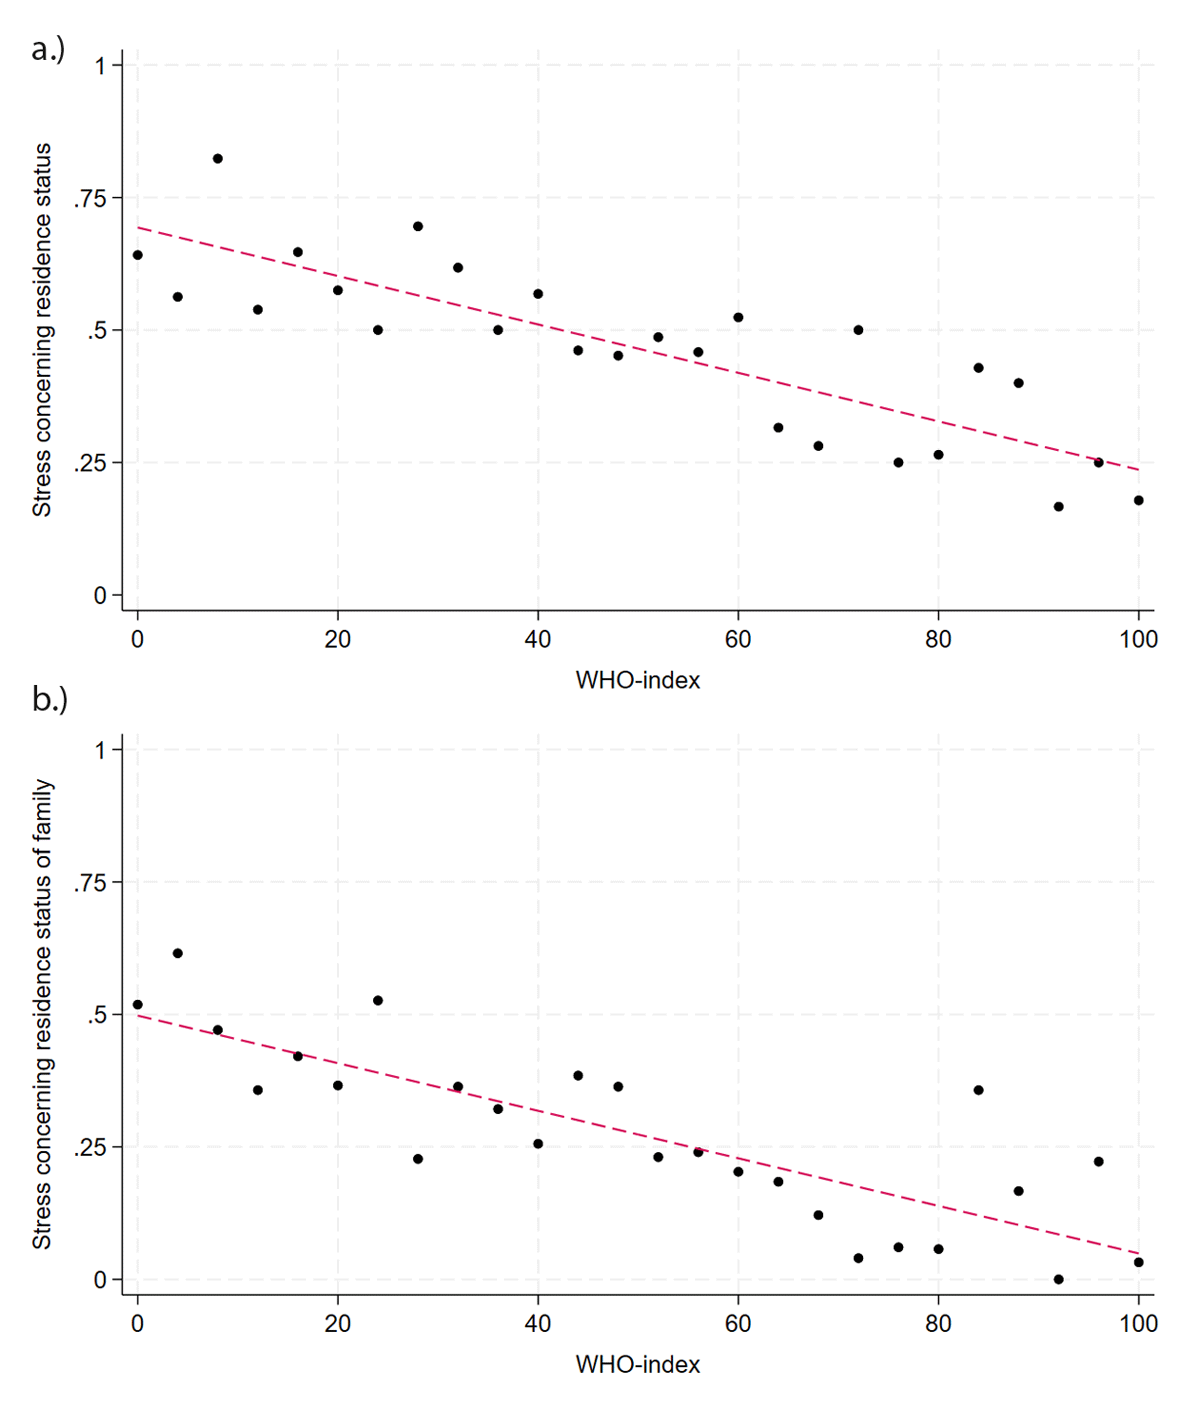
Figure 4
Correlations between stress over one’s own status (a) and the status of family members (b) and well-being.
Notes: Data from Preserving (2020).
Table 3
Difference in stress levels across areas connected to settlement.
| STRESS OVER: | |||
|---|---|---|---|
| PERMANENT | TEMPORARY | DIFFERENCE | |
| Housing situation | 0.51 | 0.51 | –0.00 |
| Work situation | 0.48 | 0.55 | –0.06 |
| Study situation | 0.48 | 0.55 | –0.06 |
| Family situation | 0.18 | 0.35 | –0.17*** |
| Observations | 723 |
[i] Notes: *p < 0.05, **p < 0.01 and ***p < 0.001.
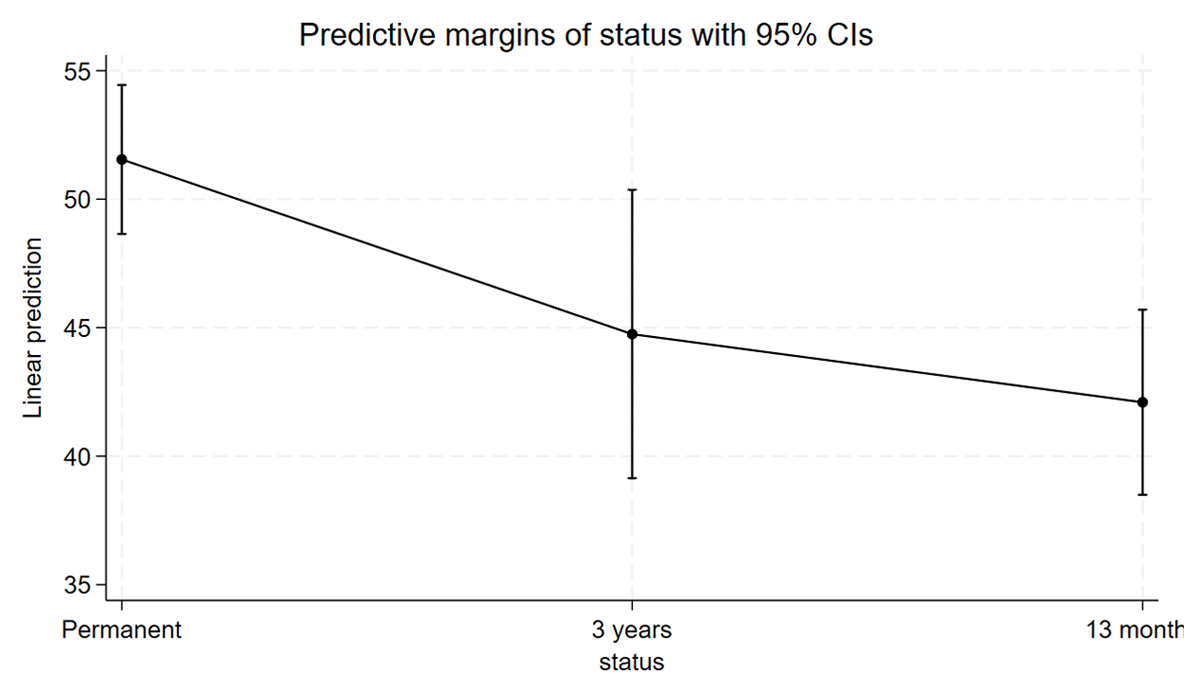
Figure 5
Marginal effects in the WHO-5 index across groups granted permanent statuses, statuses for 3 years, and statuses for 13 months.
Notes: Data from Preserving (2020).