
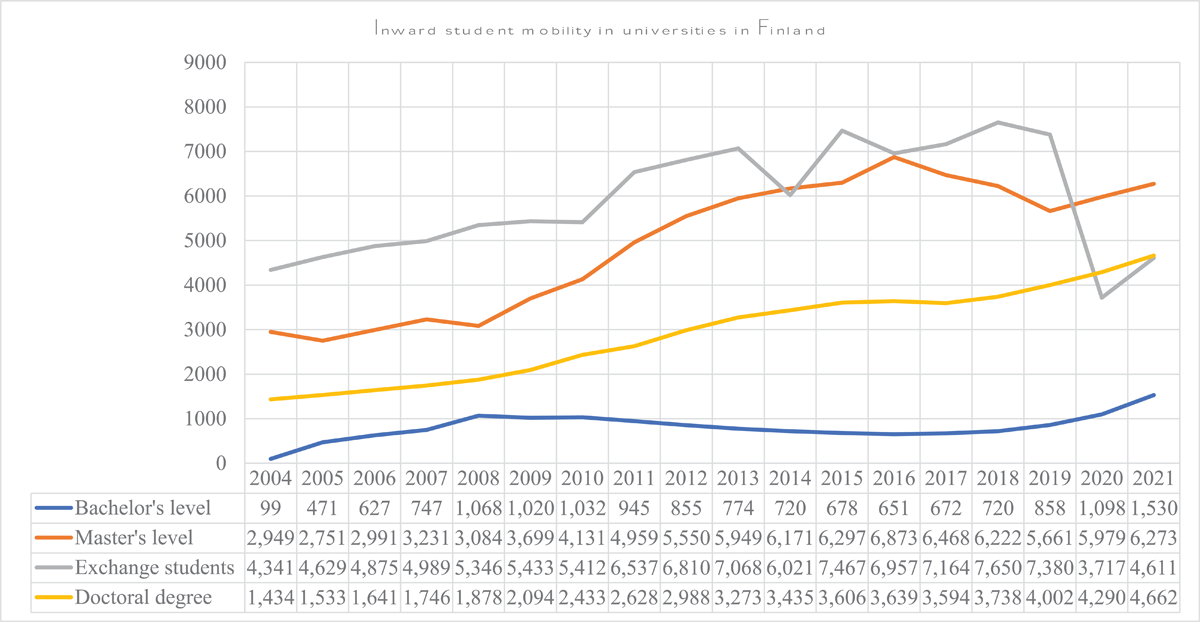
Figure 1
Inward student mobility in universities in Finland (Vipunen, 2023a, 2023b).
Table 1
International students in Finland by studying status.
| CHARACTERISTICS | STUDENTS IN FINLAND (Vipunen 2023a; Vipunen 2023b) | RESPONDENTS | |||
|---|---|---|---|---|---|
| FREQUENCY | PERCENTAGE | FREQUENCY | PERCENTAGE | ||
| Status | Exchange student | 7,380 | 41.2% | 61 | 31.8% |
| Bachelor’s degree student | 858 | 4.8% | 15 | 7.8% | |
| Master’s degree student | 5,661 | 31.6% | 99 | 51.6% | |
| Doctoral researcher | 4,002 | 22.4% | 17 | 8.9% | |
| Total | 17,901 | 100% | 192 | 100% | |
Table 2
Responses to study-related statements (1 = strongly disagree; 5 = strongly agree).
| NO. | STATEMENT | 1 | 2 | 3 | 4 | 5 | M | S.D. |
|---|---|---|---|---|---|---|---|---|
| 1 | I have been able to continue my studies as planned | 12% | 24% | 14.6% | 40.1% | 9.4% | 3.11 | 1.221 |
| 2 | My graduation will be delayed due to the current situation | 15.1% | 30.7% | 29.2% | 17.2% | 7.8% | 2.72 | 1.150 |
| 3 | Online teaching has increased my workload | 6.8% | 22.9% | 31.8% | 24% | 14.6% | 3.17 | 1.141 |
| 4 | Communicating online with my teachers is easy | 3.6% | 21.9% | 22.4% | 43.2% | 8.9% | 3.32 | 1.027 |
| 5 | I have been more productive | 21.4% | 38% | 25% | 10.9% | 4.7% | 2.40 | 1.083 |
| 6 | I have received adequate information on how the situation affects my studies | 4.2% | 18.8% | 25% | 42.2% | 9.9% | 3.35 | 1.027 |
| 7 | I have been worried about my time management | 2.6% | 13% | 17.2% | 40.6% | 26.6% | 3.76 | 1.067 |
| 8 | Now I am more stressed about my studies | 6.8% | 21.4% | 22.4% | 26.6% | 22.9% | 3.37 | 1.239 |
| 9 | I prefer online teaching to face-to-face teaching | 42.2% | 28.1% | 20.3% | 5.2% | 4.2% | 2.01 | 1.102 |
| 10 | I have been feeling stressed about my study progress | 5.2% | 15.1% | 22.4% | 31.3% | 26% | 3.58 | 1.178 |
| 11 | I expect to gain as many credits as planned | 5.2% | 13.5% | 19.8% | 41.7% | 19.8% | 3.57 | 1.109 |
| 12 | I had to drop out of courses | 31.8% | 25.5% | 12% | 21.4% | 9.4% | 2.51 | 1.373 |
Table 3
Responses to financial-related statements (1 = strongly disagree; 5 = strongly agree).
| NO. | STATEMENT | 1 | 2 | 3 | 4 | 5 | M | S.D. |
|---|---|---|---|---|---|---|---|---|
| 1 | My financial situation got worse* | 9.9% | 25.7% | 20.9% | 23% | 20.4% | 3.18 | 1.295 |
| 2 | My parents and/or relatives have helped me financially* | 25.1% | 22.5% | 16.2% | 20.9% | 15.2% | 2.79 | 1.418 |
| 3 | My financial situation improved | 36.6% | 32.5% | 20.4% | 8.9% | 1.6% | 2.06 | 1.034 |
| 4 | My spouse/partner/ boyfriend/girlfriend has helped me financially | 45% | 27.2% | 18.3% | 6.8% | 2.6% | 1.95 | 1.070 |
| 5 | I have been worried about my financial situation* | 6.8% | 15.7% | 15.7% | 31.9% | 29.8% | 3.62 | 1.250 |
[i] *Statement with p < 0.05 between the groups of students.
Table 4
Responses to social life statements (1 = strongly disagree; 5 = strongly agree).
| NO. | STATEMENT | 1 | 2 | 3 | 4 | 5 | M | S.D. |
|---|---|---|---|---|---|---|---|---|
| 1 | I have been in contact with my classmates | 6.8% | 15.6% | 18.8% | 49% | 9.9% | 3.40 | 1.078 |
| 2 | I have participated in events organised by the student organisations | 37.5% | 44.3% | 10.9% | 6.8% | 0.5% | 1.89 | 0.891 |
| 3 | I have not met people face-to-face | 6.3% | 36.5% | 12% | 20.8% | 24.5% | 3.21 | 1.330 |
| 4 | I have been mostly by myself | 6.8% | 18.8% | 13% | 33.3% | 28.1% | 3.57 | 1.264 |
| 5 | I have felt lonely | 9.4% | 18.2% | 22.4% | 28.1% | 21.9% | 3.35 | 1.265 |
| 6 | My social life has not been as active as before | 3.1% | 10.4% | 8.9% | 47.4% | 30.2% | 3.91 | 1.042 |
| 7 | I have been particularly active in keeping in contact with my friends in my home country* | 3.6% | 15.6% | 21.4% | 45.3% | 14.1% | 3.51 | 1.033 |
| 8 | I have been particularly active in keeping in contact with my family in my home country | 2.1% | 8.9% | 17.2% | 44.3% | 27.6% | 3.86 | 0.988 |
| 9 | Staying at home has been difficult for me | 7.8% | 17.2% | 22.4% | 33.9% | 18.8% | 3.39 | 1.197 |
| 10 | I have not continued my life as it was | 4.7% | 13% | 18.8% | 31.8% | 31.8% | 3.73 | 1.175 |
| 11 | I have been having difficulty concentrating | 3.1% | 12.5% | 7.3% | 39.1% | 38% | 3.96 | 1.113 |
| 12 | It has been more difficult for me to plan my daily schedule | 4.7% | 21.9% | 18.8% | 33.3% | 21.4% | 3.45 | 1.183 |
| 13 | I have been worried I will get sick | 12% | 20.8% | 17.2% | 31.8% | 18.2% | 3.23 | 1.299 |
| 14 | I have been worried about my friends’ and family’s health | 1.6% | 7.8% | 12.5% | 45.3% | 32.8% | 4.00 | 0.954 |
| 15 | I have been worried about the COVID-19 situation in Finland | 9.9% | 15.6% | 13.5% | 45.8% | 15.1% | 3.41 | 1.207 |
| 16 | I have been worried about the COVID-19 situation in my home country | 2.6% | 7.8% | 7.8% | 41.1% | 40.6% | 4.09 | 1.014 |
[i] *Statement with p < 0.05 between the groups of students.
Appendix I
International students in universities in Finland by continent and respondents.
| CHARACTERISTICS | DEGREE STUDENTS (Finnish National Agency for Education, 2023a) | EXCHANGE STUDENTS (Vipunen, 2023b) | TOTAL | RESPONDENTS | |||||
|---|---|---|---|---|---|---|---|---|---|
| FREQUENCY | PERCENTAGE | FREQUENCY | PERCENTAGE | FREQUENCY | PERCENTAGE | FREQUENCY | PERCENTAGE | ||
| Continent | Europe total | 4,023 | 35.3% | 4,932 | 77% | 8,955 | 50.3% | 105 | 54.7% |
| EU/EEA | 3,099 | 27.2% | N/A | N/A | N/A | N/A | 95 | 49.5% | |
| Europe but non-EU/EEA | 921 | 8.1% | N/A | N/A | N/A | N/A | 10 | 5.2% | |
| America | 825 | 7.2% | 480 | 7.5% | 1,305 | 7.3% | 20 | 10.4% | |
| Africa | 897 | 7.9% | 57 | 0.8% | 954 | 5.4% | 5 | 2.6% | |
| Asia | 5,556 | 48.8% | 828 | 13% | 6,384 | 35.9% | 53 | 27.6% | |
| Oceania | 54 | 0.5% | 102 | 1.6% | 156 | 0.9% | 2 | 1% | |
| Unknown/Do not want to share | 30 | 0.3% | 4 | 0.1% | 34 | 0.2% | 7 | 3.6% | |
| Total | 11,382 | 100% | 6,403 | 100% | 17,788 | 100% | 192 | 100% | |
Appendix II
International students in universities in Finland by gender and age group, and respondents.
| CHARACTERISTICS | DEGREE STUDENTS IN FINLAND 2020 (Vipunen, 2023a) | RESPONDENTS | |||
|---|---|---|---|---|---|
| FREQUENCY | PERCENTAGE | FREQUENCY | PERCENTAGE | ||
| Gender | Female | 6165 | 47% | 133 | 69.3% |
| Male | 7050 | 53% | 53 | 27.6% | |
| Other | N/A | N/A | 2 | 1% | |
| I don’t want to tell | N/A | N/A | 4 | 2.1% | |
| Age group | 18–25 | 3333 | 23.7% | 97 | 50.5% |
| 26–35 | 6882 | 48.9% | 79 | 41.1% | |
| 36–45 | 2010 | 14.3% | 15 | 7.8% | |
| 46–60 | 1701 | 12.1% | 1 | 0.5% | |
| 60– | 145 | 1% | 0 | 0% | |
| Total | 14071 | 100% | 192 | 100% | |
Appendix III
Current working situation and summer work statements.
| STATEMENT | n | (%) | |
|---|---|---|---|
| Question: Has the COVID-19 situation affected your work? | No, I have continued as usual | 28 | 35.4% |
| Yes, now I have less hours than before | 14 | 17.7% | |
| Yes, now I have more hours than before | 1 | 1.3% | |
| Yes, I have been laid off temporarily | 12 | 15.2% | |
| Yes, now I am unemployed | 24 | 30.4% | |
| Total | 79 | 100% | |
| Question: Has the COVID-19 situation affected your plans to work during the summer? | No, I will not work during the summer | 34 | 21.9% |
| No, I will work during the summer as planned earlier | 22 | 14.2% | |
| Yes, I do not have work for summer anymore | 43 | 27.7% | |
| Yes, I have fewer working hours for the summer | 11 | 7.1% | |
| Yes, I have to apply for a new job for the summer | 19 | 12.3% | |
| Other, what? | 26 | 16.8% | |
| Total | 155 | 100% | |