
Introduction
Ethnic and racial inequality are pervasive features of modern societies. Decades of research have documented that anti-immigrant attitudes (Helbling & Traunmüller 2020; Strabac, Aalberg & Valenta 2013; Ward 2019) and discrimination (Quillian et al. 2017; Quillian, Lee & Oliver 2020) play important roles in shaping these inequalities. The majority population feels threatened by immigration and perceives immigrants in negative ways (Outten et al. 2012; Stephan et al. 2005; Willer, Feinberg & Wetts 2016). A key insight underpinning this literature is that the attitudes the majority population holds toward immigrants have consequences for behavior and intercultural relations (Walsh & Tartakovsky 2021). Thus, there is an urgent need to understand the role stereotypes about immigrants play as countries become more diverse and social cohesion is threatened.
Most research on attitudes toward immigrants focuses on only one or a few immigrant groups, making it difficult to discern patterns in stereotypes and discrimination across groups (Bye et al. 2014). Yet, there is reason to believe that different immigrant groups elicit different emotional and threat reactions (Bye et al. 2014; Grigoryev, Fiske & Batkhina 2019; Walsh & Tartakovsky 2021). To advance our knowledge about which groups are likely to share experiences of discrimination and prejudice, we must explore the content of the stereotypes connected to different immigrant groups. Building on the Stereotype Content Model (SCM) (Cuddy, Fiske & Glick 2007, 2008; Fiske et al. 2002), this study explores how the majority population in Norway stereotypes five of the largest immigrant groups in Norway. The SCM model predicts that the content of a stereotype attached to a specific immigrant group, depends on the degree of threat that is associated with the particular group in question.
We contribute to the literature in two ways. First, building on population representative survey data, we test the SCM in an egalitarian welfare state characterized by low unemployment and income inequality. Studies suggest that group stereotypes vary across countries according to differences in income inequality and type of welfare regime (Durante et al. 2013; Durante, Tablante & Fiske 2017; Schofield, Suomi & Butterworth 2022). Second, although the literature on the SCM has come a long way in describing the complex nature of stereotypes and prejudice, few studies have explored how individual characteristics of the perceiver influence stereotype content. However, recent studies illustrate the importance of examining the relation between individuals’ personal value preferences and perceived group threat (Davidov et al. 2020; Walsh & Tartakovsky 2021). This study examines whether perceivers’ ‘motivation to control prejudice’ (MCP) influences their evaluation of different immigrant groups. MCP refers to a mechanism where individuals tend to avoid acting on, or expressing ‘biases against stigmatized minorities, even if they, knowingly or unknowingly, harbor such bias’ (Blinder, Ford & Ivarsflaten 2013). The present study extends the SCM by examining how respondents’ MCP moderates stereotype judgement. By combining the two literatures, the SCM and the MCP, this study provides a valuable ground for further research into stereotyping and discrimination.
Social Perception and Immigrant Stereotypes
The literature deploying the SCM suggests that immigrant groups do not face uniform antipathy, which characterizes traditional prejudice (Allport 1959). Stereotypes held toward immigrants are not one-dimensional (good/bad), but rather defined along axes related to the social structural characteristics of the particular group (Cuddy, Fiske & Glick 2007, 2008; Fiske et al. 2002). The SCM’s premise is that the content of stereotypes relates to two key questions: Is the intention of the outgroup good or bad (warmth) toward me and my group? And, are the outgroup members able or unable (competence) to enact their intentions? Thus, warmth (e.g., how friendly and sincere we perceive the group to be) and competence (e.g., how capable and skillful we perceive the group to be) are basic dimensions of social judgment and intergroup behavior, because they indicate how helpful or harmful a group may be (Cuddy, Fiske & Glick 2007; Cuddy et al. 2009; Fiske et al. 2002; Walsh & Tartakovsky 2021). According to the SCM, the social structure predicts how we define the intentions (warmth) and capabilities (competence) of different groups (Fiske et al. 2002, 2007). Groups with high status and power are generally perceived as more competent, while more competitive groups are perceived as lower in warmth. Outgroups are seen as relatively warm and friendly to the extent that they do not compete with the majority population. Thus, while status predicts perceived competence, competition predicts judgments of a group as warm or cold. Consistent with the SCM framework, is that many groups will receive ambivalent stereotypes (e.g., high warmth/low competence or high competence/low warmth) (Cuddy et al. 2007). Depending on the mix of stereotype dimensions, reactions to specific immigrant groups should be systematic, not arbitrary, according to the SCM (Lee & Fiske 2006). The SCM framework has been demonstrated to provide valid predictions on attitudes in non-representative samples (Fiske, Cuddy & Glick 2007) as well as large representative samples (Walsh & Tartakovsky 2021).
Cultural distance (values, religion, and language) has substantial consequences for intercultural relations (Grigoryev, Fiske & Batkhina 2019), and influences majority stereotypes of immigrant groups (Brunner & Kuhn 2018; Craig, Rucker & Richeson 2018; Helbling & Traunmüller 2020). Research within the framework of SCM describes an ethnic hierarchy between different immigrant groups, which reflects similarity and group status (Bye et al. 2014). Immigrant groups that are considered to be culturally similar to the majority population (e.g., with regard to values, language, and religion), such as British immigrants in the United States (Lee & Fiske 2006) and Swedish immigrants in Norway (Bye et al. 2014), are perceived as the ingroup, namely warm and competent. The majority population is more positive about integrating immigrants who are perceived as well-intentioned and competent (Phelps et al. 2013). Stigmatized groups and groups considered as culturally distant, such as Somali immigrants in Norway, are often seen as cold and incompetent (Bye et al. 2014). Other high-status immigrants, such as Asian immigrants in the United States, are stereotyped as cold, but competent (Lee & Fiske 2006).
Although warmth and competence are considered to define the content of stereotypes in all cultures (Cuddy et al. 2009), there are differences between countries when it comes to how particular groups are perceived along these dimensions (Schofield, Suomi & Butterworth 2022). This variation is explained by structural features of society, such as varying levels of income inequality and different types of welfare state regimes. Studies have, for example, found that, in societies with higher levels of income inequality, ambivalent stereotypes are more prevalent (Durante et al. 2013) and the poor are viewed as more incompetent (Durante, Tablante & Fiske 2017). In countries with low inequality and unemployment and high levels of trust, researchers have documented that people held warmer cultural stereotypes of welfare recipients and perceive them as more deserving of support (Schofield, Suomi & Butterworth 2022). A key explanation for this variation is that higher inequality and competition between groups require more compensation. Ambivalent stereotypes may legitimize the status quo and help to tolerate inequality, because when one’s group is low on one dimension, it is rewarded on the other (I’m poor, but goodhearted) (Durante et al. 2013).
The current study builds on the SCM model and examines how five of the largest immigrant groups in Norway are rated in warmth, competence, status, and competition, expecting that perceived status will positively correlate with competence and competition negatively with warmth. Moreover, based on previous research suggesting that societies with higher inequality are associated with a weaker correlation between warmth and competence, we expect that immigrant stereotypes in Norway will be less ambivalent, because equal societies require less competition.
However, there is little and unsystematic evidence about whether the content of stereotypes can vary between individuals, situations, contexts, and geographical regions within a culture (Stanciu et al. 2017). Recent studies suggest that personality traits and values, such as openness to change (Walsh & Tartakovsky 2021) and universalism (Davidov et al. 2020), predict higher levels of perceived benefit and appraisal of immigrant groups. Thus, it is important to examine the relation between perceivers’ characteristics and the evaluation of different immigrant groups. In this study, we pay attention to individual differences in their MCP.
Motivation to Control Prejudice
MCP is a psychological mechanism that may impact how immigrant groups are stereotyped (Blinder, Ford & Ivarsflaten 2013). The SCM seeks to filter out such individual attributes by asking respondents to rate how other people perceive these groups. However, expressing negative feelings and prejudice toward immigrant groups may still be susceptible to both norms to control prejudice (Dunton & Fazio 1997; Forscher et al. 2015) and an individual’s internal implicit (non-conscious) MCP (Glaser & Knowles 2008; Plant & Devine 1998). According to Blinder, Ford and Ivarsflaten (2013), the expression of prejudice is a process that, on the individual level, involves both automatic and controlled attitude components. When responding to questions about attitudes toward outgroups, the individual may experience an internal conflict between negative attitudes toward outgroups and efforts to avoid such negative attitudes (Blinder, Ford & Ivarsflaten 2013; Steen-Johnsen & Winsvold 2019). In this setting, MCP is the inclination of individuals to ‘avoid acting on biases against stigmatized minorities, even if they, knowingly or unknowingly, harbor such bias’ (Blinder, Ford & Ivarsflaten 2013: 842). Research has suggested that the MCP norm functions independent of other social desirability mechanisms (Ivarsflaten, Blinder & Ford 2010). These efforts have, however, not looked specifically at the function of MCP when applied in the SCM setting.
In this article, we argue that even when asked about other people’s opinion of immigrant groups, the individual’s MCP will influence their perception of stereotypes. Ridgeway and Correll (2006) differentiate between first, second, and third order beliefs, where the MCP is an example of a first order belief (an individual attitude), while the SCM corresponds to a third order belief (an assumption about the beliefs or perspective of a ‘generalized other’). Second order beliefs refer to assumptions about the beliefs or perspectives of a specific other. They argue that in some cases, people tend to endorse third order beliefs as first order beliefs, that is, that perceptions of attitudes held by others affect personally held attitudes (Ridgeway & Correll 2006). Thus, we might expect MCP to be positively correlated with SCM, meaning that those who are highly motivated to control their prejudices are more likely to stereotype immigrant groups positively. They have an implicit bias to give even culturally distant groups the ‘benefit of the doubt.’ In contrast, those who lack the motivation to control their prejudices, are more likely to stereotype immigrant groups negatively.
What to Expect? Immigrant Stereotypes in Norway
This study sets out to examine stereotype content in Norway, a country characterized by comparatively low levels of economic inequality, limited unemployment, and a strong welfare state (Taylor-Gooby et al. 2019), as well as high levels of social and institutional trust (Torcal 2016). In this article, we focus on the majority population’s stereotype perceptions of five of the largest immigrant groups in Norway: Swedes, Poles, Pakistanis, Syrians, and Somalis. Pakistanis have a long history in Norway, coming as labor migrants in the 1970 and later followed by family migrants (Brochmann et al. 2012). After the EU extension in 2004, European labor migrants from Eastern Europe (e.g., Poland and Lithuania) dominated arrivals. Labor and family migrants coming from Poland and Sweden constitute two of the major European immigration groups in Norway. Somalis have mainly arrived as refugees over the past 20 years, while most Syrians have arrived as refugees after 2015 (Olsen & Bye 2022).
Stereotype perceptions of these groups are likely to be affected both by economic and cultural factors (Citrin & Sides 2008). Concerning labor market participation, both Swedes and Poles are mainly labor immigrants, and their employment resembles the majority population. Pakistanis have lower employment than the majority population, while employment rates are even lower among Somalis and Syrians (about one in three are registered as employed) (Olsen & Bye 2022). While Syrians have a short history in Norway, Somalis have over the years been associated with a range of integration challenges, such as unemployment and reliance on welfare benefits (Horst et al. 2013). Concerning cultural factors, studies of public opinion in Norway show that cultural distance, such as wearing non-Christian religious symbols and not adopting Norwegian values, is associated with more negative attitudes toward immigrants (Strabac et al. 2016; Zahl-Thanem & Haugen 2019). This points to attitudes being associated with ethnic hierarchies, in which immigrant groups are ranked by cultural proximity/distance. A research report (in Norwegian) corroborates this, by finding that ethnic Norwegians prefer groups such as Americans and Poles, over Somalis, as neighbors, friends, and family members (Hoffmann & Moe 2017). Moreover, in Norway, ‘visible’ minorities and individuals from Muslim countries tend to report the highest levels of discrimination (Midtbøen & Kitterød 2019).
Thus, the five groups studied vary regarding both status indicators and cultural factors. Concerning stereotype perceptions, employment status is expected to impact perceived competence, while cultural distance is expected to impact perceptions of competition and intent, and thereby perceptions of warmth. Based on the literature review and the description of the Norwegian context, we propose three hypotheses.
First, we expect that perceived group (dis)similarity influences the majority populations’ perceptions of competition and perceived harmful intent. Immigrant groups that are perceived as culturally similar and associated with high employment, such as Swedes, will receive more positive stereotypes (warm/competent vs. cold/incompetent) than groups that are perceived as less culturally similar and associated with unemployment, such as Somalis. Thus, our first hypothesis states:
H1: Immigrant groups perceived as similar to native Norwegians will be stereotyped more positively (warm and competent) than immigrant groups perceived as less similar.
Second, ambivalent stereotypes are less prevalent in more equal societies. As suggested by the literature, ambivalent stereotypes may help to tolerate inequality, because when one’s group is low on one dimension, it is rewarded on the other (Durante et al. 2013). In the Norwegian context, with limited inequality, we therefore expect that:
H2: Ambivalent stereotypes will not be highly present in Norway.
Third, we expect stereotypes to be moderated by individuals’ MCP:
H3: Individuals with strong MCP are more likely to stereotype all immigrant groups as warm and competent.
Data and Methods
This study is based on a web survey among a representative sample of the Norwegian population, targeting approximately 3,000 respondents and carried out by Kantar Norway. The sample was drawn from Kantar’s web base, which is probability based and consists of approximately 50,000 Internet users. We are interested in how the majority population perceives different immigrant groups and therefore excluded respondents with an immigrant background (born abroad or both parents born abroad) as well as respondents with missing values on any of the key variables (see description below), reaching a target sample of 2,799 native Norwegians aged 15 and older.
Ethical considerations in the design and execution of the survey included questions of informed consent, anonymity, storage of data, and avoiding negative consequences for the selected immigrant groups. First, we rely on the respondents’ pre-approval to receive this type of survey. This is regulated in a separate agreement between Kantar and the respondents, which secures informed consent from the individual respondents, as well as the possibility to withdraw information after completing the survey. The data file was anonymized by Kantar and later made available to other researchers through the Norwegian Agency for Shared Services in Education and Research (SIKT). Second, research on stigmatized groups is ethically challenging. We balanced considerations of the risk in relation to increased stereotyping, against gaining increased societal awareness of negative stereotypes.
Variables
Instead of asking respondents about their personal opinions regarding the immigrant groups, we followed the strategy of Fiske et al. (2002) and asked the respondents how they think ‘people in Norway’ consider the different groups. This strategy follows the theoretical notion of stereotypes as culturally shared notions of what characterizes different groups. Furthermore, this indirect way of asking also reduces social desirability bias, as people are more willing to provide honest answers when asked about others’ opinions (Cuddy, Fiske & Glick 2008). Finally, this strategy reduces the problem of explaining ‘attitudes by attitudes.’ As emphasized in the classical ‘Funnel of Causality’ (Campbell et al. 1960), personal attitudes are affected by a host of historical and structural factors, and the causal relationship between two attitudes is difficult—if impossible—to identify. When asking about perceptions of attitudes held by others (‘third order beliefs’), as is done in the SCM model, responses are probably less likely to be affected by personally held attitudes (‘first order beliefs’), as is done in the MCP model (Ridgeway & Correll 2006).
Following past work on SCM in Norway (Bye et al. 2014), we measured four sets of stereotypes, using 10 separate questions about each immigrant group. The sample was randomly divided into five groups, and each of these groups was asked to evaluate one immigrant group each based on country of origin, as follows: Swedes (gr. 1), Somalis (gr. 2), Pakistanis (gr. 3), Syrians (gr. 4), or Poles (gr. 5) (see Table 1 for descriptive statistics for each treatment group). By evaluating only one immigrant group, the experimental design excluded the possibility that respondents could rank the groups against each other. Therefore, we can interpret differences between the different immigrant groups as a direct effect of perceptions of how the Norwegian population stereotypes just that group, and how these perceptions are moderated by MCP.
Table 1
Descriptive statistics. Mean and [standard deviation] for each treatment group.
| GR. 1 (SWEDES) | GR. 2 (SOMALIS) | GR. 3 (PAKISTANIS) | GR. 4 (SYRIANS) | GR. 5 (POLES) | (MIN-MAX) | |
|---|---|---|---|---|---|---|
| Warmth | 2.72 [0.66] | 1.61 [0.74] | 2.07 [0.73] | 2.04 [0.78] | 2.06 [0.69] | (0–4) |
| Competence | 2.96 [0.57] | 1.89 [0.61] | 2.47 [0.58] | 2.17 [0.65] | 2.50 [0.56] | (0–4) |
| Status | 2.19 [0.57] | 1.18 [0.55] | 1.99 [0.56] | 1.65 [0.64] | 1.68 [0.53] | (0–4) |
| Competition | 0.89 [0.71] | 1.60 [0.92] | 1.38 [0.84] | 1.47 [0.89] | 1.26 [0.76] | (0–4) |
| MCP | 2.67 [0.73] | 2.68 [0.74] | 2.70 [0.70] | 2.72 [0.74] | 2.66 [0.73] | (1–4) |
| Gender (women = 1) | 0.48 [0.50] | 0.45 [0.50] | 0.52 [0.50] | 0.49 [0.50] | 0.50 [0.50] | (1–2) |
| Age | 51.94 [16.82] | 52.36 [16.37] | 51.68 [16.52] | 51.61 [16.59] | 52.81 [16.99] | (15–87) |
| Higher education | 0.33 [0.47] | 0.32 [0.47] | 0.35 [0.48] | 0.34 [0.47] | 0.34 [0.47] | (0–1) |
| n | 596 | 557 | 519 | 575 | 552 |
To measure warmth and competence, the respondents were instructed to ‘think about how [group] are viewed by people in Norway in general. To what extent are [group] considered by most people to be (a warmth) … warm; honest (Cronbach alpha, Swedes [α = 0.81]; Somalis [α = 0.81]; Pakistanis [α = 0.74]; Syrians [α = 0.85]; Poles [α = 0.70]), and (b competence) … competent; self-confident (Cronbach alpha, Swedes [α = 0.41]; Somalis [α = 0.25]; Pakistanis [α = 0.39]; Syrians [α = 0.45]; Poles [α = 0.30])?’
The SCM also includes measures of status and competition, which are used to describe the two main dimensions (warmth and competence). To measure status, the respondents were instructed to ‘think about how [group] are viewed by people in Norway in general. To what extent are [group] considered by most people to have …’ prestigious jobs, economic success, and a good education (Cronbach alpha, Swedes [α = 0.80]; Somalis [α = 0.80]; Pakistanis [α = 0.77]; Syrians [α = 0.80]; Poles [α = 0.70]). To measure competition, respondents were asked to indicate the extent to which ‘[Group] get resources so that other groups in society get less,’ ‘When [group] get more power, other groups in society get less power,’ and ‘[group] get special treatment that makes things more difficult for other groups in Norway’ (Cronbach alpha, Swedes [α = 0.84]; Somalis [α = 0.87]; Pakistanis [α = 0.87]; Syrians [α = 0.87]; Poles [α = 0.84]).
Thus, in total, we measured stereotypes along four dimensions and created indices for each, as follows: warmth (two items), competence (two items), status (three items), and competition (three items). All items had five values, from ‘to a large extent’ (4) to ‘not at all’ (0), with ‘to some extent’ (2) as the mean value.
The SCM-items measured how respondents perceived people from different nationalities and did not specify immigrants from these nations in Norway. As such, some respondents may evaluate national groups irrespective of which country they live in. Still, the questions on stereotypes came late in a larger survey on attitudes toward immigration, integration, and diversity, and it is therefore likely that most respondents were primed to think about immigrants when responding.1
The main independent variable is MCP, which was measured in line with previous studies based on the European context (Blinder, Ford & Ivarsflaten 2013; Ivarsflaten, Blinder & Ford 2010). MCP is an index consisting of the mean values on the two following items: ‘It is important for me personally to be open-minded toward immigrants,’ and ‘I feel guilty if I think negatively about immigrants’ (α = 0.62). Each item was answered using a four-point scale, from total agreement to total disagreement, in addition to ‘don’t know.’ Respondents were included in the sample if they responded to at least one of the items.
The experimental design should theoretically produce identical treatment groups, thereby reducing the importance of including other control variables. Still, in order to rule out the possibility that the experimental design did not produce balanced subsamples, we also estimated models with controls for gender, age, and education. Furthermore, a separate analysis showed that women, individuals under 30 years of age, and those with higher education have higher scores on the MCP index (results may be retrieved upon request), and we wanted to rule out the possibility that the relationship between the MCP index and stereotypes was affected by sociodemographic characteristics.
Results
The results are presented in two steps. First, we explore the descriptive results from the stereotype experiment. Second, we analyze the relationship between stereotypes and MCP. Table 1 reports descriptive statistics for all variables included in the analyses, grouped by each treatment group. Considering the independent and control variables (MCP, gender, age, and education), the table suggests that the treatment groups were fairly balanced. The MCP index was close to being normally distributed, with a mean score of 2.7 on a 1–4 scale.
The table further lends support to H1, that immigrant groups perceived as similar to native Norwegians will be stereotyped more positively (warm and competent) than immigrant groups perceived as less similar. The Swedes received the highest score on warmth, competence, and status, and the lowest score on competition. In contrast, Somalis received the lowest score on warmth, competence, and status, and the highest score on competition. Pakistanis, Syrians, and Poles received scores somewhere in between. Pakistanis and Poles were perceived as more competent than Syrians; Pakistanis were perceived as having more status than Syrians and Poles, while Syrians were perceived as higher on competition, followed by Pakistanis and Poles. The three groups received virtually identical scores on warmth.
The main dimensions of the SCM (competence and warmth) are illustrated in Figure 1. The figure plots the groups’ mean scores in a two-dimensional space, where the horizontal axis refers to how the groups are evaluated on competence, and the vertical axis refers to how the groups are evaluated on warmth.
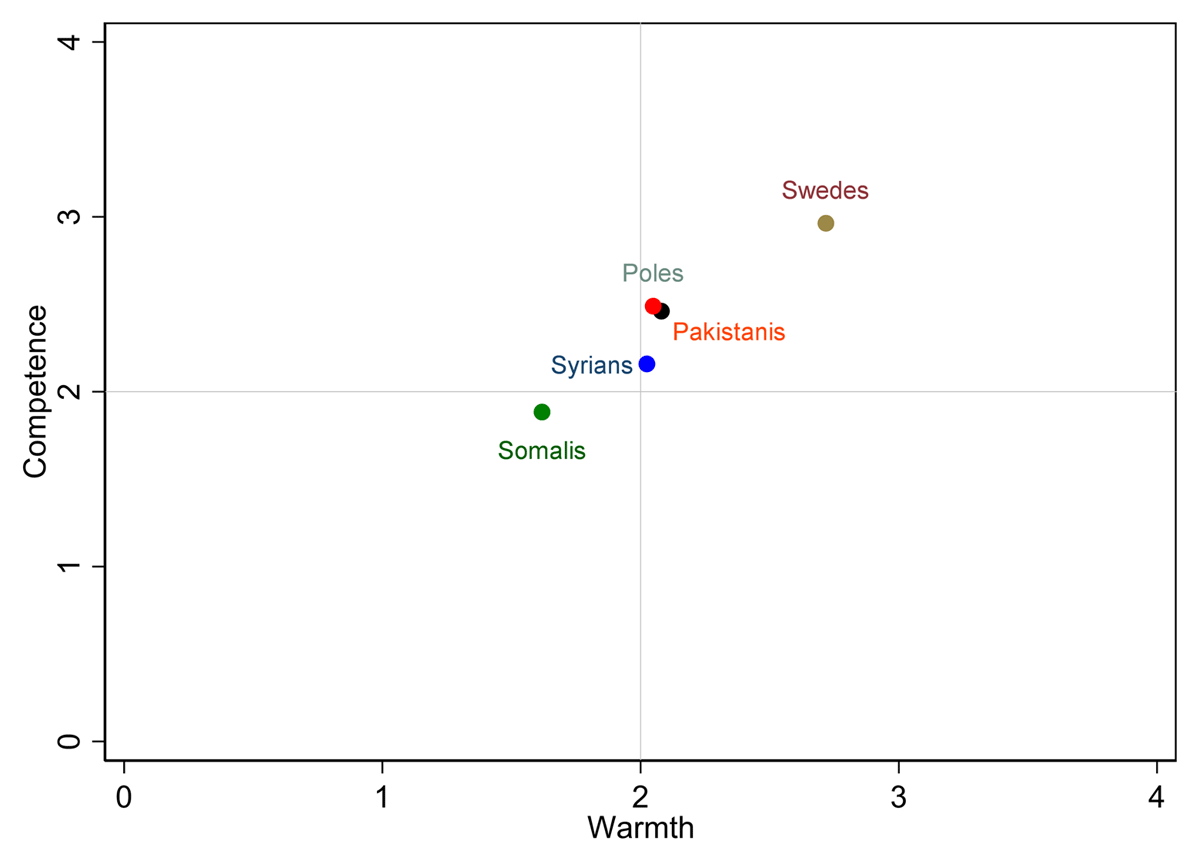
Figure 1
Placement of national groups based on competence (average of two variables) and warmth (average of two variables). N = 519–596 per group, randomly distributed.
Figure 1 shows a linear relationship between competence and warmth, that is, the groups are evaluated similarly on the two dimensions. Swedes are perceived as both the warmest and most competent group, with mean scores of about three (‘to a large extent’) on both dimensions. Conversely, Somalis are perceived as the least warm and competent group, with mean scores below two (‘to some extent’) on both dimensions. Thus, Swedes could be considered as an ‘ingroup,’ while Somalis—by being stereotyped as cold and incompetent—are considered as an outgroup. The Poles and Pakistanis are rated as moderate in both competence and warmth, while the Syrians are perceived as equally warm but less competent. These three groups are somewhat closer to being considered as ingroups rather than outgroups.
The linear relationship between warmth and competence shows a strong correlation between the two for all groups (pairwise correlations for each treatment group varied between 0.45 and 53, see Appendix Table 1, Supplementary Files). This supports H2 that ambivalent stereotypes are not highly present in a Norwegian context—when evaluating these five groups. The one minor exception is the position of the Syrian group.
Furthermore, across the immigrant groups, respondents who gave high scores on competition were also likely to give high scores on warmth (pairwise correlations ranging from 0.43 to 0.53). Moreover, a high score on status is correlated with a high score on competence (pairwise correlations ranging from 0.37 to 0.54, see Appendix Table 1, Supplementary Files). In other words, perceived status predicts perceived competence, and perceived competition predicts the warmth dimension. The respondents perceive culturally close immigrant groups as trustworthy (warm and competent), while culturally distant immigrant groups are perceived as less trustworthy (cold and incompetent).
The Impact of MCP
Next, we study the relationship between stereotypes and MCP. The expectation is that respondents with a high score on the MCP index will be more likely to stereotype all immigrant groups as warm and competent.
The results are summarized in Table 2, which reports the results from three regression models (OLS) for each stereotype dimension (competence, warmth, status, and competition). Model 1 includes treatment groups (dummies, Sweden as a reference) and the MCP index. As described above, in order to rule out the possibility that the experimental design did not produce balanced subsamples, we also estimated models with controls for gender, age, and education (Model 2 and 3). Model 3 adds interaction terms between subgroups and the MCP index.
Table 2
The relationship between stereotypes and MCP; OLS regression (n = 2799).
| WARMTH | COMPETENCE | STATUS | COMPETITION | |||||||||
|---|---|---|---|---|---|---|---|---|---|---|---|---|
| (MODEL 1) | (MODEL 2) | (MODEL 3) | (MODEL 1) | (MODEL 2) | (MODEL 3) | (MODEL 1) | (MODEL 2) | (MODEL 3) | (MODEL 1) | (MODEL 2) | (MODEL 3) | |
| Swedes (ref) | ||||||||||||
| Somalis | –1.11*** | –1.11*** | –2.03*** | –1.07*** | –1.07*** | –1.42*** | –1.02*** | –1.02*** | –1.50*** | 0.72*** | 0.73*** | 1.71*** |
| Pakistanis | –0.66*** | –0.66*** | –1.39*** | –0.50*** | –0.50*** | –0.68*** | –0.21*** | –0.21*** | –0.59*** | 0.50*** | 0.50*** | 1.24*** |
| Syrians | –0.69*** | –0.69*** | –1.44*** | –0.80*** | –0.80*** | –1.08*** | –0.54*** | –0.54*** | –1.16*** | 0.60*** | 0.60*** | 1.37*** |
| Poles | –0.65*** | –0.65*** | –0.85*** | –0.46*** | –0.46*** | –0.42*** | –0.51*** | –0.51*** | –0.58*** | 0.37*** | 0.37*** | 0.82*** |
| MCP | 0.26*** | 0.26*** | 0.07† | 0.12*** | 0.11*** | 0.05 | 0.07*** | 0.08*** | –0.03 | –0.27*** | –0.29*** | –0.07 |
| MCP*Swedes (ref) | ||||||||||||
| MCP*Somalis | 0.35*** | 0.13** | 0.18*** | –0.37*** | ||||||||
| MCP*Pakistanis | 0.27*** | 0.07 | 0.15** | –0.27*** | ||||||||
| MCP*Syrians | 0.28*** | 0.10* | 0.23*** | –0.29*** | ||||||||
| MCP*Poles | 0.07 | –0.02 | 0.02 | –0.17** | ||||||||
| Gender | 0.05† | 0.04† | 0.10*** | 0.10 | –0.01 | –0.01 | –0.00 | 0.00 | ||||
| Age | 0.00† | 0.00† | –0.00 | –0.00 | 0.00*** | 0.00*** | –0.01*** | –0.01*** | ||||
| Education | 0.05 | 0.04 | –0.05* | –0.05 | –0.05* | –0.05* | –0.18*** | –0.18*** | ||||
| cons | 2.02 | 1.92 | 2.43 | 2.64 | 2.69 | 2.85 | 2.00 | 1.86 | 2.17 | 1.62 | 2.06 | 1.48 |
| r2 | 0.25 | 0.26 | 0.27 | 0.29 | 0.29 | 0.30 | 0.27 | 0.28 | 0.29 | 0.14 | 0.16 | 0.17 |
[i] Entries are unstandardized coefficients from OLS regression models. ***p < 0.001, **p < 0.01, *p < 0.05, †p < 0.1.
First, Table 2 shows that the experimental design (randomization of subgroups) was robust. This is graphically illustrated in Figure 2. By comparing Models 1 and 2 (with and without control variables) across dependent variables, we see that the regression coefficients for the main independent variables (subgroups and MCP) do not change. Second, the results (Models 1 and 2) suggest that MCP is positively correlated with perceptions of warmth, competence, and status and negatively correlated with competition. The effects are particularly strong on warmth (positive) and competition (negative). In other words, a higher score on the MCP index means that a respondent perceives the different immigrant groups as being warmer and more competent and having a higher status compared to those who have a lower score on the MCP index. Conversely, those with a higher score on the MCP index are less likely to perceive immigrants as competitive.
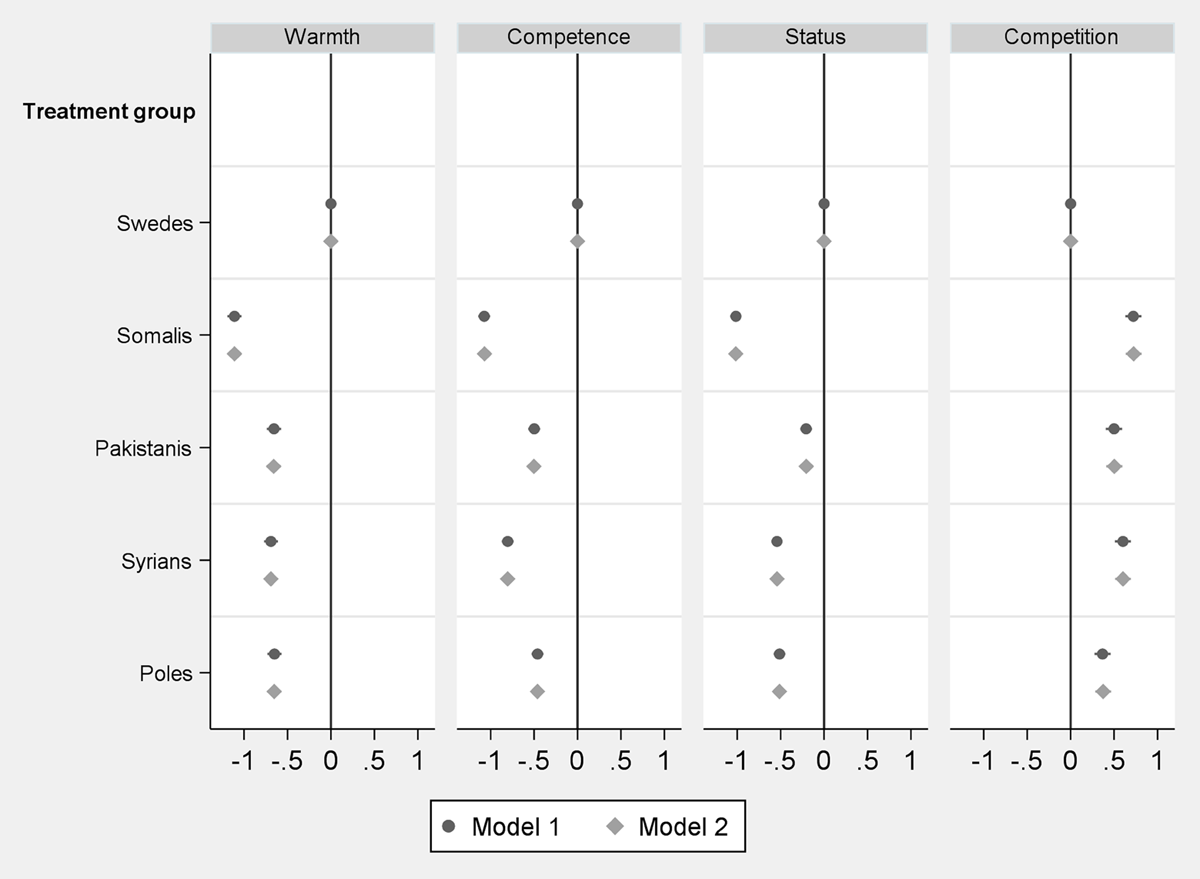
Figure 2
Effect of treatment group on stereotypes. Results from regression models 1 and 2.
Horizontal lines indicate 95% confidence intervals. Control variables: Model 1: Motivation to control prejudice. Model 2: Motivation to control prejudice, gender, age, education.
The differences between the immigrant groups are reduced when introducing interaction terms (Model 3). Almost all interaction terms are statistically significant and in the opposite direction of the country dummies. Thus, some of the variation in SCM-scores is reduced when taking account of MCP.
The effects are illustrated in Figure 3. The figure adds to the regression table by illustrating that MCP does not correlate with perceptions of Swedes but that those with a high score on the MCP index view the more culturally distant groups as warmer, having more status, and being less in competition and, to some extent, also more competent.
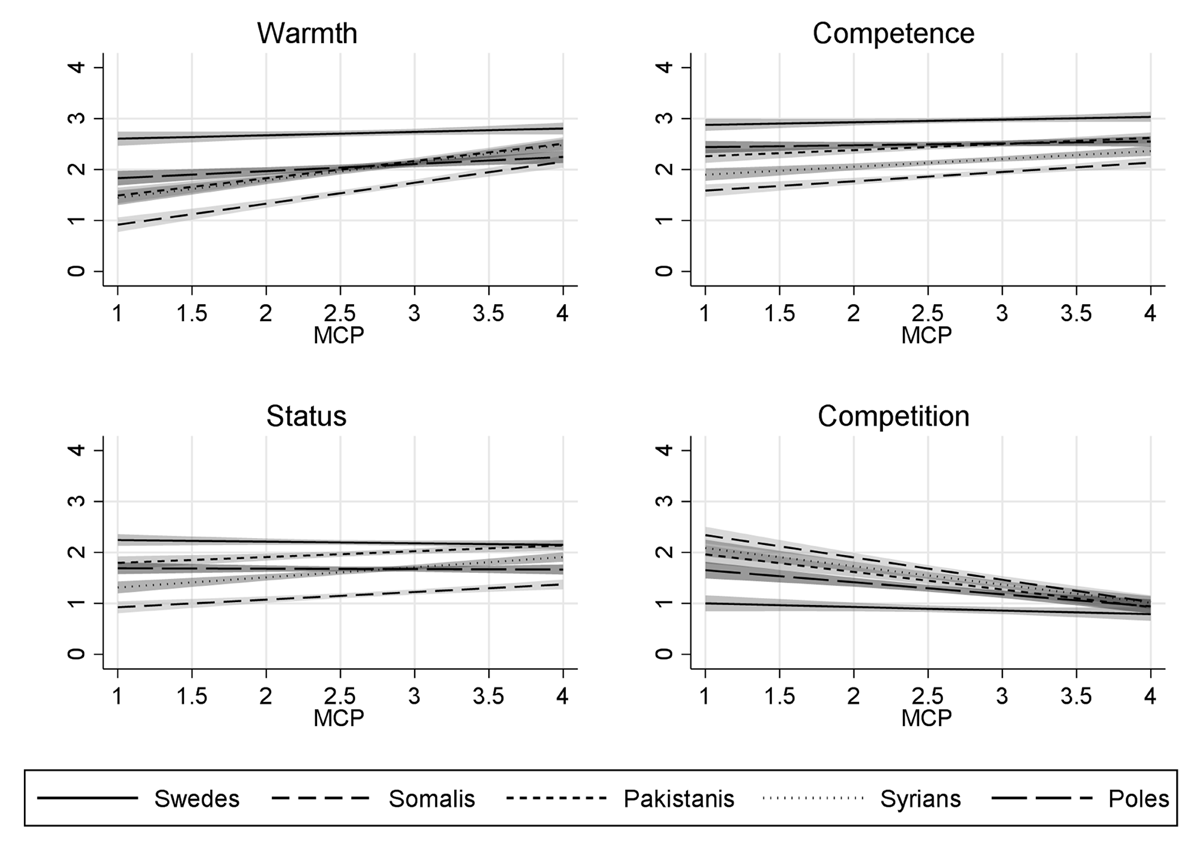
Figure 3
The interaction effects between treatment group and MCP on stereotypes. Results from regression model 3.
Shaded areas indicate 95% confidence intervals. Control variables: Model 3: Gender, age, education.
Respondents with a high score on the MCP index are generally less likely to stereotype the groups differently (coinciding lines to the right), a finding that seems robust given the experimental design of this study (i.e., respondents considered only one group each). This finding supports H3, and nuances the generality of the SCM, especially the warmth and competition dimensions, by showing that perceptions of stereotypes are moderated by an individual psychological trait, which is associated with attitudes toward immigrants.
Discussion
Building on the SCM this study has examined how the majority population perceived five of the largest immigrant groups in Norway. Departing from previous research, we expected that perceived group (dis)similarity would influence the majority populations’ perceptions of competence and warmth of different immigrant groups (Bye et al. 2014; Cuddy, Fiske & Glick 2008; Fiske et al. 2002; Grigoryev, Fiske & Batkhina 2019).
Our first hypothesis (H1), which stated that immigrant groups perceived as similar to native Norwegians will be stereotyped more positively (warm and competent) than immigrant groups perceived as less similar, was supported by the data. As expected, Swedes, an immigrant group that is perceived as culturally similar, received more positive stereotypes (warm/competent) than the Somali immigrant group, which was stereotyped as both cold and incompetent. Pakistani, Polish, and Syrian immigrants were rated as moderate in both competence and warmth. Thus, our findings support previous studies that describe an ethnic hierarchy in Norwegian society, a hierarchy steered by cultural similarity and group status (Bye et al. 2014). Our results indicate a stereotyped hierarchy with Swedes on top, followed by Pakistani, Poles, and Syrians, with Somali immigrants at the bottom. The ethnic hierarchy matches the groups’ positions in the labor market when it comes to employment as well as their experiences with discrimination in Norway (Midtbøen & Kitterød 2019). The conundrum is the overlapping position of Pakistanis and Poles. The Pakistanis have by far the longest residence time in Norway, having arrived over the past 50 years. In comparison, most Poles started arriving as late as in 2004, but, coming from a European country, they may be perceived as culturally closer to Norwegians. In sum, these two factors may work in opposite directions, leaving them with similar scores on the stereotype content variables. Moreover, the data indicate that both status and competition play important roles in the categorization of ethnic groups in Norway. As suggested by the SCM, social structure may predict stereotype content (Fiske et al. 2002; Grigoryev, Fiske & Batkhina 2019).
The second hypothesis (H2), which stated that ambivalent stereotypes will not be highly present, was also supported by the data. Consistent with previous research that shows that unequal societies report more ambivalent stereotypes (Durante et al. 2013; Schofield et al. 2021), we found less and moderate ambivalent stereotypes in the Norwegian context. Our expectation that low inequality in Norwegian society would be associated with high warmth and competence correlation coefficients, was supported for all five immigrant groups. The overall picture, as confirmed in a previous SCM study (Bye et al. 2014), is that ambivalent immigrant stereotypes are less prevalent in Norway.
The third hypothesis (H3), which expected that individuals with strong MCP would be more likely to stereotype all groups as warm and competent, was strongly supported by the data. As expected, respondents with a high MCP rated the groups that are stereotyped as cold and incompetent more positively, than individuals with a low MCP. Individuals with high MCP are much more likely to stereotype all groups as equally competent and warm. This adds to the SCM literature, by suggesting that the content of group stereotypes is mainly driven by respondents with a low MCP. Respondents with a high MCP perceived the more culturally distant groups as warmer, having more status, and being less in competition and, to some extent, more competent. This corroborates other studies that show that people who hold status beliefs as third order beliefs often personally endorse them as first order beliefs as well (Ridgeway & Correll 2006). Interestingly, although there exist differences between how individuals with a low and a high MCP perceive different ethnic groups, the correlation between the structural variables (status and competition) and stereotype content (warmth and competence) is evident in both respondent groups. Perceived status predicts perceived competence, and perceived competition predicts the warmth dimension among both respondents with a high and a low MCP. As pointed out by others, although there exist internal variations in the content of stereotypes (e.g., between regions), this does not necessarily imply a different structure (Stanciu et al. 2017). By addressing characteristics of the perceiver, such as individual differences in MCP, this study accentuates previous research that shows the centrality of human values in the formation of threat and attitudes towards immigrant groups (Davidov et al. 2020; Walsh & Tartakovsky 2021).
The SCM framework assesses social stereotypes by asking respondents to report on the generalized views of others in their society (third order beliefs), while the MCP assesses personal attitudes (first order beliefs). Thus, there is a discrepancy between the two models deployed in this study that should be taken into consideration in interpreting the results. As discussed in the Data and Methods section, an advantage of this approach is that we reduce the problem of explaining attitudes by attitudes. Still, we lack information on respondents’ personal attitudes (first order) toward the five groups, and cannot rule out the possibility that we are measuring individual attitudes on both sides of the equation. Thus, an important task for future research is to measure the effect of MCP on both personal and social stereotypes.
Conclusion
This study contributes to the existing literature by confirming the relevance of the SCM model in an egalitarian welfare state setting. This is the first large-N empirical analysis of the content of stereotypes about immigrant groups in Norway. The results confirm the findings in low-n studies on the SCM in Norway (Bye et al. 2014; Phelps et al. 2013) and demonstrate how this framework provides valid predictions on group stereotypes. On an overall level, this study provides important insights into how different ethnic groups are stereotyped, allowing inferences about which groups are most likely to share experiences of prejudice and discrimination (Bye et al. 2014; Cuddy, Fiske & Glick 2008). As others have pointed out (Bye et al. 2014), stereotype content matters because different groups experience different forms of discrimination.
Further, the present study extends the SCM model by examining how respondents’ MCP moderates stereotype judgement. The results indicate that perceptions of stereotypes are moderated by individuals’ MCP and that stereotypical perceptions toward the five immigrant nationalities are mainly driven by those with a weak MCP. The findings in this paper indicate that an individual propensity to hold back on prejudices influences expressions of stereotype content. Identifying stereotypes and moderating mechanisms is key to improving intergroup relations.
Additional File
The additional file for this article can be found as follows:
Notes
[2] See http://hdl.handle.net/11250/2502178 for questionnaire and documentation of the survey.
Acknowledgements
We gratefully acknowledge the insightful comments of the anonymous reviewers and those of the research group Equality, inclusion and migration (LIM) at the Institute for Social Research, for valuable comments on an earlier draft of the article. Finally, we would like to thank Hege Høivik Bye for valuable comments on the Stereotype Content Model in the Norwegian context.
Funding Information
This research has received funding from The directorate of integration and diversity (IMDi), Norway.
Competing Interests
The authors have no competing interests to declare.