
Table 1
Distribution by socioeconomic background in the year of completing compulsory school.
| 1995 | 2005 | 2009 | |||||||
|---|---|---|---|---|---|---|---|---|---|
| NATIVE DANES | 2ND GENERATION, 1ST GENERATION (0–5) | 1ST GENERATION (6–15) | NATIVE DANES | 2ND GENERATION, 1ST GENERATION (0–5) | 1ST GENERATION (6–15) | NATIVE DANES | 2ND GENERATION, 1ST GENERATION (0–5) | 1ST GENERATION (6–15) | |
| Family situation | |||||||||
| Living at home with two parents | 76.4 | 76.6 | 60.9 | 74.4 | 75.5 | 61.8 | 73.2 | 71.2 | 57.7 |
| Living at home with one parent | 17.4 | 14.5 | 19.1 | 20.4 | 19.1 | 21.0 | 21.8 | 23.9 | 19.5 |
| Living with partner | 0.6 | 1.2 | 3.7 | 0.5 | 0.6 | 1.7 | 0.4 | 0.4 | 2.0 |
| Living alone | 5.5 | 7.6 | 16.3 | 4.6 | 4.7 | 15.5 | 4.6 | 4.5 | 20.8 |
| No information in registers | |||||||||
| Mother | 0.8 | 0.4 | 10.2 | 0.8 | 0.6 | 11.7 | 0.8 | 0.6 | 11.7 |
| Father | 1.5 | 2.7 | 19.2 | 1.7 | 3.8 | 28.5 | 2.1 | 4.5 | 28.1 |
| Mother—educational level | |||||||||
| Primary and lower secondary education | 37.7 | 29.9 | 35.9 | 23.6 | 38.1 | 31.5 | 18.5 | 42.8 | 38.8 |
| General upper secondary education | 2.1 | 5.5 | 8.0 | 4.3 | 7.3 | 11.3 | 5.0 | 10.0 | 11.5 |
| Vocational education and training | 32.0 | 12.1 | 13.0 | 36.9 | 20.1 | 20.8 | 39.8 | 22.8 | 16.2 |
| Higher education | 24.2 | 6.2 | 12.2 | 32.2 | 11.9 | 17.7 | 34.0 | 13.9 | 14.5 |
| No information1) | 4.0 | 46.3 | 30.9 | 3.0 | 22.6 | 18.7 | 2.7 | 10.6 | 19.0 |
| Father—educational level | |||||||||
| Primary and lower secondary education | 26.4 | 42.1 | 25.2 | 22.2 | 32.8 | 14.8 | 19.9 | 33.5 | 21.3 |
| General upper secondary education | 2.2 | 5.5 | 4.6 | 3.6 | 5.3 | 6.9 | 4.2 | 7.2 | 7.7 |
| Vocational education and training | 43.0 | 16.7 | 14.1 | 42.4 | 21.1 | 19.8 | 43.0 | 23.3 | 15.7 |
| Higher education | 20.6 | 7.8 | 13.2 | 24.4 | 14.3 | 22.4 | 25.8 | 16.7 | 20.9 |
| No information1) | 7.8 | 27.9 | 42.9 | 7.3 | 26.5 | 36.1 | 7.1 | 19.4 | 34.4 |
| Mother—employment | |||||||||
| Employed | 80.8 | 28.8 | 13.0 | 84.2 | 41.3 | 29.0 | 83.7 | 42.4 | 31.0 |
| Not employed | 16.9 | 68.6 | 75.2 | 13.5 | 56.6 | 57.5 | 14.1 | 55.6 | 56.0 |
| No information1) | 2.4 | 2.5 | 11.8 | 2.3 | 2.1 | 13.5 | 2.2 | 2.0 | 13.1 |
| Father—employment | |||||||||
| Employed | 82.9 | 45.1 | 20.2 | 83.9 | 49.9 | 28.5 | 81.1 | 49.3 | 28.3 |
| Not employed | 11.1 | 45.5 | 57.4 | 10.3 | 41.2 | 40.2 | 12.9 | 41.0 | 41.4 |
| No information1) | 6.0 | 9.4 | 22.5 | 5.8 | 9.0 | 31.3 | 6.1 | 9.7 | 30.3 |
| N | 57,588 | 1,256 | 1,002 | 55,678 | 2,811 | 1,863 | 60,021 | 4,113 | 1,318 |
[i] 1) The information is missing either because the register data contain no information about the parent, or because the information for this particular variable is missing in the data.
Table 2
Distribution by grades1) in Danish and mathematics at the end of year nine for individuals who completed compulsory school.
| MEN | WOMEN | |||||
|---|---|---|---|---|---|---|
| NATIVE DANES | 2ND GENERATION AND 1ST GENERATION (0–5) | 1ST GENERATION (6–15) | NATIVE DANES | 2ND GENERATION AND 1ST GENERATION (0–5) | 1ST GENERATION (6–15) | |
| 2005: Grades—Danish | ||||||
| No information | 10.2 | 12.4 | 26.0 | 6.4 | 6.8 | 20.1 |
| 3 to 1.99 | 2.4 | 8.3 | 14.7 | 0.4 | 3.9 | 7.5 |
| 2–3.99 | 15.1 | 25.1 | 28.5 | 5.7 | 15.9 | 20.0 |
| 4–6.99 | 43.3 | 40.8 | 23.8 | 36.0 | 46.2 | 36.0 |
| 7–12 | 28.9 | 13.4 | 7.0 | 51.4 | 27.2 | 16.5 |
| 2005: Grades—Mathematics | ||||||
| No information | 10.0 | 12.4 | 25.8 | 6.7 | 6.9 | 20.0 |
| 3 to 1,99 | 3.6 | 11.1 | 14.4 | 1.9 | 7.9 | 7.3 |
| 2–3.99 | 13.6 | 23.2 | 21.9 | 10.6 | 22.4 | 21.6 |
| 4–6.99 | 37.8 | 35.1 | 24.7 | 35.3 | 42.4 | 32.0 |
| 7–12 | 35.1 | 18.1 | 13.1 | 45.4 | 20.4 | 19.2 |
| N | 28,565 | 1,412 | 991 | 27,113 | 1,399 | 872 |
| 2009: Grades—Danish | ||||||
| No information | 9.7 | 12.3 | 19.5 | 6.2 | 6.0 | 16.0 |
| 3 to 1.99 | 2.8 | 8.6 | 11.5 | 0.7 | 3.2 | 6.6 |
| 2–3.99 | 15.8 | 26.3 | 33.2 | 6.8 | 19.4 | 29.4 |
| 4–6.99 | 41.2 | 40.9 | 29.9 | 35.4 | 46.8 | 36.2 |
| 7–12 | 30.5 | 11.8 | 5.9 | 50.9 | 24.6 | 11.7 |
| 2009: Grades—Mathematics | ||||||
| No information | 9.7 | 12.1 | 18.8 | 6.5 | 6.1 | 16.2 |
| 3 to 1.99 | 4.5 | 14.9 | 13.3 | 5.3 | 14.5 | 16.4 |
| 2–3.99 | 12.2 | 18.2 | 21.6 | 13.2 | 22.5 | 20.7 |
| 4–6.99 | 24.3 | 26.4 | 24.8 | 25.7 | 28.9 | 26.9 |
| 7–12 | 49.3 | 28.4 | 21.5 | 49.2 | 28.1 | 19.8 |
| N | 30,630 | 2,122 | 713 | 29,391 | 1,991 | 605 |
[i] 1) Grading scale: 12—excellent performance; 10—very good performance; 7—good performance; 4—fair performance; 2—acceptable performance; 0—inadequate performance, 3: unacceptable performance. Grade 2 means, the student has just passed the exam.
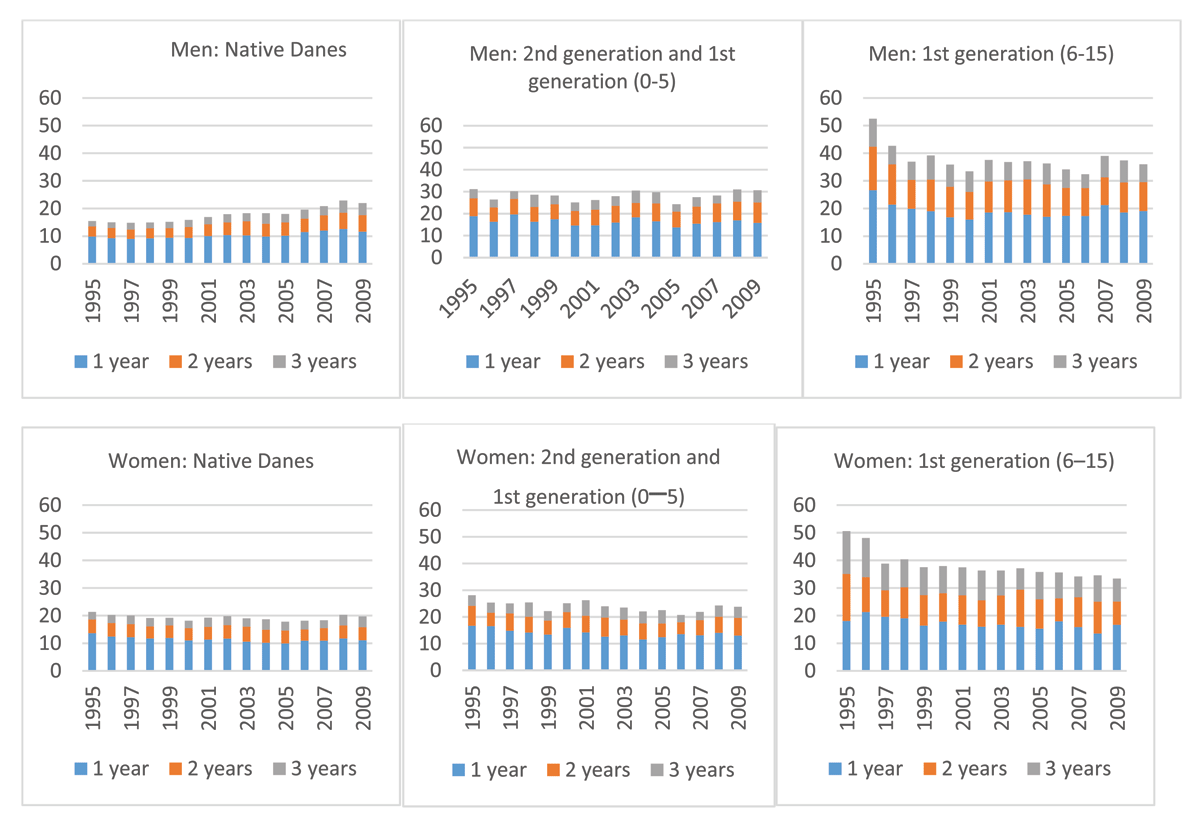
Figure 1
NEET group percentage for one, two and three years of the three-year period after completing compulsory school. Men and women who completed compulsory school from 1995 to 2009.
Table 3
The probability of having NEET status for two years of the three-year period after completing compulsory school. Individuals who completed compulsory school in 1995, 2005 and 2009.
| 1995 | 2005 | 2009 | |
|---|---|---|---|
| Without control1) | |||
| Generation 22) | 0.042*** | 0.018* | 0.018* |
| (0.010) | (0.008) | (0.009) | |
| Generation 13) | 0.198*** | 0.103*** | 0.059*** |
| (0.013) | (0.013) | (0.014) | |
| Controlled for family characteristics1) | |||
| Generation 22) | 0.049*** | 0.056*** | 0.068*** |
| (0.011) | (0.009) | (0.008) | |
| Generation 13) | 0.075*** | 0.017 | 0.079*** |
| (0.013) | (0.013) | (0.014) | |
| Controlled for family characteristics and grades at the end of year nine1) | |||
| Generation 22) | 0.061*** | 0.083*** | |
| (0.008) | (0.008) | ||
| Generation 13) | 0.070 *** | 0.133*** | |
| (0.012) | (0.012) | ||
| N | 59,846 | 60,352 | 65,452 |
[i] Significant-level: *** 0.1%-level, ** 1%-level, *** 5%-level.
1) Controls for country of origin are included. The reference category: natives, see Table A.5.
2) 2nd generation + 1st generation (0–5 years old at arrival).
3) 1st generation (6–15 years old at arrival).
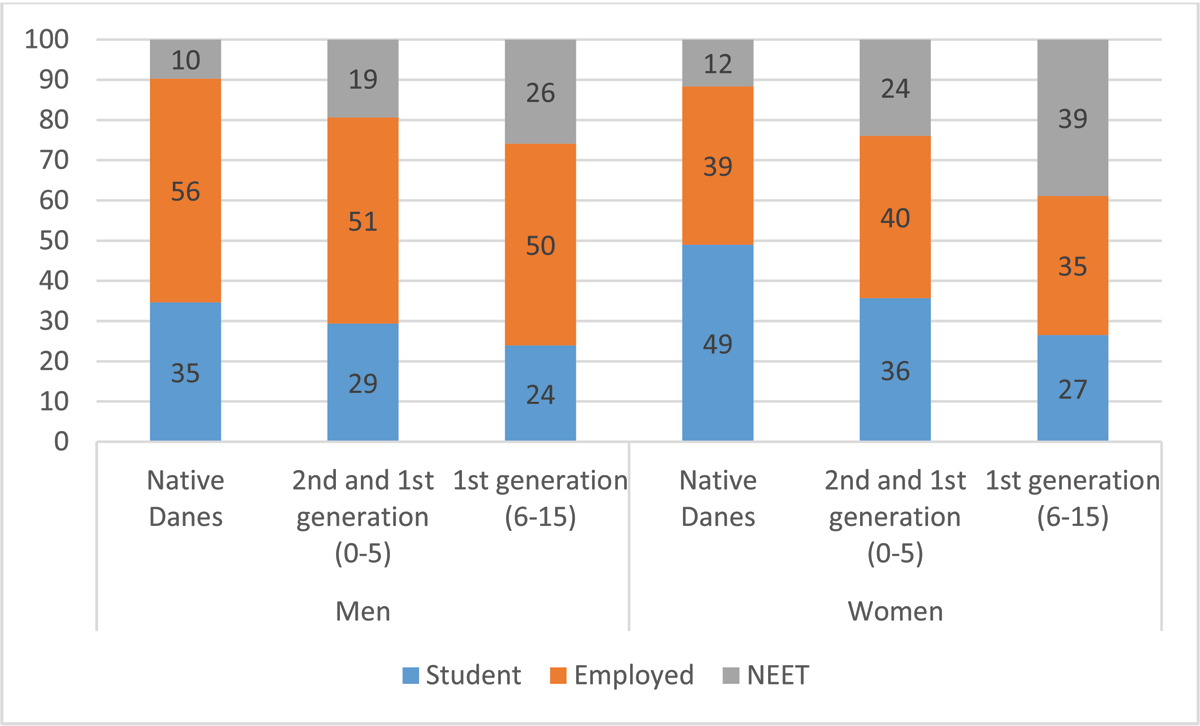
Figure 2
Distribution by labour market status seven years after completing compulsory school for individuals who completed school in 1995.
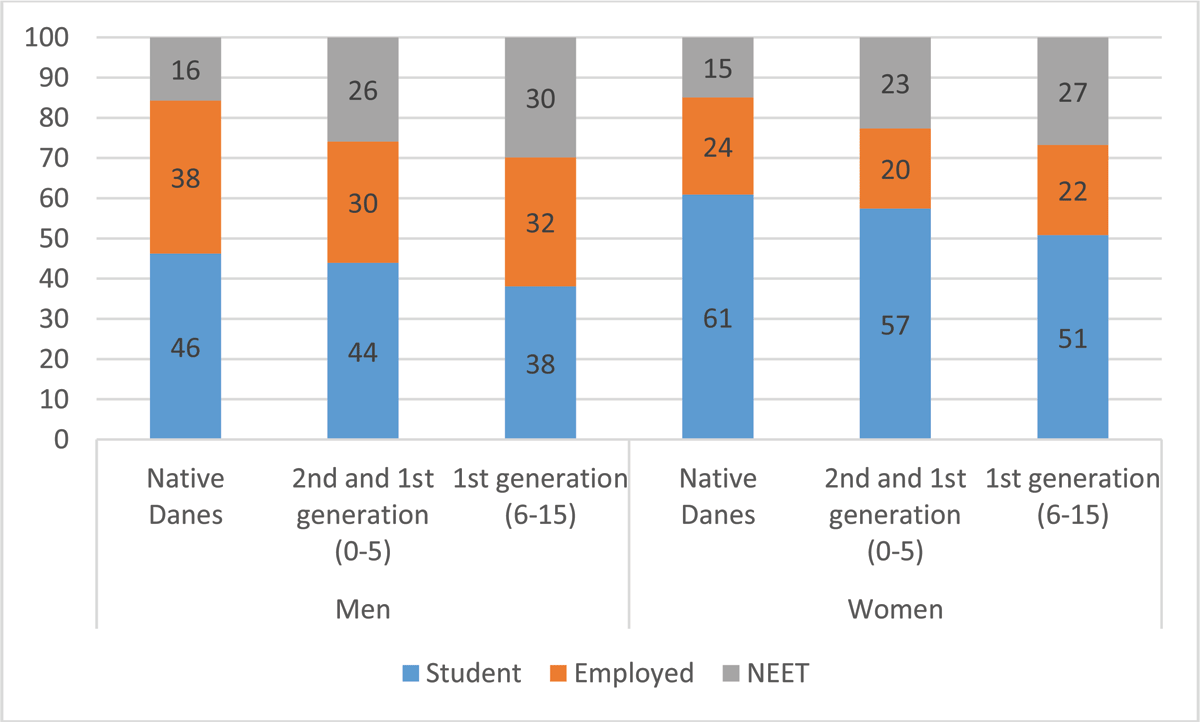
Figure 3
Distribution by labour market status seven years after completing compulsory school. Individuals who completed compulsory school in 2005.
Table 4
The probability of having NEET status seven years after completing compulsory school. Individuals who completed compulsory school in 1995 and 20051).
| 1995 | 2005 | |
|---|---|---|
| Without controls1) | ||
| NEET (after completing compulsory school) | 0.406*** | 0.450*** |
| (0.005) | (0.005) | |
| Generation 22) | 0.106*** | 0.059*** |
| (0.013) | (0.011) | |
| Generation 13) | 0.162*** | 0.071*** |
| (0.016) | (0.017) | |
| Generation 2 * NEET | 0.023 | 0.001 |
| (0.027) | (0.023) | |
| Generation 1 * NEET | 0.122*** | 0.084*** |
| (0.002) | (0.003) | |
| Controlled for completed education, children and family characteristics1) | ||
| NEET (after completing compulsory school) | 0.262*** | 0.278*** |
| (0.005) | (0.006) | |
| Generation 22) | 0.022 | 0.013 |
| (0.013) | (0.011) | |
| Generation 13) | 0.016 | 0.049** |
| (0.016) | (0.017) | |
| Generation 2 * NEET | 0.017 | 0.027 |
| (0.026) | (0.022) | |
| Generation 1 * NEET | 0.071*** | 0.050* |
| (0.021) | (0.021) | |
| N | 58,846 | 59,395 |
[i] Significant-level: *** 0.1%-level, ** 1%-level, *** 5%-level.
1) Controls for country of origin are included. The reference categories: not having NEET status after compulsory school and native, see Table A.6.
2) 2nd generation + 1st generation (0–5 years old at arrival).
3) 1st generation (6–15 years old at arrival).