
Introduction
Studies of the transition from school to further education and work have shown that children of immigrants fare worse in this transition than native-born counterparts (Baert, Heilland & Korenman 2016; Nielsen et al. 2003). Since the term NEET (Not in Education, Employment or Training) first emerged in the UK in the late 1990s and subsequently entered the European policy arena in 2010 (Eurofond 2016), scholars have widely used the term to describe the vulnerability of young people in terms of their labour market participation. Having NEET status indicates a failure to transition from youth to adulthood, a transition that typically involves entry into further education or work (Bäckman & Nilsson 2016). Indeed, several studies (focusing on young people in general) have shown that NEET status at a young age is a strong predictor of future exclusion from the labour market (Bäckman & Nilsson 2016; Ralston et al. 2022).
This article examines how children of immigrants in Denmark fare in the transition from compulsory school to further education and work compared with their native Danish counterparts. More specifically, it examines whether differences in family background and educational achievements explain the differences between children of immigrants and native Danish children. I examined the following three questions:
To what extent are children of immigrants overrepresented in the NEET group in the first three years after completing compulsory school?
Do differences in family background and grades explain the overrepresentation of children of immigrants in the NEET group?
Is having NEET status in the three-year period after compulsory school associated with higher risk of having NEET status seven years after compulsory school and if so, is this association stronger or weaker for children of immigrants than for native Danish children?
Previous research focusing on the entire group of young people shows that being NEET at a young age is associated with a high risk of being NEET later in life (Bäckman & Nilsson 2016; Ralston et al. 2022). This article contributes new knowledge on how early NEET status affects future employment prospects for children of immigrants.
Studies focusing on the entire group of young people have shown that having a disadvantaged family background is associated with a high risk of NEET status, as is low educational achievement upon completion of compulsory school (Bynner & Parsons 2002; Simmons & Thompson 2011; Tamesberger & Bacher 2014; Zuccotti & O’Reilly 2019). Given that children of immigrants typically have parents with fewer socioeconomic resources than their native counterparts, investigating whether a disadvantaged background explains a higher risk of NEET is critical for increasing our scholarly knowledge of the mechanism(s) underlying NEET status.
Context
First- or second-generation immigrants in the Danish population increased from 3% in 1980 to 14% in 2021, an increase primarily driven by increasing immigration from non-Western countries (Statistics Denmark 2021a).1 Immigration from non-Western countries started in the late 1960s and early 1970s when male immigrants from countries such as Turkey, Yugoslavia and Pakistan came to Denmark to work as guest workers in the Danish manufacturing industry. Even though this recruitment of guest workers stopped in 1973, waves of family members continued to come to Denmark in the following decades, as did refugees from different parts of the world (Bolvig & Arendt 2018; Pedersen 1999; Tranæs 2014). Today, due to increasing immigration, children of non-Western immigrants constitute a relatively large and growing share of compulsory school pupils in Denmark: in 2020, 10% of compulsory school pupils were of non-Western descent, while 2% of pupils originated from another Western country (Ministry of Children and Education 2021).
The Danish education system consists of integrated primary and lower secondary education, upper secondary education and higher education. The system of primary and lower secondary education comprises 10 years of compulsory education, with one pre-school year (year 0) and nine school years (years 1–9) and a tenth optional year (year 10). Upper secondary education consists of two main tracks: a general academic track and a vocational track. The academic track typically lasts two to three years and prepares students for higher education, while the vocational track typically lasts three to four years and prepares students for a career in a specific trade or industry. Public educational institutions are tuition free. Furthermore, students aged 18 or above enrolled in upper secondary or higher education are entitled to support for living costs in the form of state educational grants and loans (Ministry of Higher Education and Science 2021a; Ministry of Higher Education and Science 2021b).
The Danish labour market is characterised by low employment protection, a generous social safety net and an active labour market policy (the flexicurity model). A key property of the flexicurity model is high mobility between jobs, enabling the unemployed to find jobs fairly easily. However, low-skilled jobs are in short supply because of high minimum wages, and many jobs require a high level of qualifications (Andersen 2021). Thus, even though it is fairly easy for young people to find employment, unskilled jobs are scarce. Therefore, to obtain a stable attachment to the labour market, good skills are important.
Previous Research
Risk of NEET Status
Previous studies for several European countries have shown that children of immigrants have a higher risk of NEET status at a young age than their native counterparts, see Tamesberger and Bacher (2014); Montgomery, Petersen and Jervelund (2018). The latter study, which examined the risk of NEET status at age 22 in Denmark, showed that (a) risk of NEET status was higher for immigrants who were school-aged when arriving to Denmark than for native Danish counterparts, but also that (b) inequality between the two groups in terms of risk of NEET status declined during the analysis period (1995–2014). This decline was more pronounced for refugees than for other immigrants and more pronounced for girls than for boys (Montgomery, Petersen & Jervelund 2018).
The higher risk of NEET status reflects a more difficult transition from school to further education and work for children of immigrants than for native counterparts. Previous research suggests that age at immigration affects this transition. For example, Schaafsma and Sweetman (2001) and Böhlmark (2008) found that the age at immigration and educational attainment/earnings strongly correlate for children of immigrants. Language skills are found to be an important mediator through which age at immigration affects educational attainment and thereby also employment probability and earnings (Basu 2018). Other mediators may be knowledge of the host country education system and labour market, which typically increase with time spent in the host country (Tegunimataka 2021).
The Influence of Family Background
Intergenerational mobility refers to the relationship between status of parents and children. Cholli and Durlauf (2022) distinguish between family models and social models depending on whether the key mechanism is either family factors (e.g., income, education, family composition and genes) or social factors (e.g., schools and neighbourhoods).
Family models based on human capital theory relate intergenerational mobility to ability and status transmitted through generations and parents’ investments in their children’s human capital. Parents choose between investing in their children’s human capital (and thereby their children’s future earnings), their own current consumption and borrowing or saving in the form of debts or assets left for their children. Their economic resources and the perceived rate of their children’s return to skills affect the investment decisions of parents (Dustmann & Giltz 2011; Lochner 2008). More recent models also allow parental education and investments to be complementary inputs, implying that the marginal effect of each dollar invested in the child increases with the parents’ education (Cholli & Durlauf 2022).
Social models relate intergenerational mobility to the way in which parental resources (partly) determine the social environment in which the child grows up. For example, parents with high income move to neighbourhoods with high-quality schools and affluent neighbours (Cholli & Durlauf 2022).
Thus, according to both family and social models, a child’s probability of achieving a high socioeconomic position is positively correlated with their parents’ socioeconomic position. In line with these models, empirical studies show that disadvantaged family background is associated with a high risk of NEET status. Furthermore, a number of factors related to disadvantaged family background—poor school experiences, low educational achievement at the end of compulsory school, early motherhood—are also associated with a high risk (Bynner & Parsons 2002; Simmons & Thompson 2011; Tamesberger & Bacher 2014).
However, existing literature also suggests that how parents’ socioeconomic position affects their children may differ for children of immigrants and natives, but this literature disagrees on whether children of immigrants experience more or less upward mobility than their native counterparts.
On the one hand, human capital theory suggests that poor language skills and insufficient knowledge of the host country’s school system may reduce immigrant parents’ opportunities to support their children’s schooling. Consequently, children of immigrants obtain lower socioeconomic outcomes than native children with similar parental socioeconomic resources. Human capital theory also suggests that, due to expectations of discrimination, the perceived rate of return to skills for children of immigrants is lower than for native children, resulting in fewer investments in their human capital and lower earnings and thereby less upward mobility (Dustmann & Giltz 2011).
On the other hand, human capital theory also explains why children of immigrants may experience more upward mobility. Because of language limitations and insufficient knowledge of the host country’s labour market, social networks or education, the employment situation and ranking in the earnings distribution of immigrant parents may not fully reflect their ability and potential. Moreover, their children quickly acquire human capital specific for the host country labour market and catch up with their native counterparts. Another explanation offered is that immigrants are positively selected for their drive and ambition. Therefore, they invest more in their children’s education compared with native parents or are more willing to move to areas offering better prospects for their children (Abramitzky et al. 2019).
Empirical literature on the intergenerational mobility of children of immigrants also stands divided on whether upward mobility is higher or lower for children of immigrants than for native children. The empirical results differ across host countries, as well as across ethnic groups and gender within the same country (Abramitzky et al. 2019; Hammarstedt & Palme 2006; Zuccotti & O’Reilly 2019).
Scarring Effect
NEET youth are not enrolled in education and therefore pass up an opportunity to acquire qualifications that are important for their future participation in education and employment. This is one reason why we may expect NEET status just after completion of school to be associated with a higher NEET risk later in life. Another reason is that unemployment (or being inactive) may in itself entail higher risk of future weak labour attachment—referred to as the scarring effect (Skans 2011). Firstly, an unemployment period implies forgone work experience and perhaps also deterioration of general skills, thereby reducing the individual’s future employment possibilities. Secondly, employers may consider previous unemployment periods as a signal of low productivity. Thirdly, a young person’s desire to work may be influenced by early periods of unemployment. For example, if periods of unemployment per se imply more time spent with other unemployed individuals, this implies a reference group with weaker labour force participation (Skans 2011).
The scarring effect may differ for children of immigrants and their native Danish counterparts due to the differences in terms of educational and occupational choices, social networks and preferences as well as due to discrimination in the labour market. For example, given the presence of ethnic discrimination in the labour market (Dahl & Krog 2018), one might expect that, for children of immigrants, employers are more likely to perceive periods with NEET status as a signal of low productivity than they are for natives. In addition, given a concentration of immigrants in deprived neighbourhoods (Damm et al. 2022) one might expect that the probability of having a reference group with weak labour market attachment is greater for children of immigrants with NEET status than for natives with NEET status.
Previous research on young people, in general, supports the presence of short- and long-term scarring effects of NEET status at a young age. Bynner and Parsons (2002) show that NEET status in late adolescence (16–18-year-olds) increases the risk of being NEET at age 21 in the UK. Bäckman and Nilsson (2016) found that, in Sweden, having NEET status at age 22 is associated with a relatively high risk of being excluded from the labour market in subsequent years—even when controlling for family background and grades from compulsory school. Ralston et al. (2022) found that, in Scotland, having NEET status when aged 16–19 is associated with a relatively high risk of being economically inactive 20 years later—also when controlling for a number of factors influencing employment probability (educational attainment, long-term illness and geographical deprivation). However, studies focussing on the scarring effect of early NEET status for children of immigrants are still lacking.
Data and Methods
Measuring NEET Status
One strength of the NEET concept when studying young people is that it combines information about non-participation in education and employment. Only looking at non-participation in employment disregards that a large proportion of young people participate in education and thereby invest in their future. And only looking at non-participation in education disregards that being employed may also have a positive effect on future labour market attachment.
At the same time, however, the NEET concept has been criticised for including too diverse groups of young people, for example, short-term unemployed, long-term unemployed, individuals with a disability, individuals with care responsibilities and privileged youth who voluntarily become NEET while waiting for a specific opportunity or while attempting to pursue an alternative career (Eurofond 2016; Mascherini 2018). The latter group are hardly a vulnerable group. One way to avoid including young people who are only temporarily out of employment, education and training is to focus on individuals who are in the NEET group for a longer period (Kleif 2021).
The main focus of this article is NEET status in the three-year period right after compulsory school.2 NEET status in this period is defined as having NEET status for at least two of the three years. By focusing on those who have NEET status for a longer period, I followed the recommendations from the literature. However, to define NEET status later in life (seven years after compulsory school) I nly used a single year. This is less precise than using a longer period, but a relatively high NEET rate seven years after compulsory school for children of immigrants is still a strong indicator of whether this group is more vulnerable in the labour market than their native counterparts.3
I define the NEET group in a given year as young people not in employment in the last week of November and not enrolled in formal education on 30 September.4
Methods
To analyse the extent to which children of immigrants are overrepresented in the NEET group in the three-year period after compulsory school completion, I focused on those who completed compulsory school in the period of 1995–2009. For this group, I compared the percentage of young people with NEET status among children of immigrants with the percentage among native Danes.
Using regression analysis—a linear probability model—I analyse whether differences in family background and grades explain the overrepresentation of children of immigrants in the NEET group. First, I included variables for immigrant status, gender and country of origin. Second, I added variables for family situation and parents’ socioeconomic characteristics and, third, I added grades from compulsory school. To examine whether results vary with time, I estimated the models for three-year groups: 1995, 2005 and 2009.
Similarly, I used a linear probability model to analyse whether having NEET status in the three-year period right after completing compulsory school is associated with a higher risk of having NEET status seven years after compulsory school. To clarify whether this association varies with immigrant status, I interacted immigrant status with having NEET status just after compulsory school. First, I included variables for NEET status right after completing school, immigrant status, interaction term between NEET status and immigrant status, gender and country of origin. Second, I added variables for family situation and parents’ socioeconomic characteristics as well as completed education and children seven years after compulsory school. I estimated the model for individuals completing compulsory school in 1995 and 2005.
Data
I use longitudinal administrative register data from Statistics Denmark for individuals in the age group 15–39-year-olds for the period of 1994–2011. The data include information about parents,5 age, gender, family situation,6 immigrant status, country of origin, employment, education and, from 2002, grades from compulsory school. I focused on children of immigrants born in Denmark and on children who migrated to Denmark when aged 0–15.
In these data, first-generation immigrants are defined as foreign-born persons whose parents are either foreign born or hold a foreign citizenship. Second-generation immigrants are defined as persons born in Denmark whose parents are either foreign born or hold a foreign citizenship. Native Danes are defined as persons with at least one parent who is a Danish citizen born in Denmark (Statistics Denmark 2021b).
Western countries are defined as EU member states, Iceland, Norway, Great Britain, Switzerland, Andorra, Liechtenstein, the Vatican State, Monaco, Canada, USA, Australia and New Zealand. Non-Western countries are defined as all other countries.
The analysis only includes children of immigrants of non-Western origin for two reasons. First, non-Western immigrants in particular struggle in the educational system and labour market, while Western immigrants and their children are typically more similar to native Danes in terms of educational outcomes and labour market affiliation (Schultz-Nielsen & Skaksen 2017; Statistics Denmark 2021b). Second, children of non-Western immigrants constitute a larger share of compulsory school pupils (10% in 2020) than children of Western immigrants (2% in 2020).
I divide the children of immigrants into two groups: (1) children either born in Denmark or arriving to Denmark at preschool age (0–5-year-olds) and (2) children arriving to Denmark at school-age (6–15-year-olds). My rationale for this division is that age at the time of immigration strongly correlates with proficiency in the host-country language and educational achievements: early arrivers are expected to do better in the education system and labour market than late arrivers (see Basu 2018; Böhlmark 2008). Using this division can contribute new knowledge about whether differences in family background and grades affect the risk of NEET status—and how harmful early NEET status can be—for children of immigrants depending on their age at immigration.
I use a subsample for the analyses of individuals who
Were 16–19 years old when they completed compulsory school.7
Completed compulsory school in the period of 1995–2009.
Resided in Denmark at least three years after leaving compulsory school.
In the analysis of the association between NEET status in the three-year period and NEET status seven years after compulsory school, I further restricted the subsample to include individuals residing in Denmark seven years after compulsory school.8
Table 1 shows that the year they completed school, most of the young people lived at home with one or two parents. However, 16–21% of the children of immigrants who were school-aged when they came to Denmark lived alone. Possible explanations are that these individuals were relatively old when they completed compulsory school (see Table A.2 in the online appendix) and that some of them came to Denmark as unaccompanied refugee children.
Table 1
Distribution by socioeconomic background in the year of completing compulsory school.
| 1995 | 2005 | 2009 | |||||||
|---|---|---|---|---|---|---|---|---|---|
| NATIVE DANES | 2ND GENERATION, 1ST GENERATION (0–5) | 1ST GENERATION (6–15) | NATIVE DANES | 2ND GENERATION, 1ST GENERATION (0–5) | 1ST GENERATION (6–15) | NATIVE DANES | 2ND GENERATION, 1ST GENERATION (0–5) | 1ST GENERATION (6–15) | |
| Family situation | |||||||||
| Living at home with two parents | 76.4 | 76.6 | 60.9 | 74.4 | 75.5 | 61.8 | 73.2 | 71.2 | 57.7 |
| Living at home with one parent | 17.4 | 14.5 | 19.1 | 20.4 | 19.1 | 21.0 | 21.8 | 23.9 | 19.5 |
| Living with partner | 0.6 | 1.2 | 3.7 | 0.5 | 0.6 | 1.7 | 0.4 | 0.4 | 2.0 |
| Living alone | 5.5 | 7.6 | 16.3 | 4.6 | 4.7 | 15.5 | 4.6 | 4.5 | 20.8 |
| No information in registers | |||||||||
| Mother | 0.8 | 0.4 | 10.2 | 0.8 | 0.6 | 11.7 | 0.8 | 0.6 | 11.7 |
| Father | 1.5 | 2.7 | 19.2 | 1.7 | 3.8 | 28.5 | 2.1 | 4.5 | 28.1 |
| Mother—educational level | |||||||||
| Primary and lower secondary education | 37.7 | 29.9 | 35.9 | 23.6 | 38.1 | 31.5 | 18.5 | 42.8 | 38.8 |
| General upper secondary education | 2.1 | 5.5 | 8.0 | 4.3 | 7.3 | 11.3 | 5.0 | 10.0 | 11.5 |
| Vocational education and training | 32.0 | 12.1 | 13.0 | 36.9 | 20.1 | 20.8 | 39.8 | 22.8 | 16.2 |
| Higher education | 24.2 | 6.2 | 12.2 | 32.2 | 11.9 | 17.7 | 34.0 | 13.9 | 14.5 |
| No information1) | 4.0 | 46.3 | 30.9 | 3.0 | 22.6 | 18.7 | 2.7 | 10.6 | 19.0 |
| Father—educational level | |||||||||
| Primary and lower secondary education | 26.4 | 42.1 | 25.2 | 22.2 | 32.8 | 14.8 | 19.9 | 33.5 | 21.3 |
| General upper secondary education | 2.2 | 5.5 | 4.6 | 3.6 | 5.3 | 6.9 | 4.2 | 7.2 | 7.7 |
| Vocational education and training | 43.0 | 16.7 | 14.1 | 42.4 | 21.1 | 19.8 | 43.0 | 23.3 | 15.7 |
| Higher education | 20.6 | 7.8 | 13.2 | 24.4 | 14.3 | 22.4 | 25.8 | 16.7 | 20.9 |
| No information1) | 7.8 | 27.9 | 42.9 | 7.3 | 26.5 | 36.1 | 7.1 | 19.4 | 34.4 |
| Mother—employment | |||||||||
| Employed | 80.8 | 28.8 | 13.0 | 84.2 | 41.3 | 29.0 | 83.7 | 42.4 | 31.0 |
| Not employed | 16.9 | 68.6 | 75.2 | 13.5 | 56.6 | 57.5 | 14.1 | 55.6 | 56.0 |
| No information1) | 2.4 | 2.5 | 11.8 | 2.3 | 2.1 | 13.5 | 2.2 | 2.0 | 13.1 |
| Father—employment | |||||||||
| Employed | 82.9 | 45.1 | 20.2 | 83.9 | 49.9 | 28.5 | 81.1 | 49.3 | 28.3 |
| Not employed | 11.1 | 45.5 | 57.4 | 10.3 | 41.2 | 40.2 | 12.9 | 41.0 | 41.4 |
| No information1) | 6.0 | 9.4 | 22.5 | 5.8 | 9.0 | 31.3 | 6.1 | 9.7 | 30.3 |
| N | 57,588 | 1,256 | 1,002 | 55,678 | 2,811 | 1,863 | 60,021 | 4,113 | 1,318 |
[i] 1) The information is missing either because the register data contain no information about the parent, or because the information for this particular variable is missing in the data.
Comparing the educational level of parents is complicated by the relatively high percentage of children of immigrants for whom this information is missing. However, the figures indicate that a higher percentage of children of immigrants had parents with primary or lower secondary school as their highest level of completed education. The figures also show that immigrant parents had significantly lower employment rates than native Danish parents.9
Table 2 shows the distribution by Danish grades and reveals great differences between native Danes and the two immigrant groups, and between men and women: children of immigrants perform worse academically at school than native Danish children, and children of immigrants who arrived at school-age do worse than those born in Denmark or who arrived at preschool age. In all three groups, women had higher grades in Danish than men. Women also had higher grades in maths than men among those who completed compulsory school in 2005, while the gender difference in grades in maths was small for those who completed compulsory school in 2009.
Table 2
Distribution by grades1) in Danish and mathematics at the end of year nine for individuals who completed compulsory school.
| MEN | WOMEN | |||||
|---|---|---|---|---|---|---|
| NATIVE DANES | 2ND GENERATION AND 1ST GENERATION (0–5) | 1ST GENERATION (6–15) | NATIVE DANES | 2ND GENERATION AND 1ST GENERATION (0–5) | 1ST GENERATION (6–15) | |
| 2005: Grades—Danish | ||||||
| No information | 10.2 | 12.4 | 26.0 | 6.4 | 6.8 | 20.1 |
| 3 to 1.99 | 2.4 | 8.3 | 14.7 | 0.4 | 3.9 | 7.5 |
| 2–3.99 | 15.1 | 25.1 | 28.5 | 5.7 | 15.9 | 20.0 |
| 4–6.99 | 43.3 | 40.8 | 23.8 | 36.0 | 46.2 | 36.0 |
| 7–12 | 28.9 | 13.4 | 7.0 | 51.4 | 27.2 | 16.5 |
| 2005: Grades—Mathematics | ||||||
| No information | 10.0 | 12.4 | 25.8 | 6.7 | 6.9 | 20.0 |
| 3 to 1,99 | 3.6 | 11.1 | 14.4 | 1.9 | 7.9 | 7.3 |
| 2–3.99 | 13.6 | 23.2 | 21.9 | 10.6 | 22.4 | 21.6 |
| 4–6.99 | 37.8 | 35.1 | 24.7 | 35.3 | 42.4 | 32.0 |
| 7–12 | 35.1 | 18.1 | 13.1 | 45.4 | 20.4 | 19.2 |
| N | 28,565 | 1,412 | 991 | 27,113 | 1,399 | 872 |
| 2009: Grades—Danish | ||||||
| No information | 9.7 | 12.3 | 19.5 | 6.2 | 6.0 | 16.0 |
| 3 to 1.99 | 2.8 | 8.6 | 11.5 | 0.7 | 3.2 | 6.6 |
| 2–3.99 | 15.8 | 26.3 | 33.2 | 6.8 | 19.4 | 29.4 |
| 4–6.99 | 41.2 | 40.9 | 29.9 | 35.4 | 46.8 | 36.2 |
| 7–12 | 30.5 | 11.8 | 5.9 | 50.9 | 24.6 | 11.7 |
| 2009: Grades—Mathematics | ||||||
| No information | 9.7 | 12.1 | 18.8 | 6.5 | 6.1 | 16.2 |
| 3 to 1.99 | 4.5 | 14.9 | 13.3 | 5.3 | 14.5 | 16.4 |
| 2–3.99 | 12.2 | 18.2 | 21.6 | 13.2 | 22.5 | 20.7 |
| 4–6.99 | 24.3 | 26.4 | 24.8 | 25.7 | 28.9 | 26.9 |
| 7–12 | 49.3 | 28.4 | 21.5 | 49.2 | 28.1 | 19.8 |
| N | 30,630 | 2,122 | 713 | 29,391 | 1,991 | 605 |
[i] 1) Grading scale: 12—excellent performance; 10—very good performance; 7—good performance; 4—fair performance; 2—acceptable performance; 0—inadequate performance, 3: unacceptable performance. Grade 2 means, the student has just passed the exam.
Thus Tables 1 and 2 demonstrate that children of immigrants are more disadvantaged with respect to family background and educational achievements—characteristics that according to previous research influence the risk of becoming NEET—than their native counterparts.10
Results
Being NEET in the Three Years after Compulsory School
Figure 1 shows the percentage in the NEET group for one, two or three years of the three-year period after completing compulsory school. It is evident that NEET rates were higher for children of immigrants than for their native Danish counterparts. This is regardless of whether I looked at the percentage of who are in the NEET group at least one year, at least two years or all three years. Moreover, children of immigrants who arrived at school-age had higher NEET rates than children of immigrants born in Denmark or who arrived at preschool age. This concurs with previous research that shows a decline in educational attainment and employment rates with increased age at immigration (Böhlmark 2008). For instance, the percentage in the NEET group for at least one year was 15 to 23% for native Danes, 21 to 31% for children of immigrants who were born in Denmark or who arrived at preschool age and 33 to 53% for children of immigrants who arrived at school-age.
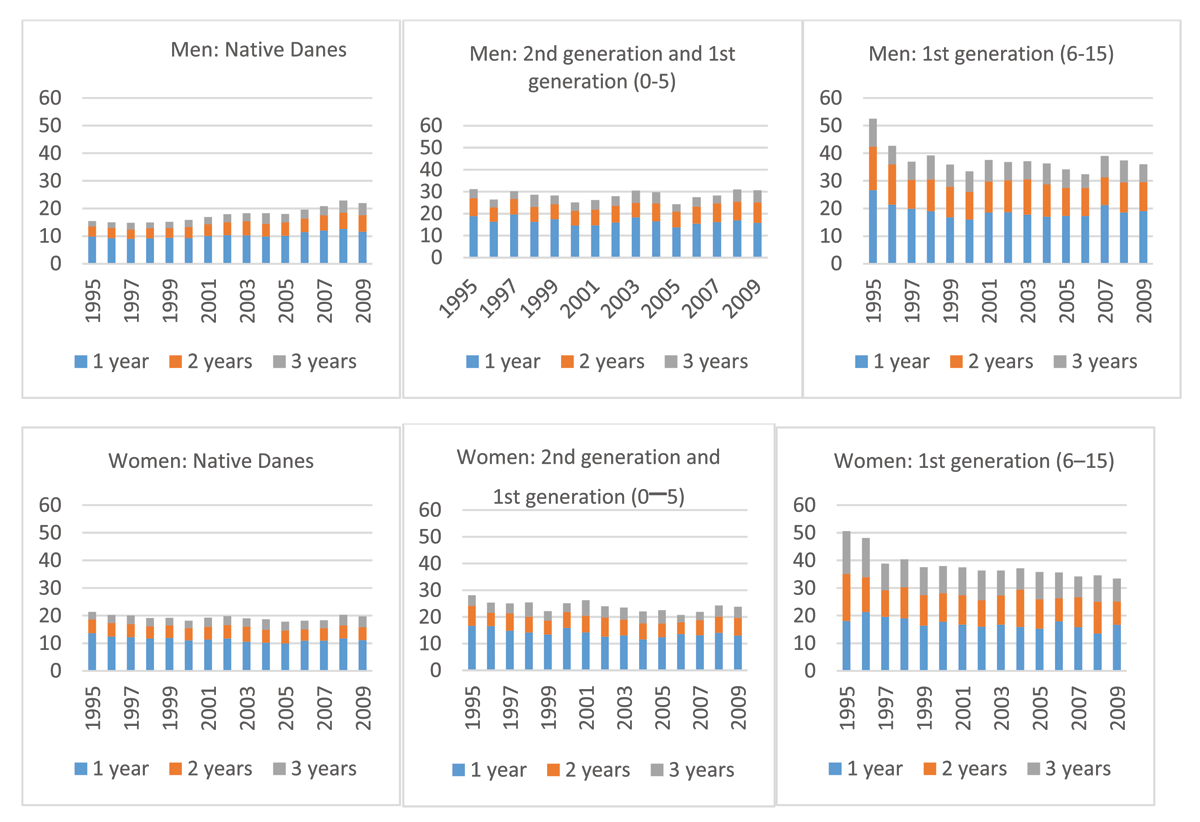
Figure 1
NEET group percentage for one, two and three years of the three-year period after completing compulsory school. Men and women who completed compulsory school from 1995 to 2009.
For native Danes, the NEET rate was higher for women than for men at the beginning of the period, while the opposite was the case at the end of the period. Similar gender differences are found for children of immigrants who arrived at school-age. For children of immigrants born in Denmark or who arrived at preschool age, the NEET rate was higher for men than for women in most of the period.
Table 3 shows the results from regression analysis of how the probability of having NEET status for at least two of the three years after compulsory school is associated with immigrant status and gender. See Table A.5 in the online appendix for results from the full model.
Table 3
The probability of having NEET status for two years of the three-year period after completing compulsory school. Individuals who completed compulsory school in 1995, 2005 and 2009.
| 1995 | 2005 | 2009 | |
|---|---|---|---|
| Without control1) | |||
| Generation 22) | 0.042*** | 0.018* | 0.018* |
| (0.010) | (0.008) | (0.009) | |
| Generation 13) | 0.198*** | 0.103*** | 0.059*** |
| (0.013) | (0.013) | (0.014) | |
| Controlled for family characteristics1) | |||
| Generation 22) | 0.049*** | 0.056*** | 0.068*** |
| (0.011) | (0.009) | (0.008) | |
| Generation 13) | 0.075*** | 0.017 | 0.079*** |
| (0.013) | (0.013) | (0.014) | |
| Controlled for family characteristics and grades at the end of year nine1) | |||
| Generation 22) | 0.061*** | 0.083*** | |
| (0.008) | (0.008) | ||
| Generation 13) | 0.070 *** | 0.133*** | |
| (0.012) | (0.012) | ||
| N | 59,846 | 60,352 | 65,452 |
[i] Significant-level: *** 0.1%-level, ** 1%-level, *** 5%-level.
1) Controls for country of origin are included. The reference category: natives, see Table A.5.
2) 2nd generation + 1st generation (0–5 years old at arrival).
3) 1st generation (6–15 years old at arrival).
The estimations shown in the first part of Table 3 includes only control variables measuring gender and country of origin. The results of the estimations show—in accordance with Figure 1—that the probability of having NEET status in the period just after school was higher for children of immigrants than for native Danes. Especially individuals who arrived at school-age had a relatively high risk of having NEET status. These results apply regardless of whether I looked at the 1995-, 2005- or 2009-year group, even though the difference between children of immigrants and their native Danish counterparts seems to decrease over time. Being an immigrant who arrives at school-age increases the probability of having NEET status by 19.8 percentage points compared with native Danes for the 1995-year group and 5.9 percentage points for the 2009-year group. For children of immigrants born in Denmark or who arrived at preschool age, the increase is 4.2 percentage points for the 1995-year group and 1.8 percentage points for the 2009-year group.
The relatively high risk of having NEET status for individuals who arrived at school-age follows the expectation mentioned above [see also Böhlmark (2008); Schaafsma & Sweetman (2001)]: children of immigrants born in Denmark or who arrived at preschool age have better opportunities to acquire Danish skills and knowledge of the Danish education system and labour market than children of immigrants who arrived at school-age.
The results in the second part of Table 3 show the association between the probability of having NEET status and immigrant status when controlling for family background. The influences of family background are shown in Table A.5. Young people living alone or with a partner have a higher probability of having NEET status than young people living with two parents. Both educational level and employment situation of parents matter: the probability of having NEET status is smaller if either or both parents have completed an education in addition to compulsory school or are in employment. These results are consistent with the theoretical explanations and previous research (see Bynner & Parsons 2002; Cholli & Durlauf 2022; Simmons & Thompson 2011; Tamesberger & Bacher 2014).
Conditional on family characteristics, the probability of having NEET status was lower for children of immigrants born in Denmark or who arrived at preschool age than for native Danes for all three-year groups. For the 1995-year group, children of immigrants who arrived at school-age still had a higher probability of having NEET status than their native Danish counterparts, while the opposite was the case for the 2009-year group. This indicates that in the 2009-year group, children of immigrants in both groups were better at overcoming a disadvantaged family background than native Danes—and thus experience higher upward mobility than native Danes—and were also better at overcoming a disadvantaged family background in 2009 than in 1995.
Good grades in year nine reduce the probability of having NEET status after compulsory school (Table A.5) and, when grades from year nine are included, I found that the probability of having NEET status was smaller for both immigrant groups than for native Danish youth for the 2005- and 2009-year groups (Table 3). Thus, controlling for grades, the children of immigrants seemed to have a lower probability of having NEET status than native Danish youth.
Finally, the gender differences in Figure 1 are confirmed by the results shown in Table A.5. Irrespective of controlling for family characteristics or not, the probability of having NEET status was higher for women than for men in 1995, while the opposite was the case in 2009.
Overall, the results in this section show that children of immigrants have a relatively high risk of having NEET status—in particular those who arrived at school-age—and that the higher risk in 2009 can be explained by a disadvantaged family background for both groups of children of immigrants.
Being NEET Seven Years after Compulsory School
Figure 2 shows the distribution between having NEET status, being enrolled in education or being employed11 seven years after completing compulsory school for men and women who completed school in 1995. Figure 3 shows similar distributions for men and women who completed school in 2005. The figures show that seven years after school, the NEET rate was lowest for native Danes and highest for children of immigrants who arrived at school-age. Comparing the two-year groups shows that, while the NEET rate was higher for women than for men for the 1995-year group, the opposite is the case for the 2005-year group [corresponding to Montgomery, Petersen and Jervelund’s (2018) findings]. A possible explanation for this shift is that more women than men were enrolled in education in 2005. The increase in participation in education seven years after school is especially high for female children of immigrants. Note that the two groups of female children of immigrants are the only two groups where the NEET rate was smaller for the 2005-year group than for the 1995-year group. The 2005-year group was affected by the financial crisis in 2008; this may explain the increase in the NEET group for the men and native Danish women.
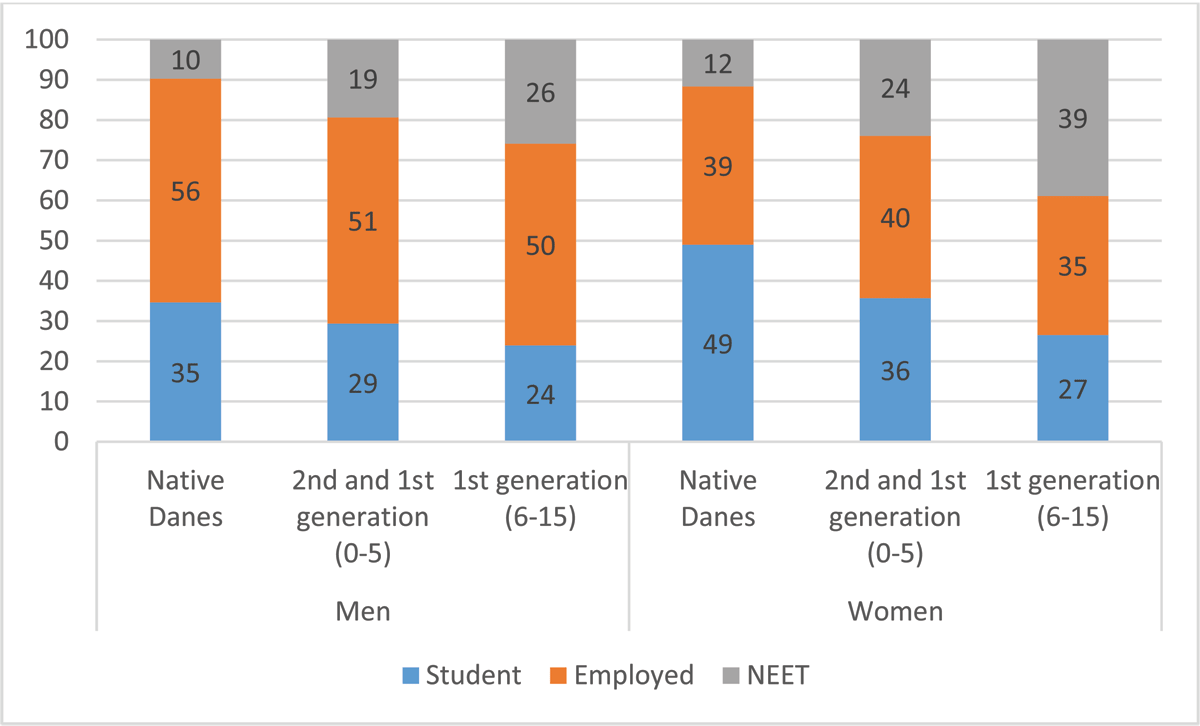
Figure 2
Distribution by labour market status seven years after completing compulsory school for individuals who completed school in 1995.
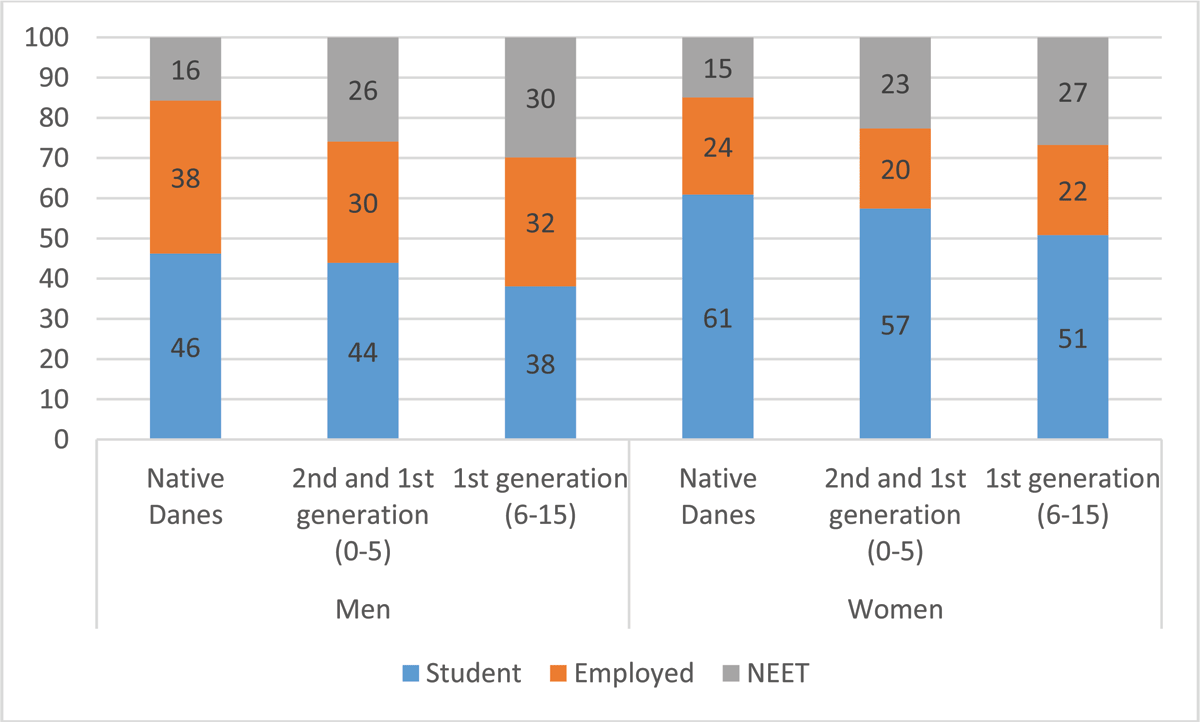
Figure 3
Distribution by labour market status seven years after completing compulsory school. Individuals who completed compulsory school in 2005.
Table 4 shows the results from regression analyses of how the probability of having NEET status seven years after compulsory school is associated with having NEET status for at least two years of the three-year period right after school (see Table A.6 in the online appendix for results for the full model). Having NEET status in the three-year period right after school was associated with a relatively high risk of having NEET status seven years after school. However, this relationship was slightly weaker for children of immigrants who arrived at school-age than for native Danes. For children of immigrants who were born in Denmark or who were preschool aged when they came to Denmark, I also found that, for the 2005-year group, the relationship was weaker than for native Danes. Thus, the higher risk of having NEET status seven years after compulsory school seen for children of immigrants when compared with native Danes is probably related to a risk of NEET status in the years just after completing compulsory school; it does not seem to be due to an increased scarring effect.
Table 4
The probability of having NEET status seven years after completing compulsory school. Individuals who completed compulsory school in 1995 and 20051).
| 1995 | 2005 | |
|---|---|---|
| Without controls1) | ||
| NEET (after completing compulsory school) | 0.406*** | 0.450*** |
| (0.005) | (0.005) | |
| Generation 22) | 0.106*** | 0.059*** |
| (0.013) | (0.011) | |
| Generation 13) | 0.162*** | 0.071*** |
| (0.016) | (0.017) | |
| Generation 2 * NEET | 0.023 | 0.001 |
| (0.027) | (0.023) | |
| Generation 1 * NEET | 0.122*** | 0.084*** |
| (0.002) | (0.003) | |
| Controlled for completed education, children and family characteristics1) | ||
| NEET (after completing compulsory school) | 0.262*** | 0.278*** |
| (0.005) | (0.006) | |
| Generation 22) | 0.022 | 0.013 |
| (0.013) | (0.011) | |
| Generation 13) | 0.016 | 0.049** |
| (0.016) | (0.017) | |
| Generation 2 * NEET | 0.017 | 0.027 |
| (0.026) | (0.022) | |
| Generation 1 * NEET | 0.071*** | 0.050* |
| (0.021) | (0.021) | |
| N | 58,846 | 59,395 |
[i] Significant-level: *** 0.1%-level, ** 1%-level, *** 5%-level.
1) Controls for country of origin are included. The reference categories: not having NEET status after compulsory school and native, see Table A.6.
2) 2nd generation + 1st generation (0–5 years old at arrival).
3) 1st generation (6–15 years old at arrival).
Gender, completed education, children and family background also affect the individual’s risk of NEET status (see Table A.6). For the 1995 year group, women had a higher probability of having NEET status than men. For the 2005 year group, men had a higher probability than women when I only control for having NEET status just after school and immigrant status, while I found no gender differences when controlling for other characteristics (e.g., children and level of completed education). Having children increases the probability of NEET status seven years after compulsory school, whereas completing education beyond compulsory school decreases this probability. Furthermore, disadvantaged family background increases the probability of NEET, even when controlling for education and children.
Conclusion
In this article, I have examined how children of immigrants fare compared with native youth in Denmark with respect to the transition from compulsory school to further education and work by focusing on NEET status. In accordance with the international and Danish literature (Montgomery, Petersen & Jervelund 2018; Tamesberger & Bacher 2014), I found that NEET rates after completing compulsory school are higher for children of immigrants than for children of native Danes, but also that the difference between children of immigrants and natives declined during the analysis period. For the 1995 year group, arriving at school-age increases the probability of having NEET status by 19.8 percentage points compared with native Danes, whereas the figure is 5.9 percentage points for the 2009 year group. In comparison, for the 1995 year group, arriving at preschool age (or being born in Denmark to immigrant parents) only increases the probability of NEET status by 4.2 percentage points for the 1995 year group and 1.8 percentage points for the 2009 year group.
The theoretical and empirical literature stands divided on whether upward mobility is higher or lower for children of immigrants than for native children (Abramitzky et al. 2019; Dustmann & Giltz 2011; Hammarstedt & Palme 2006; Zuccotti & O’Reilly 2019). I found that disadvantaged family background explains the overrepresentation of children of immigrants in the NEET group for the 2009 year group. When I control for family characteristics, I found that children of immigrants have a lower probability of having NEET status than natives. Thus, I found that children of immigrants experience more upward mobility than their native counterparts. The theoretical literature provides at least two explanations for this result. First, immigrant parents are not able to exploit their abilities and potential in the Danish labour market due to language limitations and insufficient knowledge of the Danish labour market and therefore, the measures used when analysing data underestimate parents’ resources. Second, many immigrant parents are more willing than native Danish parents to invest in their children’s education, because they are positive selected (relative to non-migrants) for their drive and ambitions (Abramitzky et al. 2019).
NEET status at an early age may be harmful for future employment prospects. Previous research has found evidence of a scarring effect (Bäckman & Nilsson 2016; Ralston et al. 2022), but has—to my knowledge—not examined whether the scarring effect is greater or less for children of immigrants than for natives. I found that NEET status in the period just after compulsory school is positively related to the probability of NEET status later in life (measured seven years after compulsory school), which indicates the presence of a scarring effect. However, I also found that early NEET status is not more harmful for children of immigrants than for native Danes. The higher risk of having NEET status seven years after compulsory school for children of immigrants compared with native Danes is related to a higher risk of NEET status in the years just after completing compulsory school, and is not explained by greater scarring effects. Thus, my findings indicate that ethnic discrimination in the labour market (see Dahl & Krog 2018) and a concentration of immigrants in deprived neighbourhoods (see Damm et al. 2022) do not imply a higher scarring effect for children of immigrants than for natives.
The positive story in this article is that children of immigrants experience more upward mobility than native Danes, and that NEET status early in life does not seem to have a greater negative effect later in life for children of immigrants than for native Danes. But still, children of immigrants typically have parents with fewer socioeconomic resources than their native counterparts; this contributes to explaining the higher risk of NEET status among children of immigrants. Providing support in kindergarten and school to children with a weak social background is import for all children, and seems especially important for children of immigrants.
A strength of this study is the use of a large full-population sample, which means that I avoided problems with attrition typically found in survey data. Register data are very suitable for analyses of development over time and correlations between different factors, but of course such data have some limitations with respect to deeper explanations of the development and correlations. For example, the empirical analysis in this article cannot explain the decrease from 1995 to 2009 in the risk of having NEET status for children of immigrants. Possible explanations are improved reception of immigrant children in Danish society (e.g., in schools), changes in the composition of immigrants coming to Denmark and increased knowledge of, or focus on participation in educational and employment activities in the immigrant groups to which the newly arrived immigrants belong. Another limitation is that I only looked at a period of seven years after compulsory school, and the children of immigrants may be less successful later in life, for instance if the barriers for children of immigrants are greater in the labour market than in the education system. Despite these limitations, use of register data in this article has contributed with new knowledge on the intergenerational mobility and scarring effects of early NEET status for children of immigrants.
Looking forward, the upward mobility of children of immigrants might increase even more if discriminatory practices in the education system and the labour market are reduced (there is some evidence of discriminatory practices, see Dahl & Krog 2018; Jakobsen & Liversage 2010), and if support for children with insufficient Danish skills—in particular for children who arrive to Denmark at school-age—is increased. As described above, research has shown that language skills are an important mediator through which age at migration affects educational attainment (see Basu 2018). Finally, the importance of family background underlines the importance of increasing participation in the Danish education system and labour market among adult immigrants, that is, the generation of parents.
Additional File
The additional file for this article can be found as follows:
Notes
[5] The percentage of the Danish population who are first- or second-generation immigrants from a non-Western country increased from 1% in 1980 to 9% in 2021, while the percentage of first- or second-generation immigrants from a Western country increased from 2% in 1980 to 5% in 2021 (Statistics Denmark 2021a).
[6] A three-year period is also used in Bäckman et al. (2015); Montgomery, Petersen and Jervelund (2018).
[7] An alternative would be to use data for years seven, eight and nine to calculate NEET status. However, I would then have to use older cohorts in the estimations.
[8] Young people participating in upskilling activities or unpaid job training organised by the public employment services are not included in the NEET group (see also Statistics Denmark 2019).
[10] Family situation: which family members the person lives with. If the person lives with two parents, these may be the biological mother and the mother’s husband.
[12] I included individuals living abroad for a short period during the four-to-six-year period after completing compulsory school, because many young people travel or live abroad for one or two years after completing upper secondary education.
[13] Tables A.1, A.2 in the online appendix show the distribution by immigrant status, country of origin, as well as age the year of completing compulsory school. Tables A.3, A.4 show the percentage with children and the percentage who have completed upper secondary or higher education seven years after compulsory school.
Competing Interests
The author has no competing interests to declare.